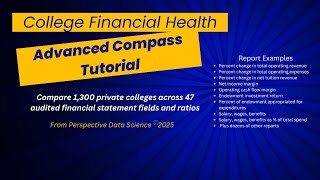
Gary Stocker walks through the College Financial Health Advanced Compass, which tracks 47 financial reports from nearly 1,300 private colleges. The tool lets you pick a college and compare it to five peers across metrics like revenue growth, cash reserves, and salary costs, benchmarked against 25th, 50th, and 75th percentiles.
Chapters
Hi, it's Gary Stocker from College Viability. I have another tutorial today on an expanded product from Matt Hendricks at Perspective Data Science. The College Financial Health Advanced Compass now includes 47 reports from the audited financial statements of almost 1,300 private colleges for the years 2016 through as late as 2024. The app is straightforward, but I wanted to show users how it works. A link to get the full list of reports will be available at the end of this video tutorial. Let's take a look at the College Financial Health Advanced Compass. I've pre-selected a set of demo colleges for this brief tutorial. You can see the names of the colleges, and this is going to be the school that we're going to focus on. And I've selected a set of 5 reasonably similar size, although smaller in general colleges than our demo college. And here's essentially the way the app works. You can select whatever college that you like from a set of about 1,300. You can see the college I've selected. You can do the same thing from a set of comparison schools that you might want to compare your target school to. And again, you can see the set of 5 that I've selected here. Beyond that, it's pretty straightforward. I have pre-selected the percent change in total operating revenue since 2016 and the percent change in total operating expenses also since 2016. I'll bring both of those charts up and we can see the definitions. I'll go over those briefly. The dashed line at the top represents the 75th percentile, the solid line in the middle represents the 50th, and the smaller— the larger dashed line at the bottom is the 25th percentile. The blue is our demo college. The green is the, is the median for our set of comparison or peer colleges. And the red is from a set of 9 recently closed private colleges. And you can see the set of 9 colleges listed up here. And from that, you can essentially select any one of the 47 sets of reports that you'd like to do. I'm just going to focus on the top graph just for simplicity. And I'm going to just kind of go through this. We're going to take a look at one of the charts that shows that our target college, our demo college, is bigger. And they have a lot more cash and cash equivalents than their peer colleges. Again, this is our demo college, this is our peer. When we take a start looking at though at ratios, and you can see the list of reports, and again I'll have that list, the entire list, available for access at the end of the show. Let's look at ratio. And again, anytime we normalize an absolute number with a ratio, we're going to get a better comparison. So now we can see there's a 75th, there's our peer group, there's the 50th, and there is our demo college, 25th, and the set of closed, uh, closed colleges. I'm not going to make any analysis here. You can do your own analysis. You can get access to the free version of this app, which has just a sample set of 5 reports, or the full version. Again, I'll make that link available to you in the show notes. That's the essence of what the app does. I'll show you a couple more examples. I want to go down and I want to look at— again, we can look at net tuition revenue. It's going to be a lot higher for our demo college, but let's look at that as a percentage. Let's look at that as a percent change in net tuition revenue. And now we get a normalized value. We can see that our target college, our demo college, has a lower percent change. It's down about 10% in 2023. Our peer group is down only about 5%. Again, draw whatever conclusions that you want. I'm just trying to show what analysis can be made from the software itself. And let's look at a couple more. Let's take a look at capital expenses to depreciation. Again, this is a ratio, this one right here, capital expense to depreciation, that shows, that shows a college's investment in its property and equipment. And the ratio typically needs to be above 1. And you can see that for the most part, all our colleges are doing that on the peer group. But in the last year since 2019, you can see our demo college has dropped below that. For the most part, every year, there's one exception in 2022, probably the result of, of pandemic funds. And again, the conclusion that can be drawn from this kind of data is if it's below 1, the college is probably falling behind on its property, plant, and equipment maintenance, new purchases, those kind of things. And then finally, let's take a look at salary, wages, and benefits. Let's take a look at national expense notes. You can look at salaries and wages, but again, it's going to be bigger for our bigger college. But let's take a look then at what it's like when we have normalized it. Let's look at it as a percent of total spend. There's the millions. And as a percent of total spend, you can see that our demo college in 2023 spent about 63, almost 64% of its total spend for wages. And you can see our peer group was much lower than that. So that was a brief demo of Perspective Data Sciences College Financial Health Advanced Compass. There'll be more information in the notes for this video. If you have questions, you can drop me an email at gary@collegeviability.com. We can also arrange for a private demo of this product and other products available through Perspective Data Science and those from College Viability as well. Thanks for making time to listen. Gary Stocker for College Viability.