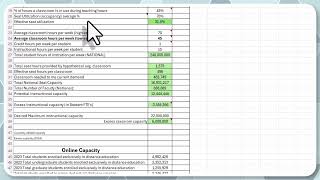
In this video, Gary Stonker walks through two deliverables—a detailed Excel workbook and an accompanying methodology document—designed to estimate on‑ground (classroom) and online learning capacity for U.S. colleges, covering both undergraduate and graduate programs. He explains that the primary data source is IPEDS, with some supplemental averages, and outlines the spreadsheet’s structure: green‑shaded cells contain formulas, while non‑green cells are editable inputs that users can modify to test different assumptions (e.g., changing seat‑utilization rates from 70% to 50%). By adjusting these inputs, users can see downstream effects on calculated capacity. The model reports roughly 6 million excess classroom seats and about 50 million potential online seats (with 2 million sections), yielding an excess online capacity figure after subtraction. Similar calculations are shown for graduate students, noting that graduate numbers may need scaling. Stonker also points out ancillary tabs—a testing worksheet and an outdated master sheet—available for experimentation but not maintained. Throughout, he encourages users to customize inputs and explore the impact on capacity outcomes.
Chapters
Hi, it's Gary Stonker describing the two documents that you will receive for the work that we have been doing on estimating capacity for both on-ground and online learning in the United States. The first document you're going to get is an Excel file. I'll briefly explain that. You can look at the calculations, and I'll show these in more detail for undergrad online capacity. And for graduate online capacity, the other document that you will receive— the second document you will receive is the methodology that I use for calculating and setting up the spreadsheet that you're going to be looking at for college seating capacity, again, for both on-ground, online, undergraduate, and graduate students. The data sources used for these calculations were from IPEDS. And the overall design of the spreadsheet is really to give users a chance to make their own assumptions, and I'll explain what I mean by that in a second. But first, to set this up, this is the worksheet for undergraduate capacity. This is the worksheet for graduate capacity. Similar but not identical, and identical numbers of course are being used. And the green colors all have formulas behind them. So you can see as I click on cell B28, it's got a formula behind them. I would encourage you not to change the formulas, but of course if you want to resave the file as something else, you can do that. Then all of the data, all the other data points are inputs. Some of them are from IPEDS data. Some of them are from a variety of sources where averages are estimated. And it's all designed so that you can change the estimates and see what impact that has on the final result. And we can see that, for example, when I change the number of seat utilization, I go from 70% to 50%, that will change the calculations down here. So feel free to edit those numbers as you deem appropriate. In addition to this top section, some of the numbers that were entered as I was setting this up but not ultimately used— but in the case of, as I always do, I keep numbers that I have entered for potential future use. But you'll see the numbers that are always impacted because by double-clicking on any of these cells, you can see which cells are impacted, um, by that, by that formula. So let's briefly look at undergraduate capacity, and we'll look at both the classroom capacity. And you can see this is the excess classroom capacity based on all these assumptions. And what I want you to do when you're looking at these data points, if you've got different data sources or want to play with different data numbers, different data points, feel free to do that. These sourced are from iPads almost, I think, exclusively. And you can make any kind of changes to these non-green fields that you want to see the impact. And so at the end of the day, the excess capacity for classroom capacity is 6 million seats. Okay, we can do the same thing for online capacity, a different set of assumptions. And again, you can make changes here for these assumptions that I've made or come from other sources. And we can see at the end of the day, the total potential online capacity is 50 million and change, sections nationally is 2 million and change, and when you subtract the two, when you do the math on that, B62 minus B50, this is the excess online or distance learning capacity for undergraduates. The same logic applies to graduates, classroom capacity for graduates, same kind of numbers, excess capacity. Even as I look at this, this is probably high, We need to probably adjust some of these numbers for a fewer number of graduate students. And again, the same, same math is used, same logic is used for online capacity for graduate students as well. And again, these are the data points I used, and behind each one of these you can actually click on the assumptions to see what those are in terms of the basic algebra or the basic math involved in the assumptions. The last item, I have a testing tab, testing worksheet tab, and do not use master. You're welcome to play with those, but I was not kept those up to speed. Those are just my initial setups for when I set up the file.