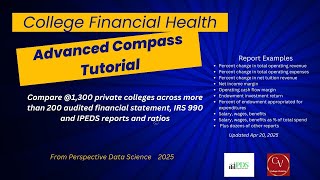
Gary Stocker walks through the Advanced Private College Financial Compass, a tool that benchmarks individual private colleges against 1,300 others using audited financials and IRS filings. It tracks operating cash-flow margin, net assets, and expenses per student, color-coding how each school compares to the median. The tool also analyzes vendor costs like HVAC and IT spending.
Chapters
Hi, it's Gary Stocker with College Viability doing an updated tutorial on the Advanced Private College Financial Compass developed by Perspective Data Science. And for those that follow the College Financial Health Show that's live every Tuesday and recorded on the College Viability YouTube channel each week, I've got some updates that Matt Hendricks from I'm going to share some updates that Matt Hendricks, who founded Perspective Data Science, has developed for this application. And what we're going to be looking at is some data and some fine-tunes, some updates that have been put into the new product. I'm going to share some of the updates to make the functionality easier, the navigation easier, and the reporting easier to read in this updated version of the Advanced Private College Financial Compass. And first, we're going to look at the set of 9 recently closed colleges. And you can see the set of 9 right here. You're going to see a line that I'm going to reference in a moment that talks about these 9— you can see a line on the charts that I'm going to reference in a moment that references these 9 recently closed private colleges from 2023 and 2024. I've selected 2 colleges, um, for the initial demonstration: Limestone University, which recently announced its closing, and Webster University, which has a mixed bag of financial reports out of the Midwest, out of St. Louis, Missouri. What's happened with the app, as you can see, there's always a two-graph format, graph 1 and graph 2, and we can choose from a whole set of dozens and dozens and dozens of reports. And these reports come from audited financial statements, they come from the IRS Form 990, and some of the reports come from IPEDS data from the National Center for Education Statistics. And they tend to be balanced They are categorized by what you initially see on an audited financial statement: the balance sheet, followed by the statement of activities, followed by the cash flow statements, followed by some endowment notes, and then some natural expense notes, and then some IRS 4990, and then some IRS Form 990 comparisons as well. Let's take a look at some examples here. So I've got the operating cash flow, and let's talk about the lines as I go through this. We talked about the red line before. This red line is the median value for set of 9 recently closed private colleges that I talked about. The, the long dashed line represents the 25th percentile for about 1,300 private colleges, private 4-year colleges. This, the solid line represents the median for those colleges, and the small dashed line represents the 75th percentile. In this graphic here, the blue lines through all the charts that I will show you is for Limestone College, and the green line is for Webster University. You can turn any of these lines off at any time to get a different view of what the data looks like. So in this case, we're looking at operating cash flow margin. I'll show a couple of examples, and you can see both of our demo schools really, and compared to the, compared to the set of recently closed private colleges, are not performing well. That's not the point of this tutorial. It's just to show you how to read that. You can see the years being studied down below from 2016 to 2024. And again, we can turn off any one of those lines that we want to down here. Graph 2 I have set up. Is total net assets. Let's change it to something else. Let's change it to total expenses. And we're going to do total operating expenses. And this is one of the new efficiency improvements in this version of the Private College Advanced Compass app. You can look at this chart for our two colleges. The green college is going to be Webster University. The blue college is Limestone University. We've got the raw values, so the total operating expenses in million. You can hover over the top of each of these values to see what the numbers are. You can see what it is for 2024. Webster has reported their 2024 data. Limestone University has not. But we can change that from the same total operating expenses. We can do that per FTE to get a more standardized comparison. We can see what those expenses are per student, and we can see that Limestone trends higher than Webster. We can see that both are a little bit above the closed college line recently, but both are— but they split between being above and below the closed college set prior to that. We can look at the percent change. And again, this percent change is always since 2016. So we can see that Limestone College total expenses are up 13%, almost 14%. Webster University expenses are down almost 15%. And we can do the same thing, just for example, for revenues. Do a, do a quick mix and match. And we'll look at revenues. And look at that, let's look at that percent change. And again, we can see the revenues are down for both in the area and sometimes below that closed red line set. And one thing we haven't looked at is the standardized comparison per $1 million in operating revenue. This is kind of a mixed up chart on, on this particular set of colleges, but we can change those at any point in time. We can change that. Let's look at Lion, Lion University in, in Arkansas. And again, we can see operating cash flow margin. Limestone is, has some serious issues, looks like. And again, we can see that graphic here as well. There's two other features that I don't think I demoed in the first version of the tutorial for the Private College Advanced Financial Compass. And that is the data table. And this effectively takes all of the data from Perspective Data Sciences data table. And the technology behind that is Dr. Hendricks has used artificial intelligence to capture images of every audited financial statement from 2016 to 2024, and for the IRS Form 990 data, and then pull the data from IPEDS for all of the data that you're seeing. And we can use this private college data table for 13-some-odd colleges and the values from graph 1 and graph 2. So we have net cash margin, total operating revenue that ties in from up here, operating cash and total operating revenues. And when you change those up here, it will change in the private college data table down here. Really what we're looking at is variations from this group median of 1,300 private colleges. And essentially, color is not good on these far two right-hand columns. The darker the color, the more the deviation from the median for these colleges. So we can see, for example, Limestone University for its net cash margin at negative 23%, obviously as well below the median on that kind of stuff. The total operating revenue was, you know, close to what that median value is. The blue is— the blue value indicates a number higher than the median in terms of, in this case, total operating revenue that we see here. You can of course sort these to see which do well and which do not. You can do that on any of those as well. And we can see that Limestone has issues in net cash margin all the way through, and, and Webster less so, but still notable differences from the group median. And then finally, the vendor prices. And this was in the last month or 6 weeks, and we're recording this in late April 2025. We can do the same thing for our colleges. So I brought up 2 colleges, and I've used the database to say either Bridgeport University or Lyon or Lion College, excuse me. And we can see the data points for those. And what we're looking at is the state, and you can sort by any of these functions, you know, these data points, the fiscal year, and I've got it for anything greater than, greater than or equal to 2021. We can see the FTE enrollment, and we can see that the University of Bridgeport is considerably larger than Lion College. And what we're looking at here is vendors. In some cases, the vendors will be the same. That's not the case here. But we can also look at the description of the vendors And then we can look at the harmonized or consistencies. Well, for example, we can see that University of Bridgeport for HVAC is a little outside the median. The median, they're about 2.25 higher than the median for the group. And we can see that Lyon College for information technology, the amount per FTE is considerably higher. It looks like it's about 1 to 1.5% standard deviation above. And the amount per $1 million in operating revenue is greater than 1.5 standard deviations from the group median. And you can see that all the way through. It can be sorted accordingly. Those— the no color is good, darker color is not so good for each of those comparisons. And again, the database functionality for all these is available to be able to all do all sorts of sorts, look at any one of the 1,300-some-odd colleges in this list and compare them across all of these columns that you see across the top. And again, the field changes are from the data charts up above. And the final feature in the Private College Advanced Financial Compass is access, easy access to the audited financial statements for the main university. In this case, it was Limestone, was our original college. Webster and Lyon were comparisons. You can actually grab the audited financial statement from the last 6 years, 8 years, I guess it is, 8 to 10 years, um, in the chart itself. So in the show notes, I'm going to make sure to include access to the— so in the show notes, I'm going to include more data about the app itself. I'll include the reports that are available, and I'll also include, of course, links to acquire the Report to Purchase report. To purchase the report for your college's use. And as always, we're available to do demos for this product. I will leave my contact information on the show notes as well for you to set up a contact information meeting for you to reach out if you would like to do a private demo of the Private College Advanced Financial Compass for your organization.