The College Financial Health Show for February 11, 2025. A financial health and viability review.
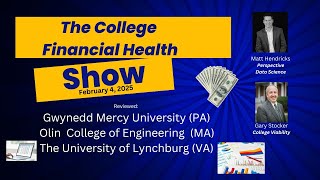
In this episode of the College Financial Health Show, host Gary Stocker and data‑science expert Matt Hendricks examine the financial health and long‑term viability of three private colleges – Gwynedd Mercy University (PA), Franklin W. Olin College of Engineering (MA), and the University of Lynchburg (VA). They walk through the data sources they use (audited financial statements, IRS Form 990, IPEDS), demonstrate the Advanced Compass and Strategic Compass apps, and apply a series of financial‑health metrics: net‑income margin, payroll‑allocation norms, enrollment funnel trends, endowment size, draw policy, capital‑expenditure‑to‑depreciation ratios, institutional grant levels, tuition‑and‑fee revenue, and major‑completion patterns. For each school they identify red flags (e.g., Gwynedd Mercy’s –11 % net‑income loss, Olin’s eight‑year streak of negative net‑income despite a large endowment, Lynchburg’s 12 % net‑income loss and high endowment draw). They discuss why these issues matter for boards, administrators, alumni, and suggest concrete questions to ask. The episode also showcases product pricing (Advanced Compass at $4,500) and argues that peer‑group comparisons are essential for transparent decision‑making in higher‑education finance.
Chapters
It is Tuesday, February 11th, so close to Valentine's Day. We've got a loving show for you today. Hey, Gary Stocker with the College Financial Health Show. And what are we doing here? Well, we're looking at the financial health and in many cases even the viability of private colleges across the country. How can we do that, you ask? Well, colleges submit a lot of data, and some of the data they submit that's available for public use and comparison are their audited financial statements, their IRS Form 990s, and something called IPEDS data from the National Center for Education Statistics. We take that data, we make it mean something, and that's what we're going to do this show, and that's what we have done every show. Hi, my name is Gary Stocker, founder of College Viability, and I'm Matt Hendricks, founder of Perspective Data Science.
And so we do have a loving show today, huh? I feel I'm in a good mood. Um, yeah, so we, so we have 3 schools today. Again, I don't see any imminent closures or anything like that, uh, but definitely, so the point is there's a lot of questions that board members and administrators and faculty should be asking alumni. Um, so we're going to point out some questions to ask if you don't already know what's going on at your school. Ask questions. Why, why is this happening? What's What's the plan? So the schools we're looking at today are Gwynedd Mercy University in Pennsylvania, Franklin Olin— I just have Olin College. Is it Franklin Olin?
It's the Franklin Olin College of Engineering.
Oh yeah, I'm going to call it the Olin College of Engineering for short. And then the University of Lynchburg in Virginia. I'll start with Gwynedd Mercy and I'll share my advanced Financial Compass app, which has got a lot of new things in here. So as we've been sort of hinting at several shows now, this is, uh, really split into two tiers now. The Advanced Compass is— there's a free tier which gives you access to some variables, uh, and then a paid tier, which is what you're seeing here. On the free tier, um, there's a lot of new data in here. I'm going to add a lot more. I have the entire statement of activities to add, um, and other ratios that may be useful. Basically, this is broken up the way that a typical audit is. As you know, this is all audit data that's scraped by an AI and put into my database and cross-checked numerous times and then put into this app. So right now I'm light on the statement, statement of activities. I just haven't had time to add all of the data in, but it's all ready to go. But it's laid out the way that you would see on a balance or an audit Including where you typically see this stuff in the notes, the endowment notes tend to be way down. And even after that, usually, actually, probably before that, you see the natural expense, usually called functional expense table, but I actually pulled the natural expenses out of that table. So that information is here. And so this is going to be useful for a number of things. If you're a board member, It's, it's all about looking at your audit and understanding if a number is weird or not. And I'll just give you an example with a new, a new fact and a new variable I have in here with the amount of your budget that's spent on salary, wages, and benefits. You know, if you're a board member, it's really important that you kind of keep that under control and you want to know what's normal and what's not normal. Well, here it is. A normal allocation to compensation in your budget is about 53%. That's the median of all private schools in the country. An abnormal amount would be higher than 59% or lower than 49%. So it's a pretty tight range where schools allocate to salary benefits and wages. A little bit, maybe counterintuitive, this red line, remember the school that schools that struggled financially and eventually closed, take a look at what their spending was. It's a bit counterintuitive that they're very low on allocations to payroll, right? You would expect a struggling school to have high allocation to payroll, but it's actually the opposite. And there's a sharp drop. That happens right before they die. I don't know if I have a great story for that right offhand, but just to say that if your school looks like this, start asking questions. It's probably not healthy, right? This is not a healthy track.
It could be— for those, for those, Matt, who count, last count, there were 45 different reports for about 1,300 private colleges from the years 2016 to 2024. See 2019 on there now.
Yeah, yeah, I mean, I've talked about my own school a bunch of times, but I'll just kind of show you where those numbers show up here. It looks like I need to fix this. It's supposed to be, supposed to be cut off here where I have missing data. But anyway, the University of Tulsa had a really high staffing issue that we identified around like 2018 or '19. And you can see the really high spend here on spending allocation on payroll and they fixed it, right? I mean, it was, it was not the easiest thing in the world to get everybody on the same page, but we eventually did and they fixed it. In fact, maybe more than fixed, went too far. All right. So another question to ask if you're on the board now, like we used to be really extreme on the high side. Now we're extreme on the low side. Is this nor is this good? All right. I'm not saying it's bad or or anything, but it could indicate odd spending allocations that should be fixed. Right. And on the other side of that, probably the place where the money is going is in this other group, which is a lot of stuff in here. IT, advertising, vendor contracts is the big one in this other natural classification spending. And you can see University of Tulsa It appears to me getting carried away again with the, and already were carried away with other spending.
Look how far they're above the 75%.
Yeah. So these are vendor contracts, probably for the most part, advertising, all that stuff, travel.
Goodness gracious.
Yeah. Um, I'm not there anymore, but I would ask about that if I were.
I think so.
Okay. So anyway, the, there's a lot of information on here. I'm going to be adding more. Uh, so please check that out. at least check out the free tier. Oh, another thing I added is you can see, uh, let's see. Oh, I picked the wrong— if I put Tulsa up here, for example, um, your school you're going to study, the audits will automatically populate down here. So it's really quick to cross-check with the audits. I can just click on that. There's the audit. Bam. All right. Really, really handy. Um, that was for me in large part, just, uh, I was constantly going back to the Clearinghouse and it's like, this is super inefficient. I just want to be able to click on that and be able to see it. So there you go. All right, on to today's show. Let's do this. Gwynedd Mercy. All right, what did I have for my notes? I think some recent issues with, um, net income losses, but I don't see anything that's catastrophic. They have perhaps some issues with, um, Deferred maintenance and issues with declining property and equipment value. Again, all these are questions that need to be asked. Why are we not spending enough potentially on property equipment, or are we? Let's see what they, what they have to say, that kind of stuff. But let's start with net income. There's so many variables in here now, it's really going to be handy to search. So I'll be doing that all the time. So net income margin.
Okay.
So this is what I don't like. They have 11% net income loss here. 2022, they had a positive, but the thing I wonder is a lot of the COVID relief money, sometimes the timing was a little bit off and ended up going to fiscal year 2022, whereas you see most schools were fiscal year 2021. So perhaps, I don't know this for sure, but it's possible that this was COVID relief money sort of artificially propping that up, in which case they're really kind of following this path. Right. And still a -11% loss here. I don't have 2024 for them yet. Right. Their audit's not, not in. So I worry about this. This is a -11% deficit, which is pretty big. So that would need to be fixed. Let's take a look at the track of their expenses and revenues to sort of see what's happening here at a high level. Is it the expenses that are the problem? The revenues? It's usually both, as you know. But let's take a look at Changes in operating expenses. All right, change. I got them both populated here. And so what you're going to see is the— everybody starts at zero and it's the change since 2016. And you see that things were great initially, but things sort of went sideways for them. It looks like about 2020 or 2019. And since then it's been a pretty tough route, and their revenues are down 2.5% overall since 2016. That's after being up 21% just a few years ago. So some pretty sharp declines in operating revenue, and they're doing a bit, it looks like, to keep their expenses in line, but expenses are still 9.5% up while their revenues are 2.5% down. Is the simple math there— you're going to get a big deficit, right? And that's what's happening. We got 11% deficit now. So let's take a little— let's dig a little bit into the revenue side. Let's look at net tuition revenue. Again, I have the flat value, the actual raw value, and the percentage change since 2016. I'm just going to focus on percentage change. Follows the same track, right? We have a sharp decline in net tuition revenue. I mean, really, something happened here. It looks like about 2019. And has not been fixed, it appears. And again, this is a great example.
This is a great example of a college that would benefit from using the college strategic compass. Do you want to say, spend 30 seconds just talking how they could use something like that?
Yeah, I mean, one of the things on the strategic compass is the whole enrollment funnel going way back to like 2010. All right, so you can see your admit rate. Your yield rate, your number of applications. So starting at the top, applications, admit rate, yield rate, your retention rates, your graduation rates, all compared to your peers. Yeah. And once you know all of those parameters, you know what your enrollment is going to be for an arbitrary number of years going forward. Right. So there's a simulator on there that does all that. But my, my guess is based on experience and seeing this kind of thing happen where you build momentum like this is is that something actually abruptly happened back here in 2019 or so, or 2018, and hasn't been corrected, at least not fully, and that will build this momentum so that year over year you lose students and lose net tuition revenue. And again, how does that cycle work? It's really simple. Your change in net tuition revenue is really a function of the graduating class, which is the class that came in 4 years ago, right? And how big your new class is. If your graduating class, the class that came in 4 years ago, is smaller or bigger than the class that just came in, your school's going to shrink, right? And it will do that for 4 years in a row. All right. Um, this is how the dynamics work. This isn't a math show, but I could show you how that all works. There's a simulator on the Strategic Compass that does that.
We'll show the enrollment numbers here in a couple of minutes.
Yeah. Okay. So is it following that pattern? Am I right about that?
Oh, yeah, absolutely. 4 years. If you look at it, if you look at one like this, I can make the case they're going to have at least a 7 or 8-year downward pattern because they've had the negative pattern for, you know, 4 or 5 years, another 4 years to fix it. Do the math. That's 8 or 9 years.
Yeah. And so the thing about it is, like, I think a lot of administrators or board members might say, hey, we just need to you know, get back to this, right? Get back up to here and just do that next year. Well, it's impossible unless you're going to give away the store. It takes like 4 or 5 years to get this back up because you have to do it 4 years in a row for 4 straight years. You have to enroll a bigger freshman class than you graduate. You have to do that 4 times in a row and then you get back to there.
All right. So in an intensely competitive market, which makes that exceedingly difficult to do.
Yeah, yeah. To get back to this in one year, you'd basically have to enroll 4 freshman classes in one year.
All right.
Like, that's, that's probably not a great idea anyway, if possible. All right. So net tuition revenue is down 10.5% since 2016, but really sharp decline since 2020, actually. So that's going to be quite stressful for them, I'm sure. It looks like they've already sort of responded to this. I don't know this for sure, but, um, you see the sharp drop in their property and equipment value here, $61 to $47. They sold a building. I checked it out. They sold a building for $30 million and put that money into the endowment. So let me show you the endowment. So the endowment value— so here's the endowment jump I was telling you about.
Yep, look at that.
$36 to $70. They sold a building and put the cash in the endowment there. Um, but the— so the change over time, I think everything looks fine on the endowment if I remember right. Um, just double-check. Uh, change in the endowment. So you have this big surge, but for the most part this looks fairly normal. Up 24% and then the surge. Yeah, a little bit below. Let me see what— why that's happening. So again, there's lots of things that affect the endowment growth. One is appropriations. Okay, huge appropriation here in 2019. Oh, so that, that is this, that's the building. Yeah, that's not great. So that started it way down and looks like this big surge here is again the sale of the property. But so they have this big draw and then since then really small draws. So they've really caught up. That's good. It's caught up for the most part and then beyond now with the sale of the assets. So the endowment actually is following a very bizarre path, but it appears to be getting back very volatile returns.
Um, let's sell that 30% draw a few years ago. That's, that's, that's not good, man.
Yeah. Big draw. And then, but then now a big asset sale and injection into the endowment. But yeah, none of that is really ideal. And this big loss here in 2022, I hope they asked their investment people what the heck that was all about. But it's possible since that injection of money went in, the timing could throw this calculation off, right? Because I'm doing the, the rate of return or the amount of return divided by beginning of year endowment value. And the timing of that injection of $30 million can really throw these numbers off. So I suppose that's what's happening here.
All right.
So endowment looks fine to me. But here's one thing I want to flag. The CapEx, capital expenditures. So again, you want this, this capital expenditures to depreciation ratio for the most part to be above 1 consistently. That would mean that you're replacing everything as it sort of wears out at the right pace. And you see that most years they're well below 1. Except for 2 years, it looks like. So they bought something.
They bought something, built something.
Yeah, this was definitely a building built here, it looks like. And then I suppose with that cash that they just injected from selling that property, they may have dealt with some deferred maintenance right here.
Yeah.
So that again, not ideal. Don't let this go on and then wait to sell something to finally deal with it. Build it into your budget, right? A healthy school would build depreciation into their budget and have that cash ready to go regardless if they sell a building or not. Um, so there you go. So there's a question to ask again. If you're— if you work there, ask, does our budget have depreciation in it? Chances are it doesn't, and you should probably change it. Uh, Olin College of Engineering. Franklin W. Olin College of Business.
There you go, man. You've mastered that now, man.
Yeah.
All right.
Uh, let's see. Net income. Net income. All right. Margin. Let's see the margin. Okay. So this is looking problematic. 1, 2, 3, 4, 5, 6, 7, 8 straight years. Of negative net income.
And Matt, there's a news story, a couple news stories out of that area that this college used to guarantee— it's an engineering college— they used to guarantee their students a 50% discount on tuition.
Uh-huh.
For since it started, this was maybe 20, 30 years ago whenever it started, and they just recently announced they can't continue to do that anymore for obvious reasons.
Yeah, yeah, they probably could have seen that a few years ago. 9 straight years or 8 straight years of negative net income. That is a long time to be running negative.
Look at it comparing to the closed colleges, that the red line.
Yeah, it's pretty bad. I mean, worse, about as bad as the schools in the last year of life here.
Yeah.
What's saving this school, though, I think, is they have a big endowment. You show you that they have a $425 million endowment. That's pretty big. And relative to their expenses, it's probably even bigger on a relative basis. Yeah, they have their endowments almost 10 times the size of their expenses. So that's how they were doing the, the basically a lot like the University of Tulsa, to be honest. They can just buy students, right? You can come for almost free and you can, they can do that. They have a huge endowment. Sure. But at some point you gotta make sure you're still in your budget, right? So Yeah. Uh, they have some big deficits to fix here. It looks like their plan is to fix it through net tuition revenue. Let's take a look at net tuition revenue and see what that looks like. Um, yeah. And I think if I remember right, just in dollar terms, it was tiny. Yeah. Only $6 million in net tuition revenue. So there's basically free, or is it a really, really small school? They have to check your data.
It's 300-some-odd students.
Yeah. Super small school. Not a lot of net tuition revenue. Uh, let's go net tuition revenue. Growth. I mean, look, you can see right there, there's some growth, but it's just not very much money, right? So, um, I mean, that's among the lowest 25% in the country. Um, so let's take a look at operating revenue though. Operating revenue. Yeah, it's kind of slow. So here's the deal. This school shouldn't have that. They're almost entirely depending on their endowment for revenue, which their endowment should be growing fast. So let's double-check that endowment. Is it growing normally? It is not. So this is their problem.
Goodness.
Their endowment is not growing very fast at all. 21% is not even close to the median, which is 15.
That's got to be below the 20th, 15th percentile.
So, um, Right away, again, a question I'd ask if I were them is, I mean, it's not necessarily an issue with net tuition revenue, although of course they can do better on that if they want. It's really an issue of the endowment not growing. And let's take a look at why, figure it out. There is one problem. This is way too high. So yeah, I mean, you could have predicted this 10 years ago, right? If you're going to draw 6% from your endowment. It's going to grow very slowly and you're probably not going to be able to afford the same kind of scholarship aid in the future, right? Just because of inflation. So, um, there you go. These are too high. All of these years are too high. So there you go. Well, why, why, why is it too high? Check your endowment spending policy. You can just click right here, search for spending policy and double check what it is. It should be 5% of the average of the previous 3 years, which is clearly not what they're using. Right here. That, that wouldn't give you those numbers. So that's one issue. Let's take a look at returns. Returns look good. That's really good. Returns look fine. It's just the appropriations are too high. Let's take a look at— there's another problem potentially with contributions. I'm sure these are going to be low because they just don't have a lot of operating revenue and they have deficits. Yeah.
Yeah, they're low. Yeah.
So a couple of things. They have deficits. So there's no money left over at the end to go back in the endowment. Right. So that's one issue you've got. The draws are just too high. And if you fix both of those things, your endowment should start growing normally again. And perhaps you could save your 50% discount if you wanted to continue doing that.
It looks like their population that was impacted right around— scroll back up on that one— right around the time of the pandemic, right around 2020 is when those contributions started going down.
Which is interesting because people have been very, very generous the last few years. You can see here, you can see this here as well, '22.
Maybe somebody's mad about something.
It could be that, yeah, you're going to take a hit when you when you say, hey, we're no longer going to discount 50%, I mean, even if it's the right policy, it can—
yeah, great point, great point.
Yeah, and it didn't need to happen. They could have— this is really on the board. They should have known that that spending policy was not sustainable. And yeah, that's not—
that's why we're here, Matt. We're here to tell these folks what they need to be thinking about.
Yeah, this is the app. You can check it right here. You can see your audits. I'm really tempted to click here and see what your spending policy is, but I know we're running short on time, so I'm going to go next, uh, to Lynchburg. But double-check that. Chances are that spending policy looks weird. It should be 5% of the previous 3 years. That's normal.
If you look at that, um, those— that spending policy after the show, drop me a note with what you find. I'll put it in the show notes.
Yeah, you can just open that thing and then literally search for spending policy and it should pop up. Uh, net income margin Okay, we're looking at University of Lynchburg in Virginia now, and this school is falling off a cliff with net income margins here. That is troubling, right? We've got, but we don't have 2024, so keep in mind this could have turned around, but it certainly looks like the momentum is going the wrong direction here. 12% net income loss. Let's take a look at revenues versus expenses. Unrestricted. Yeah. Revenues are flat. Expenses. But you see that sharp drop again?
Yeah.
Uh, expenses. Yeah. And expenses are kind of following a normal trajectory for the most part.
They're up.
Yeah. They're just disconnected there. They're up 16% on expenses, which is about normal. And their revenue is just flat.
Yeah.
About to go negative. It looks like. So, uh, let's take a look at some of these reasons.
And while Matt brings that up, you know, while Matt brings that up, he shares all the time and I'll reinforce, you got to balance your budget.
Yeah.
There's no way around it.
Yep. Uh, net tuition revenue has taken a big hit the last few years, couple of years. Again, probably look for some kind of problem here in the funnel starting around 2020, 2021, if not over here in 2019. There's a tendency to want to just look back at like 1 year or 2 years is probably the problem. You're going to find the problem further back over here. Let's take a look at auxiliary enterprise revenue.
And the strategic compass again would be a valuable resource to figure out what's going on.
Auxiliary enterprise revenue is also declining a bit. So yeah, they probably have an enrollment issue, which I'm going to see, we're going to see in here presentation. So their net tuition revenue. Not looking great. It's up overall, but really a deep dive. Let's take a look at the endowment. Actually, I do remember looking at this. Let's take a look here. Yeah, this, so this even makes it worse. In 2023, they had that big net income loss, right? That was despite drawing 8.6% out of their endowment. This is not This looks pretty urgent, to be honest.
Yeah.
Take a look at the endowment value.
And well, again, I've talked about this before. This is kind of like robbing the piggy bank when you don't have any more money left. That's not the best analogy, but that's kind of what's happening. Yeah.
That's so an 8— I have to double-check an 8.5 draw on your endowment. That's getting close to needing like the court approval, right? Unless it's unrestricted. So yeah, that's— it could be all unrestricted. Double-check that. But yeah, so it looks like they're struggling mightily and are trying to plug the gap with a big endowment draw, or did in 2023. But let's take a look at CapEx. Yeah, same issues here. Lots of built-to-building here. It looks almost identical to the first one, right? Gwynedd. Yeah, really low, low spending on buildings. Again, ask if your budget includes depreciation. If it doesn't right away, that needs to be changed. You should be budgeting for depreciation to cover all these losses every year. At least have a fund that's ready to go.
And Matt, before you give me the show, let's do something you've done before. Look at the endowment and the draw. Let's kind of give an estimated runway that Lynchburg has based on their unrestricted endowment. And their spending.
So they still have $135 million left. One of the things I need to add here is unrestricted versus restricted endowment values. It's really crucial because they're very different, right? You can pull on your unrestricted endowment as you wish.
Correct.
The restricted though, there's a lot of rules and I can double— I'm tempted to click here, but to see how big the unrestricted— that's really what's going to come down to for how big the runway is. If they have a big unrestricted endowment, they probably have a very long way, um, which is probably the case because, boy, that's close, I think, to needing court approval if you're going to—
that was for 2023. It'll be interesting to see the 2024 draw.
Yeah, so, um, at least be aware that this is, this, this is coming if you work at this school, uh, or you're an alumni or whatever, uh, understand what's happening here. They have a big, uh, deficit, even much bigger than probably we're seeing in the audit because they had this artificial draw here that you can't do more than once or twice, maybe. Yeah. And this endowment is going to suffer if they don't fix that immediately. So it looks, it appears that the, this is a pretty big endowment. If they have a lot of this is unrestricted, they're in decent shape to do this for a number of years. But again, the longer you do it, the less competitive you're going to be, right?
Yep.
It's going to make things harder for you in the future. Olin was lucky enough to be able to have this big endowment and offer 50% tuition and all this. But that ride is going to expire if they don't change their spending policy. It's just too big to keep that sustained growth in the endowment. The endowment needs to grow faster than inflation, and I don't think it has. So there you go.
Yeah.
All right. So should I hand it back to you?
Well, yeah.
All right.
So, so again, again, I want to reinforce, we talked about a couple of products and what you saw from Matt was the Advanced Compass, the College Financial Health Advanced Compass, 45+ reports for 1,300 colleges over the course of 7 or 8 or 9 years, depending on the 2024 financial statements. And Matt, I did some math on this. The price for that Advanced Compass is $4,500. But if you look at that and divide that over the 1,300 colleges, the 45+ reports over 8 years, it's 7 cents per report. So if you think you can beat 7 cents per report and do this yourself, go for it. But if not, this is a resource that, you know, of course I'm going to think every college in the country needs this. And it's not just the raw data. You know, Matt's focusing on the 3 colleges we're doing today. It's the comparison, Matt. You can't look at your own data. You and I have talked about this countless times. You can't look at your own data. You have to compare it to a peer group. And in the app, in the Advanced Compass, Matt creates a statistical K nearest normal peer group that are similar statistics to your college. And I think we also allow in the Strategic Compass your own peer group.
Oh, and I forgot to mention that.
Yeah, you added that. Yeah.
And then Advanced Compass, you can put any other peer set you want in there.
So it's a— I didn't show that, but just in the last week he's added, you can now add your own peer group. Group to compare yourself to. So, you know, invest a couple bucks in this. It's self-explanatory. You need a tutorial, you want us to, to join you and your board for a conversation about how to use it and how to think about it, we're there for you. Having said that, let's take a look at the other things that, that typically just reinforce what Matt just talks about. So we always start with enrollment. And, you know, enrollment— Franklin and Olin College of Engineering is, is a small college. They've been able to grow their enrollment a little bit. We see with both Gwynedd and Lynchburg, you know, substantial percent decreases in enrollment over the last 8 reported years. This is the 2024 College Viability App. The 2025 one is delivered to my desk today, so I will have that out shortly, and I'll have another year on this end, and, and 2016 will be a starting date. But you look at that, you know, is it down every year? It's been up and down at Gwynedd Mercy. It's been up and down at Lynchburg. But over the course of those 8 years, you know, you never want to see such large losses because you've got $20,000 net tuition, do the math. You know, 500 times 2 times $20,000, that's a big number. And that's going to impact a lot of things. We always run next-to-graduation rates because colleges are paid to graduate students, not just to get them enrolled and take classes. And, you know, I must be doing a pretty good job, Matt, of picking colleges because for the last few shows, you've had some really decent 4-year graduation rates. And Olin, you know, exceptional 4-year graduation rates. Gwinnett and Lynchburg are above my college viability threshold of 50%. You know, if you look across the board, they're both kind of growing into that. Credit to both. All three of the colleges you can see in the 8-year change have been able to improve their 4-year graduation rate. And Matt always teases me, I rant and rave about 4-year graduation rates, and yeah, and I do that with intent. That's why students go to your college, to graduate, not just to take courses. In conjunction with that, I did a quick look at grad students. Uh, Olin doesn't have any. And you know, it looks like both Grinnell and Lynchburg are growing their graduate enrollment. There was a story out from The Economist that I had in my This Week in College Viability show, Matt, yesterday, that there's research that shows graduate programs are not returning the investment to students to do that. So that's got to be a concern for colleges as well. These numbers could take a hit, although both Grinnell Lynchburg have grown. There is to their credit. Let's take a look at, let's take a look at tuition and fee revenue. And again, this is interesting, Matt, because this is the tuition fee revenue collected from those 8 reported years. And look at that, Matt, each of the 3 have grown their tuition and fee revenue. We don't see that not even half the time, I don't think. But yet they're still suffering financial challenges, similar kind of financial challenges, Matt, that we've seen for others. And we've seen this before, 3 colleges that graduate students And they're still struggling. And, and Matt, you and I, and I guess many of our viewers already know that there are many colleges that don't graduate even half their students and have similar financial challenges. To me, Matt, and you may disagree, that's reflective of the market. The market is so competitive that colleges just can't get over the hump. And that will go back to Matt's 4 to 5 years to fix one bad year of enrollment. That's a reflection of the market. That's a reflection of how competitive the market is. Then I'm going to look at something called institutional grants, and, and there's two levels. This is the funded one, and I've teased Matt before, this would be the equivalent of the Matt Hendricks IT scholarship. He donated a million dollars and the earnings from that would subsidize some students' tuition. And really, none of these have any substantive funded scholarships. I don't know why, but those are really small numbers. Not, you know, at Olin, not even a college couch money. And then one I want to focus on is the unfunded. And for those watching the show, you— most of you will know that unfunded tuition, unfunded institutional grants are merit aid, and most but not all scholarships. And we can see for our 3 colleges that really the first 2, Olin and Gwynedd, have inched up, you know, going up maybe $400,000 a year over the last 8 years, uh, only a little bit more than that. And even Lynchburg, kind of on a different track, Matt, probably they realize they have a revenue issue and they've tried to cut back on those unfunded institutional grants, merit aid scholarships. And yet we still saw one of the impacts of that was negative growth in enrollment. The enrollment is down with 300 students, 500 students, something like that. So it's a tough balancing act for these colleges to follow. And then lastly, I want to show— because I thought this was interesting— percent admitted. And there's all sorts of ways to look at this. But look at how selective Olin is. They only want the best and the brightest, and that's reflected in the percent of students who apply that they admit. And Matt, I know you've talked before about if you have revenue issues, just up that admissions rate or percent admitted to grow your enrollment. You know, Olin, to their credit, is staying for the most part true to their mission. They're only taking the best and the brightest, and that's reflected in the numbers. And we look at the other two, they're really all over the place. And Matt, I don't know what your thoughts are on this, but When I see colleges go from 68, uh, going from 68% to 95% in a couple years and then back down to 58%, and a similar kind of pattern, a lot more of a trend upward at University of Lynchburg. It could be just a money grab, and maybe that's what's going on at Lynchburg. But a place like, like Gwynedd Mercy, Matt, how do you read into that? How do you read into that?
Well, it could be as simple as they were incorrectly reporting their applications before that. Yeah, the Department of Ed Obviously got irritated about that, sent out a memo to everybody. So what was happening is people were gaming the, the data, uh, by people that didn't even finish an application, they were calling them an applicant. And the reason they would do that is you'd look a lot more selective, right? Because obviously you can't admit them, so it looks like you rejected them, but you didn't, they didn't even finish the application or they wouldn't even qualify or whatever. So schools were inflating their application numbers to make it look like they were selective when they really weren't. And the Department of Ed sent out a memo that basically threatened these schools and said, you better— you have a statutory responsibility to report correct data, which includes applications need to be only those that would be considered for admission, right? Obviously have to have a completed application, or at least you would consider them for admission. They, they qualify, they meet all the steps. So there's a possibility there that they, uh, got the, the memo from the Department of Ed and changed their application numbers. But it'd be interesting to understand why that happened.
Okay. All right. And then lastly, we, we always end the show with a relatively new app, and this is the 2025 College Majors Completion App. And, and that was put together to give colleges, both public and private, 2- and 4-year, an opportunity to compare their majors and the completed majors to others. And I've got just Lynchburg and Gwynedd from today's show on here. Olin only has the engineering stuff, so it wasn't a good match. And this first one shows the university, and I've got it set up for bachelor's degree, and I've got it set up for all 4 years from 2020 to 2023. And we can look at the mix and match, and we can see, for example, Gwynedd had 51 graduating students in 2020, 50, 32, and 42. So it's gone down a little bit. And you can see some of the other majors that they have strong completions in. One of the things I look at when I look at this college majors completion is how heavy any individual college is on a single major. And when I see numbers this high for a single college, Gwynedd Mercy is betting a big part of their bank mat on their business administration. Now, you and I don't go and look at the quality of these programs. We don't look at their certifications, their accreditations, all that kind of stuff. But that's an awfully heavy reliance. Now, if I'm on the other side and say Lynchburg is competitive with Gwynedd, and they're not, but say that's the case, I'm going to look at those numbers and say, you know what, I want some of that. And I'm going to find those students applying to Gwynedd Mercy who are looking at business topics, and I'm going to find a way to get them to switch from Gwynedd to my university. And this is one of the ways you can use this tool at the university level. Lynchburg, same thing. Not as heavily reliant on business, you know, not a bad mix, a little bit better mix than that. The other end of the spectrum is, let's look at philosophy at Lynchburg. Philosophy and physics and music and drama and theater, that's a really, really, really small number. You got to wonder, Matt, what the revenue, net revenue generation is for individual majors, not just for yourself. We could look at what's physics, physics up here. Physics isn't offered at Gwynedd Mercy, but you can do that to compare back and forth. That's the first use of this. The more important, I think, use externally is to look at different majors. I'm going to do bachelor's degree for 2023. I'm going to do Pennsylvania, and I'm going to look at— let's just start with one on top— accounting. All right, and let's make a little bit more selective. Let's just do privates. We can do publics as well. I'll select privates. So these are all the private colleges in the state of Pennsylvania that offer accounting. Is that what I chose? Bachelor's degree in accounting and accounting-related services. So you can see the market share. We made it a little bit easier for you so we can make it have a bigger version. We can click and see that this is Duquesne University. We can see and click that this one is Seton Hall University. And again, you know, this one is University of Valley Forge. You know, the whole market share in the state of Pennsylvania on accounting and accounting-related services, they had to students graduate in 2023? Is that profitable or not? Or if I'm at Villanova University, do I want to make overtures to these small enrollment, small major completion colleges and say, hey, let's talk revenue share? And if you don't have this kind of data, you're stuck looking at only your own stuff. And I had a case for university today that I shared with somebody that looked at their own majors completion, and it was finally done. It was done in Power BI just like this is. but it was only an isolated prochio look. So that's one of the ways to look at this. And then we also show trends. This little icon here, we can show trends for the top 5. And we have astronomy— I'll find— get back to accounting here. So for accounting, we can see at a quick glance Drexel is for the most part flat over the last 4 years. We can see that, you know, whoever this one is, St. Joseph's is mostly flat. Then we have a little bit of a bump. And we can see ones that aren't competitive. In terms of numbers. So, you can look at this to compare others. And Matt, how many times have you and I talked about it's the comparisons that matter? It's the comparisons that matter. And I don't know what the numbers are, Matt. Maybe you have a better feel for that than I do of how many colleges look at their own stuff and make business decisions based on their own stuff.
You can almost like see it, right? Like a board meeting at Olin College, they've always drawn like 6% out of their endowment forever, right? But they probably never took the time to sit and say, how does this compare to like everybody else, our competitors? And right. And if they'd have done that, they would have seen, wow, we've been way high for a long time. Right. And then if they look at, you know, again, the same thing with the endowment, the endowment's grown by, what do we say, like 20% or so? It turns out that's terrible.
Right.
And they probably had no idea. The only way you would know is comparing it to another school.
Right.
So the comparisons absolutely matter.
Yeah, yeah. So, Matt, that's a nice show. We ran a little bit longer than we like to do, but hey, we're good talkers, so we're okay. So, so for those that watch the show on reruns on, on our YouTube channel, on College Viability's YouTube channel, we'll have this posted a little bit later today. And for those who watched it live, thank you for making time to watch the show. This is the Moneyball era for higher education. Matt and I are just two of a small cadre of higher ed data entrepreneurs that are working hard to increase the financial transparency of colleges. Because Matt, you and I both know colleges for whatever reason aren't very good at being transparent, and for some common logical reasons. But Matt and I are kind of the Blue Book for colleges. We don't kick tires of cars, but we kick the finances for colleges. And we think the value that we provide is significant. And to see what that value might look like for your organization, reach out to me. I'll have my contact information in the show notes and at the end of this podcast, and we'll be happy to reach out to schedule a private demo or even answer your questions of any of the products that we showed today. So for Matt Hendricks, I'm Gary Stocker. Thanks for making time to watch the video, watch the show. We'll be back next week with another episode of the College Financial Health Show with Matt Hendricks and Gary Stocker. So long until then.
More from Gary


What does it look like when a college increases both total revenue and total expenses?



College Financial Crisis? We look at the financial health of Bay Path U. (MA) and Coe College (IA)


Private College Financial Crisis? We look at the financial health of Hobart William Smith College


Financial Compass tutorial (Private college version.) Financial statements compiled 2016-2025.

