The College Financial Health Show with Matt Hendricks & Gary Stocker for November 5, 2024
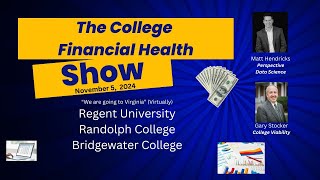
In this episode of the College Financial Health Show, Gary Stocker (College Viability) and Matt Hendricks (Perspective Data Science) analyze the recent audited financial statements, IPEDS data, and endowment information for three private Virginia colleges—Regent University, Bridgewater College, and Randolph College. Using a free benchmarking app and a paid, more detailed app, they walk through net‑income margins, cash‑flow, tuition revenue, operating expenses, capital‑asset trends, debt‑to‑income ratios, endowment draws, enrollment, graduation rates, tuition‑and‑fee changes, institutional grant (merit‑aid) spending, and program‑completion metrics. Regent shows a dramatic turnaround driven by a surge in net tuition revenue and expense reduction, likely tied to online program expansion, while Bridgewater and Randolph exhibit shrinking revenues, rising expenses, heavy reliance on endowment draws, and declining enrollment. The hosts discuss how these data visualizations can be used by college leaders, faculty, board members, reporters, accreditors, and prospective students to ask critical questions about financial sustainability, program viability, and strategic planning. They also highlight the value of the paid app for contract analysis, vendor evaluation, and deeper benchmarking, positioning the conversation as part of a “Moneyball” era for higher‑education finance.
Chapters
It is Election Day 2024, but no doubt the show must go on. So, hey, it's the College Financial Health Show with Matt Hendricks and Gary Stocker. We're back again. Matt and I are going to Virginia this week. We have 3 colleges, 3 private colleges we're going to look at in Virginia. And as I always share, this is data that colleges themselves submit. I'll tell you a secret. It's newer data than almost anybody, if not anybody else uses. We've got some technologies that Matt has developed that gives our data the newest stuff. And so if you're a college leader, if you're a faculty member, if you're a banker, a bondholder, a community leader, a stakeholder of any sort, a student or their families, listen to what we have to say. There are many, many financially strong and healthy colleges out there. We talk about 'em. There are also very, very— there are too many colleges that really we, we question whether they provide the value that you would want in a college education for yourself, your loved ones, your friends, or your family.
Hi, my name is Gary Stocker with College Viability, and I'm Matt Hendricks with Perspective Data Science. Today we're looking at Regent University, Randolph College, and Bridgewater College, all in Virginia, as Gary said. Um, so my key, my takeaway from these three is We have one that's clearly doing well, two others that are currently operating unsustainably but have what I would consider a pretty long runway to, to right the ship. And I'll show you what that runway looks like. But I'm going to start with a good one. I'm going to go straight to my benchmarking app, free benchmarking app, by the way, that has audited financial statement scrape data. We use it every show. I'll start with Regent, the good case. And it was— this may be one, Gary, that we want to look deeper at, uh, because, uh, take a look here. They had some pretty bad years. And so this is net income margin. We start there, right? Difference between revenue and expenses. Really easy. And they had a 30% loss almost in 2016, 15% loss 18% loss. Those are massive, right? Remember, the red line are schools that closed eventually. And so they were in serious trouble, it looks like here, financially. And the same is true for the cash flow. Let me pull up the cash flow. Again, really big net cash deficits from operations. And then they turned it around in dramatic fashion in just one year. All of a sudden we have positive net income. And not only that, in the top 75th percentile, right? So like above 75% of schools in the country there, not necessarily that you want to be up there, but you go from being probably bottom 1% to top 75% in one year is pretty shocking. So we may need to talk to these folks and see what happened here. And so I guess, you know, the thing is you wonder if it was kind of a fluke. If, you know, they're, they're just pulling endowment draw money or something like that is causing this. So I looked at that. So first of all, I'll show you that it doesn't appear to be a fluke just by showing their net tuition revenue and operating revenue. Net tuition. This is net tuition revenue and they did have a surge. I mean, a lot, a serious surge between 2018 and '19, which is when you saw that big spike.
Yeah.
And it still continued to rise all up 51, almost 52% since 2016 on net tuition revenue, which is amazing. I'll show you operating revenue. It kind of follows the same trend, operating revenue and operating expenses. Changes over time.
And Matt, I always like to look at these two together because you can quickly compare the, the revenue and the, and the, and the expense piece. And it really is a dramatic image, especially when it's out of whack.
Yeah. I mean, so, so interesting thing about this school is their revenues are up 35%. And so a lot of schools will track their costs with that, right? And just continue to grow. But this school is actually shrinking their expenses at the same time that their revenues are surging. I, I don't see that very often. So it's really interesting to see this, that their expenses relative to 2016 are down 1.6% and expenses or revenues are up 35%. So a dramatic turn. I mean, that's probably the most dramatic change in net income I've ever seen. So what they did exactly, I'm not sure. Clearly they made some changes and got more net tuition revenue. I suspect it might have something to do with some online programs that came on board. Given the speed of how fast this has happened and the lack of increase in spending. And there's some more that lends to that idea. Let me show you what happens to their capital assets over time.
And that region is heavy on graduate programs as well.
Yeah. So let me show you their property. So remember We can track the value of their property. So the second graph here is the value of their property, plant equipment. These are their buildings, their land, the machines on campus, computers. It is down 22%. So really bizarre to see a campus grow net tuition revenue and then their capital stock is also decreasing substantially. That's a 22% fall. That's, you know, like closed school territory. So I was thinking they must be winding down their in-person instruction model and just going to the online model. That's kind of what I suspect's happening here. But it'd be interesting to talk to them and see, you know, the other explanation is that they're just underinvesting in their physical infrastructure, which would not be good, right? But it seems Like the first story is probably more realistic and likely, but again, I could build the paid app and kind of figure it out. It's pretty— I can see on the paid app how many online students they have and if that's growing a lot and in-person students is kind of flat or decreasing. It's pretty easy to make the conclusion then. But that may be what's going on here. If it is the second issue that they're just not investing in capital stock, I'll show you one more thing. It looks like they have plenty of capacity to do that if they wanted. I mean, they have the big net income. Gains, right? But they also probably have significant buying, borrowing power. And the reason is that their liabilities relative to their expenses or revenue is, it used to be over one, really high. It used to have a really high debt-to-income ratio, basically what is what this is. And now it's quite low, right? So they have that going for them. They paid off a ton of debt. I can show you that other graph up here. You can see the track, the liabilities. So, so really interesting. The school appears to be having financial issues, um, and then maybe what they did is ramped up some online programming and that just sort of took off and sort of carried them, um, forward. But it'd be interesting to talk to this school and see particularly, I mean, I may actually have to build one of the apps, the paid apps and see which programs they added, uh, what vendors they used. Those are really crucial decisions. Uh, some of the online vendors have not worked out for some of the schools that I've worked with and seen. So you have to be very careful on how you're going to, you know, what's your strategy going to be in the online realm. It's really easy to buy massive contracts with vendors and have them not pay off, to be honest. I've seen that happen more.
If you're from Regent University, we offer this to everybody. Reach out to Matt and I. There'll be contact information on the show notes that we have. Reach out. We'll be glad to have you on the show and you can brag about what you've done.
Yeah. Yep. Or warn us or warn everybody, you know, you know, your experience may not, maybe more like the ones I've seen where you incur a bunch of costs to roll out some online programs, even costs that are not in the contract because you have your in-house faculty also working on that. And you don't get a lot of students. I've seen that happen a bunch of times. Moving on to Bridgewater. So the next two schools are not so rosy, as you can see here. And the, but the thing is, I don't think either of these schools are at risk of closing anytime soon. And I mean, not in the next 10 years, even if they continued on this loss trajectory, just because they have a lot of assets. And I'll show you that here with Bridgewater. So yeah, Bridgewater seriously has, definitely has problems with their net income here, especially in 2023. That's an 18% loss. Net income margin. They also have a big negative cash flow, but like other schools, they have a decent size endowment. It's actually pretty big. It's $182 million, which is pretty big for their, their size of school. And that endowment draw, they take out of the net cash from operating activities. So a normal— and so there, I did the math. This is about a $4 million cash deficit with a normal endowment draw. So still negative, but not negative 21.5%. It's probably— I don't— I didn't do the percentage, but it's still a $4 million loss with a normal draw. So what's going on with this school? Let's take a look at revenues on the same plane as expenses. So here's the concerning thing. So top graph is revenue. Revenues are down 3%. Operating revenue since 2016. And as you know, that's— this isn't in real values, this is nominal. So there's a ton of inflation that's happened since then too. So it's really concerning that revenues have fallen even with the inflation going on, but their expenses are up 60%. That's the issue. Expenses are up 17%, revenues are down 3%. And so that's clearly their issue. They have both a revenue issue. Their revenue's not growing. In fact, it's shrinking a little bit, but the expenses are growing as if nothing's wrong. Again, that's a little bit frustrating. I wish schools would be a lot more responsive to changes in revenue than sometimes they are, right? So, um, first question to ask is why haven't we done anything on our expense side when our revenues are decreasing, right? Um, okay, so it's how are they paying the bills? Um, Well, it's pretty, pretty easy to see. Let me show you net tuition revenue before I do that. I think they have an issue there. Tuition.
There it is.
Yeah, net tuition's down 29% since 2016. So that's clearly their problem. They have a pretty big endowment though. So the— remember their operating revenues were only down like 3%, but net tuition revenue is down 29%. That's probably because their endowment's grown a bit. I'll show you that right now. Endowment value. So their endowment has grown by 29.6%. You might say that's amazing. That's actually not good though. Remember, Gary, the median school's endowment has grown by 45% over that same period. So quite a bit lower. And the reason is, what do you suppose the reason is?
They're taking funds out of the endowment to keep the lights on.
Yeah. Yeah. These, the years, the last 2 years where they're really struggling financially, the way that they're paying payroll and making all their bills, you can see right here, massive jump in their endowment draws, uh, 7% draw in 2022, 7.4% draw in 2023. And you can see it actually, we're tracking right with everybody with their endowment here. And then all of a sudden, 2022, '23, they underperformed significantly. That's just because they're pulling a lot of cash out of their endowment to support operations. So that's not ideal. You can't do that forever, but they can do it for a very long time because they have, like I said, $182 million endowment and their endowment draw was $12 million. So, I mean, they can do this for a long time given market returns the way they've been. Um, let's take a look at their CapEx. I can't remember what I saw here, but let's take a look again. Plant property, property and equipment. Yeah, I thought that was the case. So again, their property and equipment value was tracking normally, but then their financial issues hit recently and it's been decreasing. You see that? So again, that's probably because they're strapped for cash as they're pulling cash out of their endowments to pay bills. So the CapEx— yeah, again, the CapEx to depreciation ratio, you want this to be above 1 every year if possible, or right at 1, uh, just to maintain your depreciation and stay ahead of depreciation. But they had— they have these This year is probably really bad because of COVID This year is bad because of finances. They tried to make up for it here in '23, but not quite. So you can see that same pattern here, big drop and then up a little bit, but not enough to get back to sort of where they were back here. So yeah, again, school has a long runway, but right now they're in a situation where they appear— it appears that they're going to be shrinking their endowment because they're taking too much out of it. And at the same time not keeping up with potentially maintenance on their buildings, uh, keeping up with new equipment, new computers, uh, all that stuff. Um, so this is concern, but again, they can probably do this for at least a decade before— I mean, assuming, assuming they can do what all these other schools have done and the, the legal branch of the government doesn't crack down on it. Um, and I'm talking about borrowing from restricted endowment funds and stuff like that that other schools have done. If they're allowed to do that going forward, which is a big the runway is pretty long, right? $182 million. Even if that's all restricted, all these schools have been borrowing that money anyway, and seemingly nobody, nobody says anything. All right, so that was it. Did I look, did I look at Randolph yet?
No, not yet. Sorry.
Okay, let me do Randolph. Randolph is pretty simple, similar. Yeah, Randolph. Although, um, actually I said it backwards. They— Randolph has $182 million endowment, but Bridgewater is similar. They have $108 million endowment. It's really similar kind of situation here. This one's a little bit better though than, than Bridgewater, um, on all the metrics. And I'll show you, I'll just refresh this and go back to Randolph. I'll go quick on this one. So it looks a lot like the last school that we looked at. You can see they were doing fine, and then all of a sudden things went pear-shaped recently in 2023. Same thing on the cash flow. Again, they pull out their cash flow number, you put it back in, um, and it was like a $4 million loss again. Um, so not huge, but still a problem. The way that they were paying the bills, you can see endowment draw. You can see they've been— actually have a really long history of pulling a lot from their endowment. That's, uh, that's concerning. Yeah, it is. That is very concerning. Let's take a look at how their endowment's been performing.
I can tell you how it's going to be performing. Yeah, not going to be in the 75th percentile.
They must have decent— so, so there's a few things that affect your endowment growth. One is how much you're drawing out, your returns, which, you know, you can't really affect that a whole lot. You can try, you can buy a fancy investment firm or something, but they're probably still going to give you the same result. But more fees, right? But then there's contributions. So maybe they're getting a lot of contributions here and they probably are. They have a really big endowment. So despite these massive draws, their endowment's grown significantly, 26.9%.
Oh yeah.
But again, not where it probably— it would've been much, much better had they have like a 4.5%, 4.2% draw, which is normal. Which is unfortunate. This school could, I mean, with that kind of support and size of the endowment, the contributions they're getting, they could be an elite college if they just could manage this better. I mean, imagine if they're in the 70% growth. I mean, you're looking at an endowment that's over $300 million at this point. So it's a missed opportunity, I think, unfortunately. But again, they sold a bunch of assets. They drew down cash reserves in 2023 to cover their loss. Um, and you can see those big endowment draws, and that's how they're making ends meet. But again, they can do this for a long time, probably longer than 10 years. So I'm not worried about them closing, especially if they're allowed to again borrow from restricted funds. I should say Bridgewater only has $4 million in unrestricted endowment funds left in their endowment. So they are really going to be dependent on that court case that's in litigation right now about whether it's legal to even use your endowment funds as collateral, let alone borrow the endowment funds. So it'll be really interesting to see how attorney generals are going to come down on this in different states and if this is going to continue going forward. All right, Gary, that's all I have for these.
So, so, Matt, as, as we look at really Bridgewater, in a slightly lesser extent Randolph, you know, I know have an effort going to reach out to reporters and give them access to really the tool that you just used, plus what I'm going to use here in a minute. This is the kind of tool in my— it's the kind of scenarios in my mind where reporters could use this kind of data to reach out to colleges and say, hey, you're, you're You're living on borrowed time. Do you have plans for cutbacks or layoffs? Our faculty members could look at this kind of data. You went through that at the University of Tulsa many years ago. Do you— I guess the question I have is, is that a reasonable scenario that laypersons, non-financial laypersons, could look at visualizations like this and say, hey, what's going on to leaders in these kinds of colleges? And not just Bridgewater, not just Randolph, but the many, many others that we look at as well.
I mean, I hope that's how I designed the app. And I think you designed your app the same way where even people that have never looked at a financial statement can, it's easy to see, okay, this is how much we're drawing from our endowment on a percentage basis. This is what's normal. Why do we look different? It's really, it just begs questions to be asked. And I remember before I got really long history of my research, I did K through 12 research forever. And those, they don't have endowments, right? I didn't know anything about endowments. And so, yeah, I mean, Republic. Um, so I had to learn. And I mean, one of the first questions I had at the University of Tulsa is like, so what is our endowment draw? What percent? And is it— is that normal? You know, there's lots of questions I had to answer, and, and the, the way I answered them was doing this. I really wish I had this app way back then, but, um, yeah, there was just tons of questions. Um, the only way to really understand what's normal is to compare, right? Compare it to other schools, benchmark these things. And that's when you realize, wow, we don't look like everybody else. And then the question is why, right? We doing something wrong?
And even the same kind— same kind of questions from accreditors. You know, I talk about them regularly. Uh, again, Regent doing well, we'd love to find out what they've done particularly well. Um, and I'll do a quick plug for Matt. Matt has a paid app that colleges like Bridgewater and Randolph could use to see what's going on. And colleges like Regent can look to say, hey, here's what we did right. And so if you're looking for more in-depth analysis, reach out to Matt. I'll have that contact information in the show notes. But back to the accreditations— accrediting agencies— for a second. And really, none of these three, like you said, are even anywhere close to imminent closure. But could accreditors use this as part of their on-site evaluation, say, guys, you've got 3 years to get this spending and revenue, expense and revenue balance under control. Is that reasonable?
Yeah. I mean, I think that's one of the things that accreditors could do is, you know, they have a lot of leverage and one of the, I think every one of the accreditors has some kind of language in their criteria that it has to be sustainable operation. It has to be within their means, that kind of stuff. And, you know, and if you're drawing 7% on your endowment every year, This is not sustainable unless you have massive, massive contributions every year that are unrestricted, basically. Right. And that's really rare. And it certainly wasn't happened with any of these schools. So an accreditor, I think, could do a great service by saying, hey, you guys have a problem here and alert them to that before anything gets, you know, really out of hand.
Because if they don't, higher ed data entrepreneurs like you and me. We are. I mean, that's one of the main reasons we do this show is to create awareness for sure, but to show those colleges that are doing well, Regent and University of Mary and others we've had in recent weeks, and those that are not doing well, which are too numerous to count in the 40+ colleges we reviewed over the first 3 months. Most are dangerously in dangerous areas for financial health.
So just having the context too, like we saw a couple of schools here where their endowments grown by 29%. I mean, if they didn't know any better, they might actually put that on their website and like brag about it. I mean, but it's actually not good. That's a pretty poor result actually. So that's, that's the power of benchmarking. You really need to know and have reliable information. If you live, if you're in a bubble, just looking at your own numbers, you have no idea if those are good or bad.
And speaking of comparisons, nice segue, let me go ahead and share, and share my screen. $5 in that for you, Matt. Yeah. And so I've got up the College Viability App and I've got our 3 colleges up. And I just want to look at a couple of the fields for these. And again, all 3, the College Viability App tracks data for the last 8 reported years to the National Center for Education Statistics. And Matt, almost every week, What I show from the College Viability app mimics what you do, um, in terms of what— whether college is financially healthy or not. And you can see of the 3 colleges here that really only Regent has had any growth at all. Both Bridgewater and Randolph have had decreased enrollment. Of course, that's going to contribute to the cash issues, Matt, that you represented. And we always, after enrollment— because that's what everybody follows, it's not the best way to follow, but most people do— we go to graduation rates. And I'll stay off the soapbox this week, but look at the graduation rates. Now, interestingly, Bridgewater is doing something well. Of the three, they were probably the least financially healthy, Matt. Fair enough?
Yeah.
And yet they're graduating well over— over the last 8 reported years, over 50% of their students. Kudos to them, because most private and public colleges in the country don't graduate even half of their students after 4 years. And you look at Randolph, you look at Regent, and Regent's the one that stands out. They have had some successes. I gotta wonder whether they're counting the data right correctly back here. There's some big, big changes from, from year to year. But even at 45%, not even half the students that go to Regent on the undergrad side— this is the undergrad side, and we'll see here in a second that Regent has a large graduation population. I will continue to harp on this, and Matt teases me on occasion and, and rightfully so, because I just— I'm not a one— not a one-show pony. Is that what it's called?
But this one-trick pony.
One-trick pony. Yeah, this graduation rate is a big, big deal. And when I think about it, I'm going to pull up grad student enrollment. I don't do that. So here's what I saw with Regent. So clearly their focus is not on undergrads. Their focus is clearly on graduate students. So that could be one of the reasons why their undergrad enrollment— their undergrad 4-year graduation rates are lower. They are a graduate-focused student population, and that, Matt, could be one of the reasons why they're doing so well with the financials that you saw as well. Yeah. And before I go to another one, these are just some of the 30+ reports that you can get on the 2024 version of the College Viability App, where the 2025 version is already in early development. And I want to take a look at tuition and fees because, again, I want to mimic the history that Matt shows from the IPEDS data that the colleges themselves submitted Regent is up 71%, $45 million. Randolph is essentially flat, down a couple bucks. And Bridgewater is down not quite $6 million over the last 8 reported years. Matt told you, he showed you the data. This just reinforces from a really kind of a simpler point. Matt's work is much more progressive in terms of where the data sources come from. But this just says, it says history and history repeats itself. And Matt, I've heard you heard me say this before. If you've had tuition and fees down for 8 consecutive years, don't tell me, sir, you can fix it tomorrow. Don't tell me you can fix it next year. Because if you have, as you have shared many times, you get a low enrollment number— I'll go back to that really quickly— if you get a low enrollment number for any of these given years, you're stuck with that number for not 1 year, Matt, but 4 years, right? Those, that low enrollment number And the revenue that comes or does not come with it sticks with you for 4 years. So that's coming out. I talked about that yesterday on the This Week in College Liability podcast, um, the data last week that student— that undergrad enrollment was down. And I made the point, it's not— it's not a single-year thing. And Matt, I stole that from you, so make sure—
I want to make sure.
And then I want to take a look at institutional grants. And this is more an education piece than anything, and I want to look at the unfunded ones. And the unfunded institutional grants is just a fancy way for saying merit aid. It's just a fancy way of saying most scholarships, not all, but most scholarships. And you can look at that to see how much revenue a college has foregone, or I say giveaway, that's not necessarily the best way to put it, how much revenue a college has gone to get students in the door. You can see that Bridgewater has gone up about $4 million over 8 years, not a monster number, up about 13%. Randolph has tried to get that number under control, down a little over $7 million, so not giving away as much, Matt, to get students in the door, but we saw that reflected in what? In the lower enrollment. And Regent, interestingly, because the focus is probably on those graduate students, they're up $7.5 million. I don't know what that means in the overall scheme of things. It doesn't appear to be much more than couch money. For the folks at Bridgewater. I'm sorry, at Regent University. It doesn't appear to be much more than just college couch money, I think, Matt, is what I call that. So again, this just reinforces what Matt's talking about. And then we also add where we have— I'll just go back home here for a second. So we look at program completions. So at the program level, how many students completed a program for some of these colleges? I've got our 3 colleges selected. And let's just look, I've got 16 common programs listed here. Let's look at business and marketing, and we can see that Regent, you know, has a decent number on the undergrad side, but look at the numbers on the grad side. That kind of reinforces what we just talked about. And Bridgewater and Randolph, you know, Bridgewater plays a little bit on the undergrad side, Randolph not so much. Both are pretty weak on, on the graduate side. And you can look at all of these. I'll do one more, I'll do health professions. And again, only 2 of the 3 regions doesn't even play in the health professions, and that's fine. That's, that's a fine business decision. They can do whatever they want. But let's take a look then at each of the college's individual profiles. And this is in large part useful for faculty, for provosts. If you're looking at adding programs or adding majors inside of programs, this is the kind of data you can use from the program completion version of the College Viability App to see where your competitors are strong or not so strong. If you're a student or a parent, you want to look at this. For example, at Regent, they have 5 students who finished any of the programs in math and science. That's a little low. They had across the outside of that, that's not visual arts, visual performing arts, not bad. But if you don't want to, the example I always use is communications and the major is journalism. And if you're looking at a college and they only had 5 or 6 journalism majors graduate, you really want to be careful because those low-enrollment majors, those low-enrollment programs, are the first things to get cut. And then for Regent, we can see where they're strong across many graduate programs. You can pause the video to see which is which. And then the same thing for Bridgewater. I'll give you a brief look at the profile there. You can pause the video to look at that. But again, philosophy and religion, if you need that, if that's your major, if that's the program you want to look at, First of all, send me to spelling school so I can spell religion correctly. And just look at this, look at the profile, look where they're relatively strong compared to other colleges that you're looking at. Faculty, provost, same thing. Where is your organization strong when compared to others you're competing with in your region or in other areas? And then finally, Randolph College, again, same thing. You can pause the video to do your comparisons. Really weak across the board. Maybe biology, maybe parks and rec might be a little bit strong, something like that. So when you look at data, Matt, this is something you and I have talked about since we started the show back in this, this past summer. We're unbiased. We hope every college succeeds. But Matt, you and I both know that that's not the case, and we are the independent resource. We are the resource to say, hey, here's the raw data. And Matt, since we have a couple minutes, talk about the paid app. That you developed and how colleges could use that, and then we'll wrap up the show.
Yeah, I'll just give one that just happened yesterday. I mean, it's happened many times. So one of the things I do in the paid app is go through all the contracts that I can see on the 990s. And we also, for the, for the public schools, we've done a bunch of FOIAs to get, um, a list of their contractors, how much they paid all of them. But sometimes you'll see some really bad contracts in there. And honestly, and it's really important that the board checks it out because Who wants to take ownership of a contract that didn't turn out well for the school and say, hey, you know, it cost the school like $30 million. It didn't work out. I mean, I wanted it to work out, didn't work out, but sometimes these contracts will just continue on just because nobody wants to admit that it was a bad deal. So I think that's the power of data to just to identify those, start asking questions, you know, do we need this contract? Is this contract Worth the expense, right? And that's an easy calculation to make usually if you have the data, and we do. You count the number of students that— how much revenue is this contract generating? How much is it costing? What do other contracts look like at other schools that have similar situation? And that's the kind of thing you can do. So that's a specific case, but you can do that in almost any area that we can measure. We can measure a lot now with the 990 data, the audit data, the iPads data. There's other sources we scrape as well. Um, so yeah, just every day is, is, is fun. Every day is different. Um, every school's different and find some unexpected things all the time, even with schools that on the surface look like, wow, they're just top tier, right? I mean, seen some bizarre things happen at even the best managed schools.
And Matt says it's the best just a minute ago. He says the power of data. And we wrap the show every week with a reminder this is indeed the Moneyball era for higher education. Matt and I are just a small sample set of the many, many other higher ed data entrepreneurs looking at data in lots of ways. And colleges, you can pay attention, you can choose to not pay attention, but the market is adjusting and the data is a big deal. And if you look at the data and say it's not right, well, college leaders or board members or whoever, whoever has that concern, you submitted it. It's your audited financial statement, it's your form, it's your Form 990 submissions, it's your IPEDS data. We're just looking at comparing what you've done to another set of colleges. So we're going to make this a short episode today so that everybody has a chance to get out and vote, because that, Matt, that's my next task once we get this going. So for those who've joined us, we appreciate that. Thank you very much. We're grateful for your time and investment in time. and we look forward to doing this next week. And Matt, we're going to do 3 Jesuit colleges next week. We're going to be doing St. Louis University, we're going to be doing Marquette University, and we're going to be doing Creighton University. So join us next week as we look at those 3 colleges. For Matt Hendricks, I'm Gary Stocker. Thanks for making time. We'll talk again soon.
More from Gary


What does it look like when a college increases both total revenue and total expenses?



College Financial Crisis? We look at the financial health of Bay Path U. (MA) and Coe College (IA)


Private College Financial Crisis? We look at the financial health of Hobart William Smith College


Financial Compass tutorial (Private college version.) Financial statements compiled 2016-2025.

