The State of College Finances: What You Need to Know - College Financial Health Show April 1, 2025.
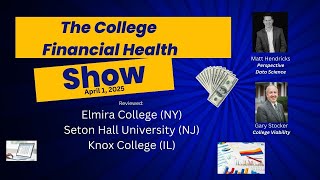
In this episode of the College Financial Health Show, hosts Gary Stocker (College Viability) and Matt Hendricks (Perspective Data Science) walk through a data‑driven financial health assessment of three private colleges—Elmira College (NY), Seton Hall University (NJ), and Knox College (IL). Using their Advanced Financial Compass (paid version) and publicly filed audited statements, IRS Form 990s, and IPEDS data, they benchmark each school against median, 25th/75th percentiles, and a set of nine colleges that have closed. The discussion covers net‑income and cash‑margin trends, endowment draw rates, enrollment and tuition‑price dynamics, capital‑expenditure versus depreciation, staffing ratios, contractor spend (especially high‑priced food‑service contracts), and vendor‑shopping strategies. They highlight Elmira’s chronic deficits, shrinking endowment, and reliance on large vendor contracts, contrast it with Seton Hall’s strong margins, high tuition pricing, and disciplined capital spending, and flag Knox’s recent revenue‑expense surge and unsustainable vendor costs. The hosts also showcase graduation‑rate and major‑market‑share apps, stress the importance of comparative analytics, and promote their paid Strategic Compass product for deeper institutional analysis.
Chapters
Hey, welcome back everybody. It's Tuesday, so it's got to be time for the College Financial Health Show with Matt Hendricks and Gary Stocker. It's the show that we look at college finances, and as far as I know, we're the only show that looks at individual colleges and offers some detailed financial analysis and detailed look at graduation rates and enrollment numbers and all those kinds of things. And here's what we encourage you to do. Watch the show. You can watch it live, and those joining us live, thank you. You can watch the recorded version that will be out later each day that we do this. And you can look at a lot of different things, but take the look. As Matt and I regularly say, it's the comparisons that matter. And we look at comparisons using technology that I think, I believe nobody else has. So join us live, join us on the recorded version, and take a look. If you ever want a demo of a product, I'll leave the contact information in the show notes. Hi everybody, I'm Gary Stocker. I'm founder of College Viability.
And I'm Matt Hendricks, founder of Perspective Data Science. Today we're looking at 3 schools as usual, and as usual, I probably put too much stuff in my notes to try to cover in the time that we have available, but I'll just go with it. Uh, we have Elmira College, New York, uh, Seton Hall University, New Jersey, and Knox College in Illinois. Be sure to stay to the end at Knox college segment, I'm going to show a detailed dive into how you might shop for a food service vendor and lots of other things. So first, how do you identify whether you need to shop for a food service vendor and then how you might go about shopping, what vendors you might target. Turns out some vendors tend to be lower priced than others, and I'll show you those. It's pretty easy to identify in the Advanced Financial Compass. Okay, so let's get into it. I'll show you, I'm going to do some efficiency today with, uh, how to present this. Um, so I'm going to start with Elmira. By the way, you're looking at the Advanced Financial Compass, uh, the paid version. The free version has some of this stuff, but a lot of the capabilities are disabled. Um, so I'm going to do two schools at once to start with. I'm going to do Elmira in New York and Seton Hall. And just pay attention to the differences. Seton Hall will always be in green, and Elmira will be in blue. And I'll I'll just give you a hint as to what to look at here. One of these schools is doing very well, the other one not, is virtually the opposite on every metric. So I'm going to start with net income margin. That's where we always start the analysis. Basically, this is profit. Remember, you don't want a negative profit. Even though these are nonprofits, it's not sustainable to be running negative numbers like Elmira is many, many years in a row here. Uh, 10% loss. '11, '20, '26, and then they had 2 years of positive. That's almost, almost certainly from COVID relief. And, and then right back to negative again. All right, so this school is in, in tough shape financially. They keep losing assets every year, and, and Gary and I say this is unsustainable. Eventually you just run out of assets, right, and the school will close. And you'll see they've been eating up their endowment like crazy. Uh, but just look at the difference here between Seton Hall and Elmira. This is Seton Hall in green, almost always positive, and that's exactly what needs to happen. You can have— they have one year that's negative. It looks like that's the COVID year, the year that actually people got injured by COVID. And then they're right back up to positive gains, actually really close to 75th percentile on net income margin. So the question that you'll see, I'm going to look into how is Seton Hall or Elmira actually paying their bills if they've got this negative net income. And by the way, I'll show you that they also have negative cash, net cash margin from operations. So they've got negative cash from operating activities. And typically what that means, not always, because some, there's some accounting differences across schools. I've gone into many other shows, but generally what this means is that they're not collecting enough revenue to cover their operating costs from their operating revenues. So they have to either borrow or sell assets, or those are the two options, right? Borrow or sell assets. And you'll see on this next visual—
Matt, before you go there, tell the new viewers what the red line is for.
Yeah, that red line is closed schools. So I, it's not all the closed schools. It's a set of 9 schools I have right here that have closed. It's just another benchmark. So I'm benchmarking all the schools. Of course, I'm benchmarking Seton Hall versus Elmira, but also against the median, the 25th percentile, 75th percentile, and then a set of closed schools. So it's just helpful to give context as to like what is bad, what is good, and where you need to be sort of located for these things. Oh, so this is already up. So what I'm switching over to here is the change in endowment value since 2016. And you can see what's happened to Elmira's endowment is pretty catastrophic. It's down 42% almost since 2016. The median school has done the opposite. They're up almost 60%. So we talked about this before. Your endowment really is key to being competitive in the future. Right. The, the, with your endowment shrinking like this, it means that more and more of your revenue is going to have to come from tuition, room and board. Right. And while that's happening to Elmira, their competitors are most likely getting less tuition reliant. Right. Quite a bit less tuition reliant. So this is a pretty sad story. And the reason their endowment is shrinking so much is because they have these big deficits. and I'll just show you what they're doing with their endowments. These are their endowment appropriations. As you know, let me just take Elmira out because they're such an outlier, they really mess up the graph. So even Seton Hall had an issue here earlier in the, uh, 2017, 2016, 2018. It looks like they've fixed it, but basically what, what this is is how much you're drawing off your endowment every year. It's really common. The most common policy for drawing off the endowment is 5%. Of the average value over the previous 3 years, which turns out to be about 4.5% of your beginning-of-year endowment value on average. And you can see Seton Hall's right in that range right now, which is great. But these back here certainly hurt their endowment growth. And I think you can see that back here, their endowment growth is a bit low. The reason is back here, they fell off sort of the median back here, but they've since come back up. So back to Elmira, you can see Elmira is just completely out of nowhere here. These draws are like 8.5%, 10%, 23%, 6%. And if I remember right, when I actually looked at their audit, this is actually low. There was another special draw that my AI didn't, didn't recognize as an endowment draw, but I think it was another endowment draw. This wasn't meant to be so complex. This is supposed to be like out of the box, anybody can use it. Um, and it's still that way, but there's a lot of information in here now. So, um, story is, uh, Elmira's got deficits. They've been covering it with big draws from their endowment. So even with those big draws though, they're— that will go into operating revenue and they're still getting deficit.
Still negative. Yeah.
Um, so they're in tough shape, um, in terms of that. And let's just show you how, how bad of shape they are in terms of revenue. Their unrestricted revenue since 2016 is down 39%, whereas Seton Hall's is up 18%. That's excellent. It's above the median. Net tuition revenue, see, same story, right? Net tuition revenue is down 51% at Elmira. And by contrast, Seton Hall is doing excellent, above the 75th percentile in terms of net tuition revenue. And we can dig into why that's happening here in a second. So your net tuition revenue can go up in 2 ways or down in 2 ways. One is by I give you more students. So I'll show you that. And the other way is just changing the price, right? Same number of students, higher price, your net tuition revenue will go up. So let's take a look at what's happening to both of these, starting with the student part. So we can do FTE students, percent change since 2016. So Seton Hall, so you already know what's happened at Seton Hall, right? Their enrollment's only up by 1.9%. but yet their net tuition revenue was up a ton, right? So how is it possible? What do they do? They increase the price, right? And I'll show you that in a second. The price is way higher. And the story at Elmira appears to be entirely about fewer students. They're down 54% on student enrollment here, FTE enrollments. But let's take a look at the net tuition revenue price. So I'm pretty sure that we're going to see a big increase in tuition revenue per student. So that's just the raw value and then per student. Yeah. Wow, that's amazing. So everybody's— so they— people have been paying a lot to go to Seton Hall for quite some time. Starting about $22,000 just for tuition, not including room and board. Now they're paying almost $30,000 just for tuition and then probably another $10,000 on top of that for room and board. We could check that with the auxiliary revenue. But take a look here at Elmira. Their price is pretty much constant here, which, you know, clearly it's all about losing students. And so, yeah, they, they've got to dig into that. Doesn't appear to be a pricing issue. They're right at the median here, but perhaps a lot of their competitors are dropping price below them. So that would be something to look at. And again, one of their competitors wouldn't be Seton Hall, but you can add in a bunch of other competitors for Elmira, um, and see what they look like on net price— net tuition revenue per student.
So, Matt, looks like Elmira has tried to maintain some tuition pricing integrity, but the cost has been decreased enrollment because competitors are probably underpricing them.
Yeah, yeah. I mean, I would argue they probably should be pushing that price down further. You know, you're There's depending on the elasticity, which is probably pretty big. I know that's kind of jargon, but basically the idea is that if they reduce their net price a little bit, they might get a bigger percentage change in enrollment, which would offset the reduced price and actually increase revenue. But we need to do a lot more digging to figure out exactly what that is. There can be a lot of quirky things. I've got clients where just specific income bands of students, their price looks a bit weird. And, you know, there's lots that we can investigate on this, which would show up in the strategic age compass.
That's also—
yeah, exactly. Um, so there's a lot to dig into there. It could also be, um, marketing issues and stuff like that.
Sure.
Um, so I'm going to show— I'm going to skip ahead. The CapEx on both of these schools, same story. Seton Hall is investing a lot in infrastructure. Um, remember, the school's not really growing, but they're, you know, schools— they're— people are paying a premium to go there. They're investing in their infrastructure, replacing depreciating assets. At a higher rate than they're depreciating. Uh, well, Elmira is not. I'll just— actually, it's pretty important that we see this. So yeah, I always like that one, right? So every year we're looking for a CapEx to depreciation ratio of 1, just to break even, right? To keep your capital stock even over, over a long time range. Um, and you say Seton Hall is always above 1. 1 is right here, except for 1 year they're below 1, but Totally. Everybody was remote here.
Yeah. Yeah.
So that's really common. You can see this dip here actually with the whole nation during COVID But Elmira is just— it looks like there could be a serious deferred revenue or deferred maintenance problem showing up here because we're at 1, 2, 3, 4, 5, 6, 7, 8 years in a row at least where they weren't even replacing the depreciation.
You even have to wonder looking at 20 $3.24 million if they didn't have some serious maintenance issues that they had.
That could have been— actually, we might be able to see that in the contractors here in a minute. All right. So I'm going to give them some things they can do on the cost side now. We already mentioned on the revenue side that they might look at that price, right, and really take a deep dive on that price and marketing strategy, of course, if they aren't already. And I can tell you, it looks like they are doing some of that. But let me show you— let me go down to a different table here and show you there. So a couple of things on staffing. Let me do staffing first. Let's go employees. I still want to run out of time. So let's just look at employees per FTE. You can see that they've started to address a serious problem, but it's been way, way too long to let this go, in my opinion. This— what you're looking at here is Elmira's number of staff per FTE, per 100.
100.
And they're almost 1 to 1 until just recently, and then they brought it back down to, um, even below the median. So there's a massive layoff here, it appears.
Um, and I'm guessing there's news stories that show that sometimes.
Yeah, I think there were. I saw there was a lot of cuts happening. Uh, but this is a very serious cut, right? We can just go to the raw values and see. Went from 600 staff to 335. So they basically cut half of their staff in one fiscal year. It looks like that's a significant drop. So they're obviously in serious distress if that data is correct, right? Cutting half of your staff, that's of course a headline. Um, and it's not clear that that's even enough to get out of, you know, losing half of your students, but maybe that's what you can get sustainable from there.
You know what, I'm going to jump in, Matt, on this because I don't remember the Elmira story specifically other than they were there. And I, I would worry that we would go back and see the news stories. Elmira's response would be Well, we fix things now because we've laid off all these people. But Matt, the finances, the financial story you're showing here suggests that's not the case at all.
Yeah. So in order for it to be fixed, we need this to be positive. Right. And it's still quite negative. In fact, worse. So, yeah, there's more work to be done for sure. Yeah. But at least they're doing stuff on the expense side. So, and you saw the employees per FTE Employees. Okay. It's interesting to look at Seton Hall here too, because remember there's this, their employees per FTE is low, very low. And these students pay a premium almost double to go to this school compared to a normal school. So you can see why their finances are so well in check. They have like a massive surplus and it appears their payroll is very inexpensive.
So the 100,000 number on that, Matt.
Yeah. Employees over 100K. Yeah, they, so they're in New Jersey, correct?
Right.
But Elmira's in New York. But yeah, they pay a lot too. They pay their staff well. This is actually the ideal. I mean, if I were to design an HR system for my school, this is where I'd want it to be. I want everybody to get paid a lot compared to even market rates and then just have a low number of staff. Right. And there's a lot of reasons to like that kind of combination.
And what's the raw value on that one? Raw value, $100,000. 390, almost 400 students. Yeah.
And Almira, this is 390 staff over $100K, right? Yeah.
And Almira is, looks like a dozen or something, 10.
Yeah, yeah, it's just a different ball game there, but that's about right for the median. Um, all right, so let me look at— so definitely Almira is doing something on the expense side with staffing, which is good. I would recommend that, you know, several years ago, just looking at that data. Um, but let's take a look at contractor side as well. Contractors paid over $100K. And here's something that's a bit concerning, which could be one of the problems at Elmira. Although they cut all that half their staff, right, it looks like they replaced— they added a bunch of contracts over $100K. Again, if assuming this data is correct, They got rid of 300 staff, but then they added not at least $900,000 in vendor contracts. So if that's not coming with revenue, that's a big problem, right? Didn't really fix the cost side, did they?
Right. They moved it around. Yeah.
Just moved the money around. And then you can see Seton Hall is a bit higher in vendor contracts. That's totally reasonable and maybe actually expected given that they have a low staff, right? They have a high number of vendors. They're in a very flexible situation, right? It's nice to have vendors you can just fire whenever you feel like it, right? Assuming the contracts don't go on for like 10 years. Don't sign 10-year contracts. All right. So yeah, there, there you go. Let's take a look at specific contracts for, for both of these. So Elmira, and so they went from, let me see these. So Right. Let me just look at their most recent contracts and just give them a hint on what to look at here. So they went from zero contracts to all of a sudden having a bunch of contracts, and that could be a data error. It's hard to believe it went from zero to nine, but maybe they did. I don't know. But one thing to look at is this dining contract is really high. All right. I'm going to show you another example. And the reason I know it's high is that's almost $5,000 per FTE. That's, that's very high. A normal is like $1,300. So it's highly likely they could cut this dining contract in half if they shopped around a bit. By the way, Parkhurst is a very expensive dining service provider, same as Bon Appétit, and I'll show you that example with Knox College in a bit. But here's another one, transportation, $300K. It's not a huge contract, but I mean, everything's going to add up for this, this school. And again, EAB, $610,000 that you saw, their enrollments is cratering, right? Maybe they just brought on EAB, but let's just double check that. I don't want to be picking on a certain vendor all the time, but they may have just brought them on, which could be a good move. Yeah, it looks like, yeah, they just brought them on, it appears. So clearly trying to do something on that revenue side, but you know, this is pretty late in the game now. Lost half of your students already at this point. And still no balanced budget after cutting half of your staff. So it's pretty tough. Okay, so long, long story short, lots of stuff going on here. Elmira is in trouble in lots of different ways as I just showed. Seton Hall is doing excellent. Keep doing what they're doing. Although there's ways to optimize even Seton Hall. Let me show the vendors here. I think there was some optimization they could have done. I just, I mean, I just want to, even when a school is doing well, in almost all the schools I work with are doing well, but Seton Hill, Seton Hall. Uh, let's do FY 2023. Yeah. Oh, they look great. I mean, these contracts are all— see, there's no color here, uh, except for this one.
The janitorial contract appears a bit high, but they're in New Jersey, so it's probably expensive. Yeah.
I mean, and it's not like— so that's just a quarter of a standard deviation high. That seems excellent. So keep doing what you're doing at Seton Hall. Excellent work. All right, let's go back now to Knox College. Knox College in Illinois. And oh, there you are. They already fast forward ahead to one of the things I'm going to say. They got a lot of contractors again, and I'll show you in detail some of these contracts that don't look right. But let's back up to net income and income margin. And you can see here, Gary, they were doing fine for a number of years here. And then bam, 40% loss, 14% loss. It's a pretty big drop-off. And let's see what's happening to the revenue side.
You got to wonder if in this case and some others we've seen that they did not manage the COVID experience as well as others might have done.
Yeah, it's possible. You can kind of see that, like last week, remember we had that school that had really volatile operating revenue. This is a similar school, but you can see the trend here. If you just draw like a regression line through here, they're heading in the wrong direction on the revenue side. And, you know, they're really kind of hanging out in this range of like 10% loss. It looks like on average, that's not good. And see the expense side, percent change since 2016. Yeah. And you can see why they have this big deficit now. Right. They just have a massive surge in expenses happening since 2021. Yeah, that, I mean, probably not fair to start at 2021 because, you know, remote, but if you go back to 2020, that's a huge surge just in a few years. So they probably have some expense side issues that they may not be aware of. Let's take a look at some of those. So employees first. Per FTE employees. Yeah, this has been an issue for a while. It appears a lot of staff per student. And I can also look at staff per revenue. Very high on both, right? And it's not resolved, right? Unlike Elmira, it doesn't appear that they've really addressed this quite yet, at least not at the magnitude it needs to be addressed. I mean, so just to put this in context, for every 100 students, they have 130 staff. Again, that's— those numbers generally won't work out. You know, you're asking a student to pay for an employee, right, in addition to their service, right, that they're getting from the school. So that's pretty tough.
And those that are, that are new to the show, the data sources are the, are the audited financial statements. They are the IRS Form 990s and the IPEDS data, each of which colleges themselves prepare. And I understand on occasion there may be some mistakes in the entry, but for the most part, we're just making comparisons from the data that the colleges themselves have submitted to various sources. Yep.
All right, I'll wrap this up a little bit with some very interesting stuff I'll show you, but here's the contractor side. They have 24 contracts and a per FTE, that's very high. That's 2.5 contracts per student. You can even do it relative to revenue again, contracts paid over $100 per million in operating revenue, very high. Again, so question is, what contracts need to be cut? I can't see them all. If I work with the school, we can go in deep in all these contracts and really put all of them on the table and get a good sense of what's going on. But I'll, I'll show you some that I can see, which are in the 990s. So let's do Knox College in Illinois, 2023. And you can see one contract here that's high, Kari. Yeah. This is the food service contract and that's Bon Appétit. Again, this is a, this usually contracts for Bon Appétit tend to be on the high end. Again, I know there is potential here that it would make sense if they're bringing in extra revenue to the school, but I want to— I would want to see that if I were a board member, right, or president or whatever. If you're going to pay a premium for your food service, you better expect to get a higher revenue from room and board, right? And if that's not happening, then it doesn't really make sense. This is not part of— it's not like mission critical to have the best food around, right? Unless it's going to bring in more students and bring in more auxiliary revenue, then it would make sense. But you got to double-check that. You can't just say, oh, we're going to have great food and then go broke, right? So here's what I was going to say. So they, I think they should spend some time shopping around. And the reason is, let me just show you what other schools in Illinois pay that are nearly the same size as Knox. In 2023. See these filters I'm adding here? I'm just checking Knox's size. They're 1,031 students. So let's find a bunch of schools that are between like 800 and 1,200 students. So you can do between, and let's do 800 to 1,200 students. Okay, and let's get rid of Knox. And then sort it by amount per FTE. Hope you're staying with me. All right, and then the last thing here, I wanted to see just food service vendors. All right, so here are the ones in Illinois, and you can see Knox is the second highest out of this group of schools with this, uh, enrollment between 800 and 1,200. And you know, there's a school here that's bigger than they are, Greenville University. They have a different vendor and their contract is quite a bit less, right? On an absolute basis, it's about $900,000, $800,000 less, right?
Yeah. And then we understand that context is important and that some of these food service companies may be offering more than others, but the comparisons are what matters. And look at the, look at the color schemes. You know, look at Princeton University. We look at them before, they're way out of whack at Princeton University. You want to ask why? Are we way out of whack?
Yeah, I'm not saying that you're like crazy or you're doing something bad or something like that. I just want to see that this has been checked, right? If I'm a board member, I would just ask simply that this is checked, right? I want to see that if we're going to pay $800K more for Bon Appétit over Fresh Ideas, for example, I want to see that our auxiliary revenue is at least $800K higher than the alternative. Which would be going with fresh ideas, right? Really reasonable stuff. And this needs to be checked. That's a lot of money. $800K is a significant part of the budget of this particular school. So here's what it looks like nationwide. You can see there's, you know, some schools paying as much as $600K, $6,000 per student. It's probably including the facilities here. So there's some context to worry about. And then, you know, Knox is here. They're, you know, in this one standard deviation above the median group. We just talked about Simpson, right, last week. I want them to check this. This looks high. Where they should be is in this white range here, about $1,500 a student or so. And there are lots of good examples. We talked about Hastings, one of the schools that's doing very, very well, right? They have a contract that's right on the money. And why can't everybody do that? Greenville, I just talked about them. Fresh Ideas, right on the money. So what might you do here? Let me just show you the difference in some of the vendors in this student body range. So you've got your Bon Appetit, and you can see a lot of these contracts are quite high, right, Gary?
Yeah.
And I don't think they're offering facilities. I may be wrong on that, but I don't believe Bon Appetit does facilities, but could be wrong. Another one that tends to be quite high is Parkhurst. See these all colored Parkhurst. All right, if you want to get a vendor contract, a food service contract that's more reasonable, you might check Pioneer. All of these are pretty reasonable, right? You see that, Gary? None of them are colored except for one. Yeah, um, that, that's promising. So you're probably going to find a contract in the $1,500 range there. Pioneer, and then Fresh Ideas was another Again, it's not just price. Of course, you want to check quality, make sure you're getting decent quality, but this is significant savings. So even if they are lower quality and you don't lose as much, you mean you can lose some auxiliary revenue, just not, you still want to lose a million, right? Or over a million. And I think it's highly likely that you could switch to a different vendor and not lose revenue and slash this cost. But again, it would be worth a further deeper dive to check these things. All right. That's all that, all that I was going to show Gary, how this table has a lot of power. And the way I just added to this table, like, has like 50,000 contracts in here. So if you want to get a good sense of like who the operators are in different fields, we've got them all in here. Marketing, advertising, enrollment management, janitorial, all of that. I think it goes all the way back to 2016. And these colors, by the way, are looking at differences within specific year range, right? So within 2021. All right, I'll leave it at that. I'll pass it back to you, Gary.
So Matt, you don't know this, but 2 weeks from today, we will be reviewing our 100th college.
Oh, no kidding.
We, we started this back in August of 2024, and just watching the, the, your part of the show today, boy, we're starting to see trends. Yeah, we're starting to see patterns, both of colleges that are doing well and for colleges that are not doing well. And again, we'll share, you know, if you're— we tag all of these on our social media, and regularly the folks that we do the show on, we find them following our shows. So if you're from Elmira, if you're from Knox College, I'll give you some contact information on the recorded version of the show, or reach out to me through LinkedIn, and we'll do, we'll do a one-on-one demo. Um, yes, we sell these products. Yes, we sell the Strategic Compass that Matt just referenced. And yet, Matt— yes, Matt has a dog who sometimes visits him on the show.
He's not supposed to be in here, but it's, it's the comparisons.
It's the comparisons, Matt. I've said it time and time again that matter. If you're not doing that, certainly it's your choice, but there are risks associated with not comparing yourself to others. And very briefly, let's take a look at the college viability apps. I've got the 3 colleges. I don't just show all the stuff that Matt shows, but I pull up some different things in graduation rates. And before Matt and I started recording the show today, we talked— I said, Matt, I'm doing a heck of a job picking colleges because look at the graduation rates. These 3 colleges, despite 2 of them having substantial financial issues, are at least, Matt, graduating students. And too many times over the almost 100 colleges that we have done We have seen colleges whose 4-year graduation rates are below 50%, too many times below 40%, and on too often an occasion, 4-year graduation rates below 30%. Dr. Hendricks, if you can't graduate students in 4 years, what are you even doing as a college? And I know that's my soapbox, you can tease me if you want, but that's the perspective. Retention rates, again, look how solid they are even in the financial challenges. And we have to— we're going to do our sustainable, unsustainable here in a minute. They're still keeping students there. That's intriguing because you have to wonder if some of the last dollars are circling the financial drain, what are these colleges like Elmira and Knox doing to keep students there? And yet they're doing that. Um, all-time undergrad, Matt Hazel had his own version of that. You know, 2 of the 3, the ones in trouble, are down a few hundred students. Um, it's almost half, almost 50% of Elmira, and about 25%, give or take, at Knox College over the last 8 reported years. Matt showed you a similar kind of number. Let's take a look at how much of the store these colleges are giving away. Now, you don't call it that technically, it's called the unfunded institutional grants. You and I know that, Matt, as merit aid and most scholarships, it's discounts. And interestingly, all 3 excuse me, 2 of the 3 have significantly increased their unfunded discounts, just, you know, their unfunded scholarships discounts. Knox is up almost $2 million. Seton Hall, because they can afford it, is up almost $60 million. And on occasion— not even true, regularly— we see colleges trying to fight that tuition and those tuition discounts. And what happens, Matt, on the other end? Students go somewhere else. And we saw that exactly during your presentation today with Almira. It is indeed a classic catch-22. And then I don't think Matt brought up the endowments. Take a quick look at the endowments. And again, you know, my bare minimum is $50 million. Elmira clearly has been using theirs up. It's down a little bit, um, in my data. Matt showed more. It's down over the last, over the last 4 reported years. But both, and so is Knox College, college is in trouble. And we can see that Seton Hall has grown a little bit. Let's take a look at college majors. And this is a new app in 2025. And we look at— this is a market share app, a market share based on majors. It's for about 2,700+ public 2- and 4-year and private 4-year nonprofit colleges. And you just get a chance to use the IPEDS data to compare your market share. Now, Matt, the screen I have up now is for our 3 colleges. And when we look at this, Almira at the bachelor's degree level for 2023, we can see from 2020 through 2023, the 4 years available in IPEDS data, This is internal market share. I'll show you external here in a second. This is internal market share for our 3 colleges. And what we look at this for is to see where colleges are weak with really low numbers, really low market share across the board, and to look to make sure a college is not over-reliant on a given major. Now, my soft number is anything above 30%, and you can see that Elmira is kind of touching on that on Business Administration. It's just, it's risky to have, you know, all of your eggs in one proverbial academic basket. I just made that up, Matt. But you can see, you can see the risks associated with that. And we can see for Knox College, less so, a nice even spread. But even at Knox, they have issues, you know, some majors. What are they doing in the math business? What are they doing in the philosophy business? What are they doing in the public policy business? They have essentially no graduates completing majors in those disciplines. And Seton Hall, same thing, but they're a much bigger college. Just go down to the bottom here. And even as large as they are, look at the balance. Look at how nicely balanced Seton Hall is on the top 10 or so programs that they graduate. Now that's internal market share, right? That's internal market share. By major, we can do the same thing as external market share. There's our 3 colleges. Let me pick a, uh, let me pick a major here. Let's just look at accounting because that's what we always start with. And again, Seton Hall is going to be dominant here. Let's just pick one other one. Biology is pretty common. Turn off accounting, look at biology. And again, Seton Hall is going to be dominant. But what I did today, man, I haven't done this before on the show, is this is another view of the 2025 college majors completion Education app. Again, I'll have links for that in the show notes. Is for— I've got accounting. There are 989 public and private 2- and 4-year colleges that offer— that had 37,000, 38,000 completions in the bachelor's degree in accounting. Let's look at chemistry. There were 50,000. Oops, got turned one off. In chemistry, there were 12,000. Let's turn off chemistry. And what, what this gives us— a few more formats. What this does is it lets us compare where students are majoring. Now, you and I both know that depending on the major students choose, their, their income is variable based on those majors. This gives you a feel, and you can filter this by all sorts of ways— by year, we can even look at master's level and see the same kind of thing for each of those majors. It gives you kind of a quick research tool, if nothing else, to see where colleges are offering majors and where students are actually taking those and completing those majors as well. So Matt, this is the point in the show where we look at sustainability. And for our 3 colleges today, go ahead and step us through where you see each of the 3.
Yeah, well, Seton Hall's doing great, as you saw. Um, and I did— I don't know if I showed you enough on Knox, but, uh, both Elmira and Knox, you know, they had those negative net income. Like I said, that just can't go on forever. So clearly it's unsustainable. Uh, both of them— I didn't show you on Knox, but they're making massive draws on their endowments. Their endowments are shrinking. I think you filled in the gap there showing the endowment endowments are shrinking. You know, that's the unsustainability part, right? Eventually the endowment goes to zero and then they can't do that anymore, right? Then what do you do? You start selling buildings and so on, right? Eventually you run out of stuff to sell. Nobody gives you a loan and you have to close, right? So unsustainable on Elmira and Knox. Seton Hall is doing great. Again, I think Knox and Elmira might have longer runways though. Longer than 5 years. They can sell assets for quite a long time before they run out. But again, they lose. It just makes things harder and harder the longer that goes on, right? Because your competitors are less reliant on that tuition revenue, less reliant on any kind of student revenue, right? They're getting more and more just from the stock market, right? From their endowments.
So, but it's kind of a compounding complication if you're using that endowment. And I teasingly call it, you know, you're raiding the piggy bank to keep the lights on. And while that's crude and not completely accurate, that's essentially what's going on. And you posted, I think, something last week, Matt, about when that endowment draw is too large, it's a competitive disadvantage. You talk about that all the time. So, it's data. It's data that colleges submit. Matt and I do it in our own ways. We do the comparisons. It's the comparisons that matter. If you want a private demo, and I've done quite a few over the last few weeks, Drop me a note, I'll give you that contact information. I'll do a private demo, not only for the, the Private College Advanced Financial Compass, but for the Strategic Compass that we talked about today. And if you're at Elmira, if you're at Knox, you need the Strategic Compass, and I'll show you what it can do for you. And Matt referenced it a couple of times. You don't need to pay expensive consultants. We'll give you the data, we'll do the work for you, we'll show you what's in there. You can make the business and policy decisions based on your own And Matt, what era are we in?
Moneyball era.
We're in the moneyball era. And as I talk to media outlets throughout the country about the moneyball era for higher education, they're fascinated to make that connection. If you're not using data, more than just internal data, if you're not doing comparisons that Dr. Matt Hendricks provides and Dr. Gary Stocker provides, you're probably making a strategic and even tactical mistake. So reach out, we'll show you what it looks like. But if you think it's for you, great, we'll put it in your hands. If not, go ahead and keep doing what you're doing. We know what definition that means. So for Matt Hendricks, I'm Gary Stocker. Thanks for those watching the show live. Thanks for those who will watch the recorded version. We'll be back next week, getting close to 100 colleges reviewed, with another episode of the College Financial Health Show. Until then, thanks everybody.
More from Gary


What does it look like when a college increases both total revenue and total expenses?



College Financial Crisis? We look at the financial health of Bay Path U. (MA) and Coe College (IA)


Private College Financial Crisis? We look at the financial health of Hobart William Smith College


Financial Compass tutorial (Private college version.) Financial statements compiled 2016-2025.

