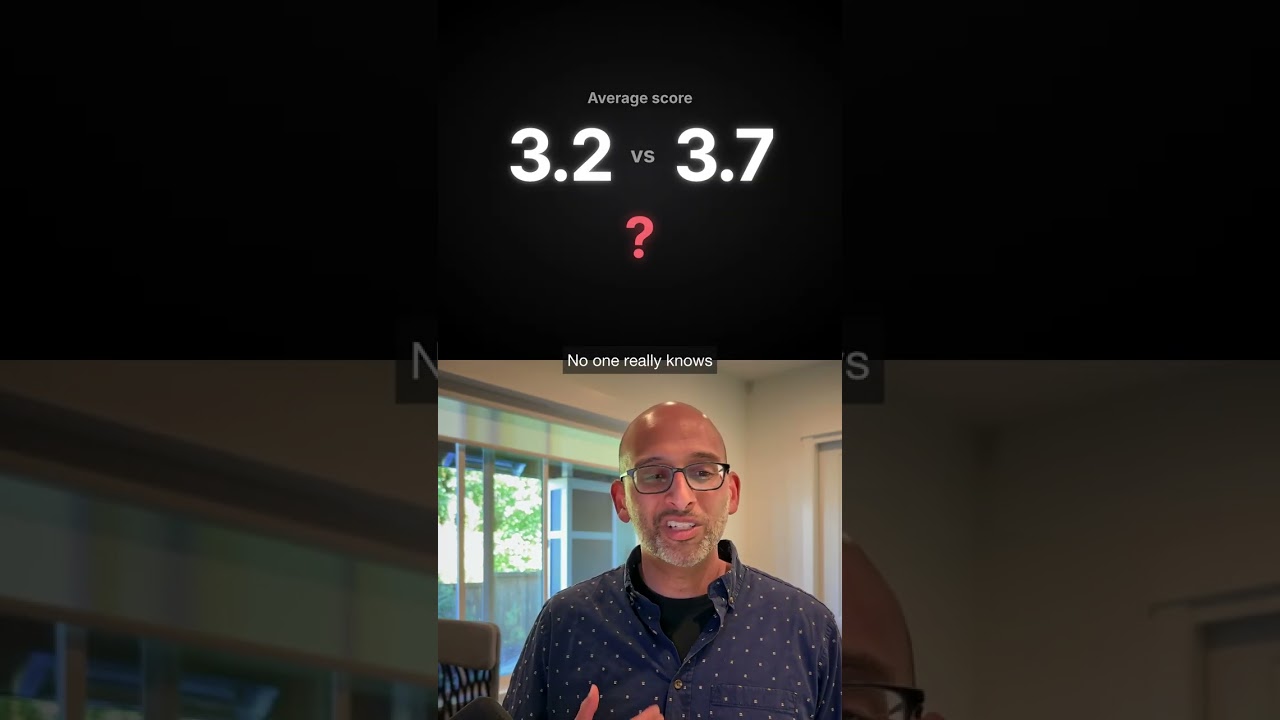
Single metrics like average token count hide what's actually happening in your AI product. Show histograms of per-prompt latency, cost, and token usage instead. You'll spot outliers, cost spikes, and bimodal patterns that averages bury.
Chapters
I want to see the distribution of those numbers at the top as little like numbers or distributions. Like just show me little histograms of like what was the time of each of these? What was the cost of each of these? How many tokens? Because if there's one that's way out of distribution, that's interesting. If there's like a bimodal thing, that's interesting. If I care about these numbers, I only care about them in context and I, I don't know what to do with 1000 tokens as just a point statistic for this one particular prompt response. I don't know if I care or ever will care, but I do care if you tell me that some subset are really long and some subset are really short. Now I start being able to do things with it.