YouTube tutorial by Brittany Long (CEO/founder of Impact Driven AI) demonstrating how to create business infographics with AI. Brittany explains why infographics help (clarity for prospects/clients, faster action, better learning across modalities), where to use them across four business areas (traffic, sales, systems, fulfillment), and walks through a low-cost demo using Nano Banana via gemini.google.com (select Image, enter prompt/transcript, review/refine). She shows examples, advises simplifying jargon for broad audiences (6th–7th grade reading level), customizing aspect ratios and branding, and closes with a CTA for her AI course.
Questions this video answers
Brittany Long
Impact Driven AI
To help over a million women make money and save time with AI by 2030.
Ideogram and Nano Banana (via gemini.google.com)
gemini.google.com (select Image/banana icon)
Chapters
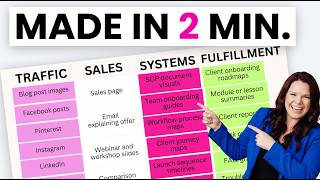
If you're paying a graphic designer and it takes two weeks to get back any kind of graphic that you want, you're going to want to watch this video. In this video, I'll show you how to create infographics with AI. I'm Brittany Long. I'm the CEO and founder of Impact Driven AI which is a global AI education company. We teach practical AI education built on best practices from myself, a former award winning educator serving women all over the world. We're on a mission to help over a million women make money and save time with AI by 2030. So. So first things first. Why would you want to create an infographic? You might want to help your potential clients have more clarity on whether or not your offers for them. You might want your potential clients and current clients or students to understand your offer or your framework better. You want to help your clients or your students or your members take action faster. And then finally it enhances what your clients or customers are already learning from you. People learn in different ways and so this helps everybody across the board better understand the concepts and be able to take action on them. As another question I get asked a lot is where can you use the infographics? Now? Every business needs four main things in order to thrive and use traffic, sales systems and fulfillment. A lot of times business owners don't do all of these things or don't do them all consistently, or don't do them all well because there's just so much to do. But with AI and with these infographics that AI can create for you, you can get out blog post images, Facebook posts, Pinterest, Instagram images, LinkedIn images, images for Reddit to explain something, pitching affiliates and summits much faster because of what I'm about to show you. So just a BR rundown Traffic sales systems and fulfillment Traffic is getting more eyes on your offer. Sales is when people see your offer actually buying IT systems. This is so that you don't burn your business to the ground. This is having things written down and documented so that you're not the only one with everything in your head. And then fulfillment that is delivering on what you said you deliver on. So you can also use infographics on your sales pages to explain your framework. You can use it to explain your offer. You can use it for webinar workshop slides, comparison graphics. That would be like here's why you'd go with us versus someone else. You can even use it on discovery calls. So let's say you're on the discovery call and you are Writing down notes about what they've tried before, why they're interested, all of that towards the end of the conversation, if you haven't closed it yet, you can put all that information into what I'm about to show you and ask it to come up with an infographic that shows them very clearly. Here's what you've tried, here's why you're interested, here's why. This is the right time for you to give them that visual, not just the auditory. Next is system. So that could be sop, document visuals, team onboarding guides, workflow process maps, client journey maps, launch sequence timelines, responsibility and role charts, and project milestone trackers. Those are all great ways to use infographics for systems. And then finally, fulfillment. We have client onboarding, roadmaps, modular lesson summaries, client reports. One of my colleagues and friends does ad management and so she told me that it's really frustrating to submit client reports for the ads because the clients don't really want to look at it. They don't want to just look at, you know, a 6, 10, 15, 20 page report. Same thing with launches too. A lot of times people don't want to look at the launch data because it's overwhelming, especially coming out of something like a launch, where it's a lot of times very high effort. Putting that information in and asking the tool I'm about to show you to create an infographic can help your clients kind of break past that barrier and be able to actually look at the data, actually look at the information and understand it more quickly. You can also use it for quick reference, cheat sheets, FAQ graphics, troubleshooting guides, and milestone celebrations or progress trackers. Just to give you a few ideas of how you can use the infographics I'm about to show you how to make in your business. Now here's an example of the infographic I made. So after I create this, upload it to YouTube, I'm also going to share it on Facebook, I'm also going to share it on Instagram, and I wanted it to create a quick infographic. I want to point out that at least at first glance, I'm not really seeing any misspellings. If there is, I'm pretty sure it's because I misspelled it. This has not always been the case. In fact, a year ago, if you tried to create something like this, it would not have created this for you with everything spelled correctly or even most things spelled correctly.
So let's talk about the tools. What are the best tools to Create infographics. So the first one we have is a tool called Ideogram. You can see it here. The other one is a tool called Nano Banana. Today I'm going to be showing you how to create an infographic using nanobanana because it's the easiest one, lowest cost and lowest barrier to entry. And by the way, of course these are both AI. Brittany, I have not actually been to the jungle with all the giant banana. So here are the steps to take. First you're going to open gemini.google.com next you're going to select image and they'll have a little banana next to it. Third, you're going to input your ideas and I'll show you how to do that and I'll give you a few examples in a second. And then finally you're going to review it for accuracy. Now by the way, this of course is an infographic that I also made in nanobanana using gemini.google.com okay, so here is the first one I made. I said review the transcript. So the other day I made a video on how to create mockups using AI. And so I asked it to review the transcript and then create an infographic that explains the exact steps to create a mockup. I also asked it to explain it like it's a professional educator whose strength is taking complex information and breaking it down into easy to understand actionable blocks. So here you can see I pasted in the transcript. Then here's what it created for me. And honestly, this did a really great job. I love how it looks. I'd like it to be a little bit more on brand for me. And I did notice that there's some things that I thought might be a little bit too jargony. I for example, the words configure, deploy iterate. Now while most of my peers are using that kind of language, it does make the buried entry a little bit higher. In other words, most people are reading at around a sixth to seventh grade reading level. And so if it's not at a sixth to seventh grade reading level, even though all this information is great and accurate, it might not be as easy to understand. So I asked it to do this. I said great start, but it sounds a little jargony. Deploy iterate, configure. Let's make it at a sixth grade reading level. Also I want it to look a bit futuristic with neon pink and neon green and neon purple because we're talking about an AI source. Then I asked it to turn it into a 9 by 16 size and put my Instagram handle at the bottom. So here's what it created from there. You can see it took out words like deploy and it made it a little bit more just easier to understand for everyone. Then I scrolled down and I said, here's just another example. So this is something that I'd share on Instagram. Here's another example. So this was one of the slides that I shared today. I said, turn this into a futuristic looking graphic, make it 9 by 16. Same color scheme, but more visually appealing and graphically appealing. So here you see it did that. And I want to point out that it also has the logos for these two, which is pretty wild. So this is again something that I can share on Instagram based on just a slide that I already had. Okay. Then I asked it to make it 16 by 9. Here's another example. Create an infographic that talks about the steps to create an infographic. Very meta, I know. Then here are the steps. So I put it in here and it created this infographic. I said, okay, this is a little bit unclear. When I open it up, I went 1, 2, 3, 4. But it's actually 1, 2, 3, 4. So I wanted it to make it a little bit more clear. So we went back and forth for a few until it did. Okay, so here's how I did that. The first thing I did is I went to gemini.google.com and then I clicked Create Image and then I said what I wanted. Create an infographic of. And then you saw the prompts that I shared earlier. So create an infographic of X, Y and Z, whether that's a transcript, a concept, and then you press Enter and that is it. It's very simple to do, to get started. And there's a lot of different ways that you can do this. I recommend that you add creating infographics to your daily workflow or at least weekly workflow, either for you or va. Not only because it's going to help your customers and potential customers understand your framework and your offers better. It's also going to be good for Google and for AEO to recommend you as well. All right, now, if you'd like this, we have a lot of other great information like this in the program AI to 100. Head to that link today to see everything that's included. We're going to and use code YouTube for a special deal.