AI Changed How I'm Investing In the Next Market Crash
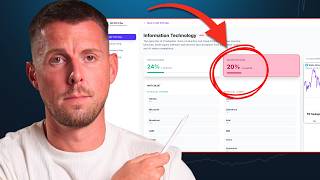
James Helliwell argues holding cash during inflation erodes purchasing power by 9-25% over 3-5 years. He shows high-quality equities with strong pricing power outperformed in 6 of 8 high-inflation periods, and highlights AI winners like Nvidia and ASML that delivered 10-14x returns over a decade.
Chapters
If you've got cash in the bank, this next chart should worry you. Crude oil has almost doubled in the space of 3 months, and if you know your market history, you'll know that 8 of the last 9 recessions were preceded by a spike in oil prices. But a cost of living crisis was well underway before the US and Israel struck Iran, and the oil shock, if you pardon the pun, just put fuel on a fire that was already burning. And if you need one chart to show you how bad it had actually got, the number of people searching Google for help with their mortgage just hit its highest point since the 2008 financial crisis. So what do we do with our money? Because sitting in cash comes at a cost, and the idea of buying anything going into a recession is about as appealing as eating glass on a hangover. I'm James Helliwell. I'm a former professional trader turned financial educator, and in this video I'll be showing you what this means for your money, how to invest amidst the dual threat of inflation and recession, and why buying gold or your favorite ETF could be just as risky as remaining in cash. Now, the idea of staying in cash and doing nothing definitely feels safe, and it might even feel like the smart thing to do. But let me just open up with a quote here from Peter Lynch, and he says that far more money has been lost preparing for corrections than has been lost in corrections themselves. So here you can see a matrix going from 3% to 4% to 5% inflation. Across the same 3 to 4 to 5 years. A best-case scenario is going to see you lose just over 9%, and the worst-case scenario, a 5% inflation over 5 years, would see you lose over a quarter of your purchasing power by remaining in cash. And this table shows you for each of the historical— I think it's called the Hamilton Nine recessions— you can see that it averaged 5.5%, which is even higher than the highest point we saw on that table just a minute ago. So whilst inflation will inevitably cost you, a recession on the on the other hand, whilst likely, is actually not guaranteed. And this shows you how by missing even just the best 10 days over a 20-year period, you would end up coming out with less than half of the return that you would otherwise have gotten through buying and holding the S&P 500. So if cash is out of the equation, then the next thing people often go to is gold. But the problem with gold, whilst it's been on an incredible run recently, is that people who are new to the market forget that it went sideways for over a decade, with gold rising at an annualized rate of just 1.5% per year. That is less than the return you'd have got on a high-yield savings account. And that's the problem with gold. It doesn't produce any cash flows in the meantime while you're sitting and holding it. So the third place that people then go to is commodity stocks. But this is also a mistake. Take the rally that we saw in energy, for example, in the run-up to 2007, the ticker for the energy sector ETF being XLE. And as you'd expect, you can see how it's moved one for one with the price of oil. So whilst it was a great hedge on the way up, it was just as cyclical as any other part of the market going into the recession. And the XLE energy sector ETF fell over 50% from its peak. So if it's not oil, Then how about mining stocks? Well, the problem here is that the sector is actually quite oil intensive. They have to pull all of this metal out of the ground, so it's more vulnerable to fluctuations in oil prices than you might otherwise have expected. And you can see here the relationship between the Metals and Mining ETF, again in blue, compared to an indicator of the US business cycle, the ISM PMI. In white. You can see how it fluctuates and oscillates, and you can see how metals and miners have done pretty much the same thing. So where does that leave us? If cash is losing value, gold can't be relied on, and energy and mining stocks will still get crushed in a recession. Because conventionally, this combination of inflation and recession is supposed to be the worst possible environment for almost anything. But here's what the data actually shows. And it's exactly how I invested through the worst inflation we'd seen for a generation just a couple of years ago. Believe it or not, equities over the long run, absent perhaps mining stocks and energy, have been a better inflation hedge than gold and greater than the alternatives that they've listed here. Here you can see a table again of those energy price shock periods of high inflation all the way back to 1933. How quality in all but one of them has delivered a positive return, and it also produced a better return than the S&P 500 in virtually all cases. So in 6 out of the 8 periods, quality stocks provided an edge. And here's one of the reasons why. Consider this as the business cycle. When inflation hits and we're heading towards a slowdown or recession, we're essentially here. And you can see how quality tends to be amongst the best performing styles. And it's not just a defensive play because over the full cycle, and in fact many cycles, as you can see here, quality has come out on top. It's absolutely blitzed the S&P 500. And what I'm about to show you now explains why this is possible with this style. So here's the model that I've created. You might have seen this in my other videos, but essentially it analyzes stocks according to 7 criteria, and it produces this kind of footprint chart, which helps you to very quickly see just how high quality the company is. And there'll be a link in the description if you want to get a copy of the Top Stocks report for the leaders in each of these categories. Essentially, what we're looking for are predictable rising revenues compared to this crazy cyclicality like you do get in energy and mining. The next thing to look for is strength of balance sheets. So in one word, this is profitability, lots and lots of free cash flow. The third one, and this is hugely important during times of inflation, not just slowdown, is pricing power. And this is the ability for the company to pass through the costs to their end consumer. So if your product isn't really in demand or you don't really have an economic moat, so to speak, you're less likely to be able to continue raising your prices without seeing a significant drop-off in demand. So let's go through each of these examples taken from the model that shows you quality companies with pricing power. We'll begin with Hermès. Growth in sales year after year, even during the pandemic, there wasn't much of a drop-off. Profitability also rising, 45-degree trend, and then the pricing power this is high and stable. So the ability for this company to continue selling more year after year and maintain its pricing is what gives it that edge over the market. Contrary to what you might think with it being a luxury goods company, because Hermès, unlike say LVMH for example, serves truly wealthy people, it's not as exposed to aspirational buyers. Hate it or love it, the true 0.1% are only going to emerge from a recession or a crisis even better off. Than they entered it. Whereas the middle class, generally speaking, is going to take them some time to recover where they were at. And another example is Mastercard. You've all heard of them, unless maybe you're in Buenos Aires, as I am at the moment, and, uh, there's a few payment provider problems. But anyway, they're doing pretty good. Here again, you can see incredible growth, incredible profitability, and super high pricing power. Margins of 46% on average. And one of the reasons they're able to do this despite being exposed to the consumer and consumer spending is through network effects. And this is what makes their business model so resilient, so scalable, and ultimately so bloody profitable. And that can be seen in the numbers here. Now thirdly, we've got a slightly different company in tech, Adobe. That's got to be the most attractive that we've seen yet. And similar with the trend in profitability, the margin, it's not quite as high as Mastercard, but it's higher than Hermès. And at 37%, that's incredibly healthy. And durable. However, when we look at the performance of these 3 stocks relative to the benchmark, something is happening here all of a sudden with Adobe. And what I'm about to share with you will change everything around how you should be thinking about investing, not only in quality, but in the stock market overall. And I say this as somebody who professionally managed money for over a decade. Everything's just changed. The number of companies in the S&P 500, the US stock market, reporting a material risk of disruption from AI in their quarterly reports stands at 72%. Take for example the trend here that we saw in the so-called SaaS-pocalypse. $300 billion was wiped out basically overnight in one trading session. So while semiconductors have generally continued to rise, software's been absolutely obliterated. And this is indicative of things like Claude and GPT now being able to code and replace programmers to the point where you can just replicate analytics dashboards or whatever it may be, very much like the tools I'm about to show you in a minute, overnight and for free. So there'll be a link in the description to this. It's very much a prototype. I'm calling it my AI X-ray, and what it does is it looks through the S&P 500 and it attempts to categorize the perceived opportunity and threat and combine the total disruption and breaks it down by sector. So what we can see at the top is technology leading the table in terms of the extent of disruption likely to take place. These are of course on the estimates, but I've distilled down a lot of the reports from the likes of Morgan Stanley, Goldman Sachs, McKinsey, and a bunch of other credible sources that have categorised this. So scrolling down to the table, we can see this presented a little differently. We've got tech at the top, as we've just mentioned. On balance, it's slightly positive, and hence we see the opportunity categorised there. But looking down this, fairly significant impact for the likes of financials, communication services, which is some of the media platforms, consumer sectors, healthcare, and industrials. For all but industrials, it's a considerable threat to the businesses in these sectors. So let's click through into tech, for example, and you can see a breakdown here. You can see companies like Nvidia, Microsoft, Broadcom, not surprisingly on the left-hand side, those are definitely going to benefit from the AI arms race that's taking place. But there's Adobe on the right-hand side. So it's not as simple as just putting your money into a broad ETF, even a tech ETF or quality ETF. You must be selective now because so much of the market, 72%, is likely to be impacted here. So here's how to do it. Going back to that scoring model, Investor Intelligence, that I showed you earlier, you can see one of the results here and how it prints this footprint chart for us. Here you can see the growth, exponential. Here you can see the profitability, exponential. And here you can see the pricing power with the margins, also incredibly resilient. You'll have heard about Nvidia, unless you've been under a rock, and how much the share price has gone up. But there are some ideas in here which might be new to you. So ASML, for example, has a niche within the value chain which is based on something known as photolithography. Its revenues are surging, its profits are surging, and its margins are also pretty good, 25%. And the result is that a $10,000 investment would've gone up 14-fold over the last 10 years, returning $140K compared to just $35K had your money have otherwise been in the S&P. Which now, as we know, is likely to come under tremendous risk with the majority of companies being disrupted. You cannot afford to be complacent in any aspect of life or investing now. Now, a third one just to throw into the mix is Monolithic Power Systems. It sits within a part of the value chain where it's a specialist in providing more energy-efficient solutions for chip manufacturing. The growth, once again, same old story, is incredible. So too in profitability, and the margins are pretty stable. So the growth in the share price was a little bit better than ASML. $10,000 invested 10 years ago would be worth $165,000 today compared to that return again for the market of just $35,000. There's a link in the description if you want to get hold of a copy of the report for free. It basically shows you the best ranked stocks. In each of these categories to help you understand what you should be looking for. And if you want to know more about this, now you've seen how to put this together and what you should be doing with a cash lump sum, then watch this video next, which YouTube thinks you're going to love.