The EXACT Investing Strategy That Made Me $2M+ At 37
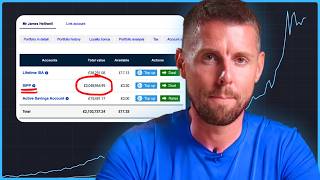
James Helliwell grew his pension from £1.5M to over £2M using an AI-driven seven-factor stock model. He breaks down 2025 winners like Lam Research and Alphabet, explains his valuation rules and holding discipline, and maps out macro risks for 2026 including quantum computing and obesity drugs.
Questions this video answers
around one and a half million quid.
nearly 33%.
two years.
anything north of 30 times free cash flow.
around 15–18 times free cash flow (he said certainly sub-20).
Chapters
I grew my pension by over half a million quid last year. And in this video, I'm going to share with you the exact system that I use to do that, that you can employ, regardless of whether you've got 10k, 50k or north of 100k to invest in 2026. So before we go any further, here's my account with Hargreaves Lansdowne. I've got a little ISA there, small amount of active savings, but here's my pension, which at the beginning of 2025 was around one and a half million quid. I've just crossed two million, which feels pretty incredible. And honestly, I hadn't looked at this until I logged in today. So here are the winners and losers in my portfolio in 2025. I've called out six here of the 17 names that I own. So these radar charts, as I call them, give you a comparison. If we take Google, for example, here of the stock, you can see the footprint here for seven factors that my model and my stock selection process is based on. In white, you have the S&P 500 for comparison. So in other words, Google versus the average company in the index. And what we're looking for here is a broader footprint because that means that Google's more efficient, it's more profitable, has a better price trend, it's growing faster, and it has better durability than the average stock in the S&P 500. Now, most of these companies, say for Novo Nordisk and FactSet, are not cheap. They trade at a premium in terms of the valuation to the market, and that's because quality will usually command a premium. You don't often see Rolex watches on sale or Hermes bags. There's a reason for that. People are prepared to pay more for them. There's a reason why they increase the prices every year. So let's go through the first name, Lam Research, Semiconductor name lrcx. Let's just take a look at this snapshot, which is delivered by my AI model, which I've developed and is available inside my program according to the seven factors. So we can see very clearly how durability is much stronger than the market. Efficiency is way out there. Profitability, again, is way out. Price trends very strong and growth is also much higher. So we don't need to smash it on all seven factors. But ideally that's what we're going for. We're going for as many as possible. Now, we can see that the valuation certainly comes at a premium. Reinvestment could be higher, but it returned nearly 150% as the best performing stock in my portfolio in 2025. When you look at why here we're looking at growth, you can see how 10 years ago it did just over 5 billion in annual sales. Today it's doing four times that. So that's 4x. The trend has been pretty linear, so smooth and consistent. There were a couple of corrections here, but broadly speaking, it's been trending 45 degrees up to the right and that's exactly what we want to see. It's all well and good being able to increase revenues, but whilst that's vanity, in some cases, profit is sanity. And again, we did see a couple of blips here in the pandemic, which is understandable, and a bit of a blip in 2022. There's one more here, but if you were to draw again, like a line of best fit, a regression line, we've got that 45 degree slope and it's very hard to find companies that have charts that look like this. So this explains the profitability segment on our radar chart. So we've looked at growth, we've looked at profitability and we can see why they are outliers now to the valuation. Clearly, lam Research, according to my model, is a solid company, but is it now too expensive? I won't ever sell a stock or buy a stock on the basis of valuation alone. So the fact that it's now trading at twice its median valuation of 20 times free cash flow, that's not a reason for me to sell it. However, if you don't currently own it and you were thinking about buying it, of course it's not being investment advice, being for informational and educational purposes only, then to me, Anything north of 30 times looks pretty demanding. If you can get anywhere near 10, it's obviously a bargain. So midpoint is 2010 above 10 below is kind of the range. So at 40 times, I'm afraid it looks too expensive to initiate a position here. For me, they're probably going to be better ideas, some of which are in this presentation that you might find. So let's move on to Google or Alphabet. This was another big winner in my portfolio and for many years it's been my favorite investment. Look at the growth, profitability and the price trend compared to the S and P, it returned nearly 70% in 2025. And back when I was running the fund, that's where it was. And later on, following the pandemic, when I was getting really bullish on Google, we were around here. So even Slightly less than five years ago, just five years ago, it was doing around 250 billion in sales. It's now doing 385, maybe we can call that 400 to round it up. Almost 400 billion in sales. That's just in five years. But where we go back to the beginning of the chart, 75 was where it started, that is tremendous growth. And you'll see here that there wasn't a single negative year of growth. So in other words, sales have grown year after year after year for the last decade plus. Now, in terms of profitability, again looking at free cash flow rather than earnings per share, which is more easily manipulated, we saw a little bit of flatlining in 18. This is where I began to get bullish. And then we saw a very quick reaction and obviously things surged from there. There was a little bit of a correction compensating for the surge that we saw during the pandemic. But generally speaking, it's once again been a case of that linear 45 degree trend. We've gone from nearly 17 billion in free cash flow to 74 billion in a decade. And this is the main driver of stock market performance over the long run. So the average valuation is 2627 times free cash flow. Given that the Stock has risen 70% this year, it's no longer cheap, to say the least, at 51 times. So it's almost twice its typical valuation. However, what I want to point out here is first of all why, as well as the fundamentals that were shown up on my radar, why I was so bullish in 2018 and why I was so bullish again in 2022, 2023, it was because the stock was undervalued. It's an exceptional profile company that was available not only a reasonable price, but at discount to its historical valuation. And that's why I will always compare a stock to its own history rather than to another stock in the market. Because you're not necessarily comparing like for like. If you compared the valuation of Google to say, Nike, they're two different companies. One of them is tech, the other makes trainers sneakers. So I prefer to. I look to buy the best quality companies in the world and then I look to see relative to their own history, not relative to lesser quality companies or completely different companies, whether or not they're at a similar kind of valuation to historically or whether in some cases they might be even cheaper. They'll never look cheap compared to the market, but they might be cheap relative to their own history. And believe it or not, we had an opportunity again this year and this is what you probably missed out on and that is what sparked the 70% rally that we've seen in 2025. So is it still a viable opportunity? I wouldn't be buying today necessarily at this valuation, but I'm glad to hold it from a lower level. But don't despair because there are going to be some ideas elsewhere in here. Rollins, the next stock. These guys are in pest control. So if you think of cockroaches or what have you, they're pretty resilient, they keep coming back, you can't really get rid of them. These guys are the world leaders in pest control. Not only that, they have multi year contracts so that even in a recession where or pandemic where office buildings might close or certainly they reduce headcount and therefore the number of desks and square feet that they need. Rollins enters into multi year contracts with their customers. So they can't just cut during a recession and therefore see a lot of volatility. In Rollins business, these contracts are typically long enough to smooth out a lot of the revenue and, and that's what makes it so resilient, save for valuation. Durability is kind of in line too. It's exceptional in every other metric and this is one of the, I think top compounding stocks over the last century. We talked about linearity or smoothness of that trend in growth and profits, but we can see it here in the share price. It looks pretty distinct to say the S P500 if you pull it up, or MSCI World and here's why. Consistent year over year growth for a decade plus seeing sales double from one and a half billion to over three and a half billion in the last 10 years. This for me is a beautiful chart. Similarly with profitability, save for a little blip during the pandemic where again those multi year contracts cushioned what otherwise could have been devastating impact for B2B service providers. We once again see this incredible growth. Now this of course is known to the market and that's why it's historically traded at a pretty lofty premium of 45 times free cash flow. It's due to that predictability and that resilience in its business. However, right now it's trading absolutely in line with its historical average. So it's neither cheap nor expensive. There was however, an opportunity a couple of them earlier in the year. If we look at a typical trading range, we might say give or take, it's trading between from the midpoint of 45, it's trading between 40 and 50 times free cash flow right now. It's bang in the middle. There were two opportunities here earlier in the year to buy at 40 times free cash flow. And these rarely come along. I should say they come along quite often, but they rarely last for very long because investors will always snap up these opportunities. One, two this year. Last one was late 2023. I suppose we touched again early in 2023. So actually this stock, if you were, heaven forbid, a more opportunistic or active trader, which I'm certainly not, as I'm holding these companies for multiple years, you actually get quite a lot of opportunity to enter in here. Maybe you, maybe you would buy in the 40s and sell at the 50s and in the meantime you can just sit on the position. So it's not necessarily cheap, but it's fair value at the moment. So that's quite an interesting one. Now let's move on to take a look at Copart. These guys basically run vehicle salvage auction platforms. They're the world leaders. They even have them here in Australia, where I'm recording from. And there's been some talk about driverless or autonomous vehicles potentially reducing the volume of accidents and therefore the volume of write offs that salvage platform auction platform specialists like Copart ultimately profit from. Heaven forbid your vehicle's written off in an accident, then your insurer is going to sell or make sure that the vehicle, once they've given you your payout, is taken to a salvage auction so that they can try and recover some of the money that they've paid out to you in the policy cover. The counter to the argument is, is that the more advanced and sophisticated technologically that cars become now, with the ever more sensors in the front grilles or the front bumper or fenders you might call in the U.S. the more costly they are to repair from even minor damage, and therefore the more likely they are to just be declared a write off. In other words, uneconomical to repair and just easier to replace. So that could actually mean that there are more write offs, given the higher cost of repairing higher value autonomous vehicles. But nonetheless, getting back to it, here you can see the footprint save for reinvestment is superior to the average stock, which again, ETF investors are holding in basically every metric apart from reinvestment. So would you rather own Copart or an etf? Well, it's pretty clear. And here comes the Twist. It fell 30% in 2025. So of course my big winners have compensated for the losers that I'm looking at here, but this, to me seems like the market knows something that I don't. But because I hold a stock, come what may for a minimum of two years, and I don't sell on the basis of valuation, which in part is driven by the price, of course, and technicals, it really doesn't matter. Unless the core fundamentals of the business, which of course show up here, have changed, I don't see any reason for that, any reason to worry. Here's why. Look at the growth in sales. Okay, it's a little bit flatter here, but we've been there before. It's kind of. There wasn't much of an increase in 19 through 20 and then it just accelerated, if you pardon the pun, to go from 1.2, 1.3 billion to 4.7 billion is pretty damn good. I definitely want to own that business. In terms of profitability, it's gone from 158 million to 1.4 billion. So I'd say it's 9 or maybe even 10x over 10 years. And we did have slower growth in terms of free cash flow. We did have like less profitable periods in terms of profit growth. And again here, but broadly the trend's doing this and it's done so for decades. This, if you want to look at an inspirational all American entrepreneur story, you should really read into the founder, how he started out with one or two salvage yards, I think in Miami, Florida, and I think it was maybe the 70s or 80s, and how along the way his business partner didn't have the same conviction to expand with him and walked away, left him to it on his own and he just acquired premise after premise after premise and the rest is history. This is where it gets interesting. The fundamentals still look very good and yet the valuation at 23 times free cash flow compared to 48 times is at a major discount, perhaps 50% discount. Let's just say. When we look at the typical range, we could say, okay, 40 is obviously the average. Maybe it trades between 60 and 20, maybe a little bit higher, like 25. This is as low as it's been in 10 years. You'd have to go back to 20. 2016, it's even lower than it was in 2022, 2023. So this for me is a very interesting opportunity. If I didn't already own it, I would be filling my boots at this level. Even if we just get back to a normal typical valuation, you're going to go from 23 to 48 times could potentially see that kind of upside or rather I should say that kind of upside, of course, returning from 50 to 100 if you like. So that's very, very interesting. Now, Novo Nordisk has been an absolute stinker for the last couple of years. It was the best performing stock for many, many years before that. But for those of you that haven't heard of IS or maybe was the world leader in diabetes drugs. And that's before it moved into things like Wegovy and the weight loss drugs that now people are clamoring for. The problem is that they've always faced strong competition from Eli Lilly in the us and basically Eli Lilly stole the show and ran away with it in the last year or two, just when Novo Nordisk was being regarded as the king of the industry. And what happened, along with profit warning, CEO resignation this year, is that there was a shit ton of counterfeiting also taking place. So they had intense competition from Eli Lilly and also I think throughout Asia, specifically, a lot of fake pharmaceuticals being produced, obviously at a much lower cost than the branded version that Novo is putting out, likes of Wegovy and so on. However, looking at the fundamental profile, it's one of the strongest companies in the universe. Now, the valuations adjusted since producing this chart, but in every metric it's Superior. It's down 47% in 2025, but this is actually a 10% single day move. And we got some good news within the last 48 hours that the FDA, the regulator in America, has just approved the weight loss drug Wegovy for use. I think this could be a real opportunity. So let's take a look at the growth. Actually, for a surprising amount of time, it was kind of going sideways. It's a very predictable, stable business, but not really growing. And it really took off after the pandemic. And again, this is coming through. The weight loss drugs primarily, and of course continuation of the growth in diabetes, it's reflected in the profitability. Similar sort of trend here, but this is what's been coming off in the last couple years and hence what was previously unthinkable profit warning from them and CEO resignation occurring earlier this year. You can see how the market has discounted the news, but it's only back to pretty much an average valuation. It's not horrendously cheap here, as in something that would make you excited. So I'm kind of neutral on it. I don't believe in selling it here, although it's been on my mind a few times. But equally, I wouldn't add to this position at the moment. Despite what I've seen in the fundamentals, it had risen to such an extreme valuation that it wouldn't take much, never mind a shitload of counterfeiting and all the rest, to see it correct. Sharply lower as it has done. So this for me would need to be considerably lower for it to become attractive. We're talking certainly sub 20, probably around 18 times, maybe even towards 15 times free cash flow. I should do 15 to 18. And right now, like I say, we're at 23. So what's cheap could be even cheaper tomorrow, I'm afraid. Now the last one to wrap up before I explain a little bit more about 2026 and positioning for that is FactSet. I began a career at one of their competitors, Bloomberg. If you don't know, they're the fancy computers, the terminals that you see on trading desk at the city. I used one, even had one in my house for a period of time through the pandemic when I was basically trading and managing still the fund from there. And these things are like 2,000 in the case of Bloomberg, two, two and a half thousand dollars a month and you're entered into a minimum two year term. Typically it's a little bit different factset but similar kind of business model. So they're a financial data provider. It's a pretty sticky, resilient business. It's not B2C, it's B2B tools for high value employees that need this data and it's pretty sticky. So with the exception of Reinvestment, which is basically in line, this has a phenomenal profile. And I initiated a position in factset only this year. So given my minimum two year holding rule that I mentioned, it's not up for review right now, which is a good job because the share price down nearly 40% has had a stinker. But as they say, it's only a loss if you sell. And FactSet is one of the rare companies I believe that has never had a negative year of sales growth. It's increased its sales every single year and I don't know that there are that many companies, maybe a couple of hands, handfuls that have done that. So it really is an anomaly. So it's an incredible business model with network effects that drives growth. And whilst, you know, profits were kind of sideways there, this is free cash flow. We do see a general trend that's still gone from, well call it 300, roughly 300 million a year to north of 600 million a year over 10 years. So they've doubled. This is a very stable Predictable business. And that's why I'm not overly worried now when you see the valuation, this is what gets me more excited than anything we've looked at so far. The average is 28 times free cash flow. We're trading below 20. That is a significant discount. It's even cheaper than it was in 2016 where it traded at 20x. Even during the pandemic it was at 22 times. It then sort of bottomed out. Should we say it 24 times a year later and here at 26 times. So what we can see is this 20, 22, 24, 26. So ever higher lows if you like. Every time the stock sells off, sentiment sours, people panic. The low is at an ever higher multiple, which shows increasing confidence even in the ne, even in a crisis, compared to the one previous. Now down here at 20 times, that's a humongous discount. And it's also a break of this trend. So unless the world is ending and. FactSet is not going to be around next year, then I would expect it to revert to at least the median. So if you go from 20 to 28 times earnings, you'd be looking at, I would say at least 40% upside. So that would be to just get back to here. That's very interesting. So there's no way I'm going to let go of a stock that looks like that. And it's trading down here. It's absolutely insane, guys. So to just quickly round up on what we've seen from 2025. The leaders for me were Lam Research, Google and Rollins. The laggards were Copart, the vehicle salvage platform Factset, which we've just seen, and Novo Nordisk. Overall, the total gain for my portfolio came in at nearly 33%, which is three times that of the MSCI world. So the global stock market should probably hold via a bloody etf. So you've seen how my system works, how I select stocks. But let's look ahead to 2026 and how that fits in with some of these so called outrageous predictions, which are these supposedly low probability but high impact scenarios that the analysts at Saxo bank, which I formerly worked at earlier in my career, have predicted could happen in 2026. Now I've summarized the eight key themes that they've called out, but there are three that I want to focus on in particular. So the first one around quantum computing, leading to a potential collapse in crypto and the knock on effect there. Also, understandably, obesity drugs, which Novo Nordisk certainly has an interest in. To say the least. And then this golden yuan, the Chinese currency, how pegging the Chinese currency to gold could have major implications for the US dollar as the reserve currency and for investors more broadly, as I'll explain. So these are the things that you need to be aware of going into the year. They might not be as outrageous as you think. So given the advances that we've seen in AI, if you think back over the last few months, certainly throughout 2025 and beyond, we've seen leaps in their capabilities. But that could prove to be a drop in the ocean compared to the power of quantum computing and the possibilities. Now, I'm not going to get into cryptography and everything else, but the analysts at Saxo are saying that there could be this, like, Q Day collapse, which would affect Bitcoin for sure on crypto and I think have some spillover effects for us as investors in the stock market. So this is the idea where quantum computing power decodes and cracks the blockchain or similar security protocols. That really undermines confidence in crypto and leads to this shift towards better cyber security, better network security. Now, there's a company in my portfolio which specializes in this, and I'm not going to reveal the name here, but if you click on the link in the description, it's in the top stocks report, which gives you a watch list of the best performing companies, as the name suggests, in each of the categories that my model analyzes, those seven factors in the model. And this would be really interesting because if crypto goes pop, I can't even spell it. Let's go to the next one. Keeping in mind that it was already down 16 or 17% this year. Just look at what could happen. We're not talking about a further correction. It could be a complete collapse. If the system goes confidence and all trust goes in it, it's all of a sudden completely illegitimate. Now, what would that mean for all of that money that's otherwise parked in crypto? Would people look to gold as a store of value? I think almost certainly so. And might they move across to traditional assets and begin investing more in, say, tech, which would be the antidote or the solution to this problem? So there are still implications for us as stock investors, but I'm calling out this one as a more generally interesting topic. So I'm not pro crypto. The other one that they see is obesity, drugs becoming more mainstream, even crossing into pets as well as humans. So clearly for Novo Nordisk, we've actually seen the opposite to crypto, where it's already been massively discounted. And we're actually now seeing a potential positive catalyst in addition to the FDA's approval in the rollout of these drugs across obviously the human population, but potentially also into the pet industry, which is huge business for the likes of Mars, which are privately held and own a shitload of pet food. Nestle I believe, owns Purina and a bunch of other brands and so on. It is big business, guys. But the key one for me, and this should make more sense now as we relate it back to what we've seen so far, is this risk to the dollar and its status as the world's reserve currency that's already sliding. But if China, as they're talking about here, was to roll out its own version of a gold backed currency, Chinese Yuan, then this could accelerate the decline or further diminish the status of the dollar. Now that might sound like conspiracy, Now that might sound like conspiracy talk, but ultimately this would impact all, all of us. Because without getting too technical and lost in the weeds here, if dollars some money is pulled out of the US system by overseas investors, then it means that bond yields, U.S. treasury bonds should go higher. So the U.S. government's borrowing cost, also known as the funding cost, increases. And again without getting lost here in the details, higher bond yields, higher funding costs are correlated with the stock market via the risk free rate with valuations. So that would basically see higher borrowing costs bleed in to lower PE multiples, if you want to think in that way. So if the US stock market has historically traded at, let's say, 16 times earnings, if borrowing costs increase, yields increase, then it could see that four, we'll take a hypothetical number, let's say 14 or 12 times instead. Now that's a lower rating for U.S. assets. And that means that stock prices generally would face a headwind compared to other global markets. Because what's ultimately happening is that money will flow out of the US in that scenario. And given how all of this money has been chasing US assets for at least the last 20 years, overlooking pretty much every other global market, that's a real risk that investors face in 2026 and beyond, especially if you're investing in ETFs. Look at that in a second, but quickly to see where the dollar has traded historically. This is the dollar index. This Midpoint is at 95. If we look at the range, it may be trades perhaps 10 points out either side, maybe up to 105 and 85 on the downside. So it's not a massive range. But realistically, if this was to play out, I think would be not only towards the bottom of this range, but it could potentially break lower and who knows, maybe test a new low. If the US is no longer the world's reserve currency, there would no longer be a premium in the US dollar. Furthermore, the things that are taking place under Trump, we've seen more tariffs which are negative for the dollar, tighter immigration which is also negative for the dollar, and higher inflation, which is literally the erosion of the purchasing power of the $ negative. And in combination, in terms of how it affects US as investors, US markets, both stocks and bonds, become less attractive compared to other global alternatives. So what this could mean is that this double bubble of both US stocks rising and the US dollar strengthening, as we've seen since 2009, this could potentially reverse where stocks go down and the dollar also weakens. So the double bubble benefit becomes a double bubble burst. And even if stocks were to go sideways, the dollar goes down. If you're an overseas investor, you're neutral there, but you've lost here when you convert your money back into yen, pounds or whatever, your home currency. Outside of the US we've seen almost $3 trillion flow in to passive funds, ETFs, in other words, and about the same flow out of actively managed funds. So we just call this like single stocks, stock picking, which is what I did as a pro. And this could rise to 80% of the market. It's already crossed over this in the last couple of years, but this could be as much as 80% of all of the purchasing and selling in the stock market in less than 10 years. So this means that there's a wall of money passively invested in things like the MSCI World etf, which despite sounding global in name, is anything but, with more than 70% of it invested in North America, the United States. This is the real risk that most retail investors are oblivious to and why you should build your own portfolio, take control and not be exposed to these kind of risks. All But Tesla and JP Morgan are in tech. All of them are us and 8 out of 10 are tech. That's the global MSCI World etf. And if the dollar begins to decline, money will flow out of tech in particular, but certainly out of US assets overall. Now look at what happened to Japan. For 40 years. From 1950, it was the best performing stock market in the world by far. It 10 xed the S&P 500, which should have done something like this by comparison, over that period, that was until it peaked in 1989. And you can see that it took until 2024 to recover. So all of this period, investors were holding losses for 34 years. If you're watching this in your 30s, that could literally be the remaining time you have until retirement. If you're watching this in your 50s, then frankly, I'd be shitting myself over this. And this is why I strongly believe that you need to be building your own portfolio. Don't go to an advisor and get ripped off by fees. That's just as destructive as otherwise blindly parking in an ETF and being exposed to these risks and having no control. So before I reveal the name of this idea that I want to put on the table for 2026 to help you get started, I want to play a game with this and say, looking at the profile, would you invest hypothetically? So growth is superior, durability superior. So too is efficiency, profitability and the price trend. It's the only reinvestment. And the valuation which has since been updated, we'll look at in a minute. That lag what you would otherwise get with, say, an S P500 ETF. So here you can see the growth in sales. There's a little blip in 2020, but broadly speaking, this has been rising. It's gone from 1.5 billion billion to 3.5 billion in the last 10 years. The free cash flow, profitability has been a little lumpy for a couple of years. There are reasons why more nuanced, one of which was, of course, the pandemic. But 2017 is a little bit iffy. We'll disregard this. Maybe I'll make that nicer. Maybe we'll bring that up to average. And realistically, the line of best fit is still rising. It's gone from 250 odd million to 1.8 billion. Many, many times that. But the valuation is where it gets more interesting because you can see the average multiple is 37 times and it's trading well below that, about 20% lower. Call it 32 times. So it looks to be at an approximate 20% discount to its historical range. So we've seen profitability, growth and valuation all appear pretty appealing. The other ones here I explain in more detail inside of the top stocks report. Again, you can get that via the link in the description. It's completely free. But the trend is where it gets interesting. Up until the beginning of 2025, it was just like that. I believe it was compounding at nearly 30% per year. 28, I think it was. But we've now seen this correction. I wouldn't ever put technicals first. They'd come last, if at all. But in terms of the setup, this is using something known as a Fibonacci retracement level. Basically, you draw this. In this case, we're buying from the low to the high and then the idea is that it's going to work through these retracement levels in orange. And this is the major one, 61.8. This is based on the so called golden ratio. As it works through the levels, it tends to go down, then revisit or retrace, go down and revisit, go down. If it breaks this one, then the uptrend is likely over, it's invalidated. But probabilistically it should rally from here. Of course, it's not going to go up in a straight line, but you get the idea. So the level is 285 and the previous high was just below 490. So that gives us about 70% upside if it just recovers the previous peak. But consider the fundamentals. First, profitability's in the top 10% of the companies that I track, and I don't track the full market. I track quality companies inside of that universe. So higher quality companies, it's still in the top 10% of those. It's in the top 10% of those for durability and it's in the top 20% of those for efficiency and growth. Reinvestment is a little below average, but the valuations we've just seen is also favorably below average. So for me, I'm very interested in buying the stock and I don't tend to make many additions to my portfolio over the year. So the big reveal, it's a company that you've no doubt heard of. I briefly had one. A black Ferrari, as it happened, was just stolen the night that I got it. But Ferrari is arguably one of the strongest brands in the world, along with Perhaps Rolex and McDonald's. It's right up there. The fundamental profile, as we've just seen for me, is very attractive, particularly for a car maker. I wouldn't tend to invest in that industry. Those that are more cyclical, that have big manufacturing plants and are capital intensive, in other words, as we'd say. But Ferrari is a brand more than it is a car maker. And ultimately the ultra wealthy that genuinely afford these things, not serfs like me, who have one shot and then don't do it again. So they got their hands burned. They're only going to get richer during a crisis and the whole exclusivity thing and frankly, treating your clients like shit sells more cars, increases demand. This of course isn't a recommendation. I'm just sharing with you personally what I'm looking at and hopefully you're beginning to get an understanding of how I analyze stocks, how I look at the stock market. And yeah, I hope it helps you in your own investing. Just a final reminder, if you do want to get your hands on my top stocks report, it's completely free, click the link in the description, you can get yourself a copy there. So whatever you do, don't bury your head and do nothing. See your money eroded once again by inflation and don't hand your money over to an advisor. What they will likely do is put you in one of these model portfolios which is just a variant. So in other words, a slightly different adjusted weighting of the so called 6040 model, which is 60% stocks and 40% bonds as a target. For the reasons that we've looked at with the outrageous predictions, which I don't think are that outrageous in some cases and I was already carrying into this year, if the dollar goes down, US stocks will underperform global markets presumably. And if inflation goes up, bonds will also get sold and underperform. So a 6040 split in stocks and bonds is useless. There's no diversification there. They both go down at the same time. And that's assuming that your fund manager actually keeps up. Because over a 20 year period, large cap fund managers after fees have underperformed. Only 1 in 20 actually beat the market, meaning that they just don't deliver you any value. Of course, if you do this for yourself, using a professional process that I've taken from my career and continue to use in that way for myself, without charging yourself a fee, you stand much better odds. But to put things in perspective, I like to play a game called advisor Roulette. Rather than having one bullet in the chamber, your odds are like having three bullets out of the six loaded and then spinning and pulling the trigger not once, not twice, not three times, but four times and somehow surviving. That's how slim your odds are when it comes to making money with an advisor after fees. And why I think that's financial suicide. So what I'm trying to get across here, and hopefully has come across now, is that you can do it yourself, just as I've proven in 2020 five years before that as a pro, and hopefully it will continue in 2026. And you'll also be able to apply this I've shown you stock Selection. What I want to just wrap up with lastly is a quick look at portfolio construction and time horizon. And the additional edge, or in other words potential outperformance that is driven by this will assume a hypothetical scenario where you've got 10k and you're investing it according to the averages by legal in General in your 30s due to retirement age over 37 years at the historical market return. So we just call this an ETF. You'd have 200 grand before inflation, which is important to note with stock selection. As I've just shown you, there's a clear edge over the market in every single region, whether it's emerging markets, Europe, the US or the world. It lowered risk and increased returns consistently across the board. Emerging markets, Europe, world, usa. Lower risk, higher returns, which is what it's all about. And of course without paying any fees to a greedy advisor, an edge of call it 2% would see you go from 200k to 343. But that's before the next edge that we can get through portfolio construction. This is the reason why I've mentioned a couple of times a minimum holding period of two years for any stock that I own. Those only those with patient investment strategies outperform the market and they outperform the market by just over 2% per year. This is a study by the Journal of Economics. That's where we add another 2% edge. And hypothetically it takes our 10k from 200k to 340 and then 580 grand. The final layer, which I explain in more of my other videos, I just want to leave you with this quickly is in your time horizon, there's no edge in short term trading anymore. It's been competed away by hedge funds, high frequency algorithms and vast amounts of capital chasing the the same opportunities which no longer exist. You don't want to be competing anywhere around here. It's a fool's errand. Even if you're really, really good at it, there's not much return available on the table. In terms of excess return and edge. You want to be looking well as we've seen, not only one year but two plus years out. So it really eliminates these as well. And you can see according to this study, which was done by mfs, looking at the dispersion or how has matched up for the global stock market, the MSCI world, you can see how the longer your investment horizon, so we're looking like three, four and five years out, we do this in a different color. The greater your edge, longer horizon, greater edge. So this is where your opportunity is. So forget any of that. I know I've made this super messy, but you need to be looking a minimum of three to five years out. Two plus years on any single position and for your overall portfolio. Got so used to putting percentages. Put percent there for your overall portfolio. 5 plus years as long as possible. Buy great companies, do nothing. That's the mantra. So that's how you can take 10k instead of investing in an ETF earning 200k over that horizon before inflation to nearly 1 million quid. ETF. The edge that I teach inside of my program. It's as simple as that, guys. In the short run, the market is a voting machine. It's driven by sentiment, but in the long run, it's a weighing machine. It reflects fundamentals. And investing with a fundamental edge is how you get ahead. And if you want to learn more about that, then click this video next, which YouTube thinks you're going to love. And if you don't love it, then don't give it a thumbs down because the share price needs to go up another 70% this year. And I've got a lot of it in my portfolio, thanks.