Why Retirees With $1M Actually End Up With $5M
James Helliwell, a former trader, argues the 4% withdrawal rule is too conservative and shows how a $1M portfolio can grow to $5M through low fees and concentrated stock picking. Typical advisor fees drain 2.5% annually, cutting portfolio value in half over 30 years. His approach uses 20 high-quality stocks with under 0.1% fee drag, stacking small edges to compound wealth over decades.
Chapters
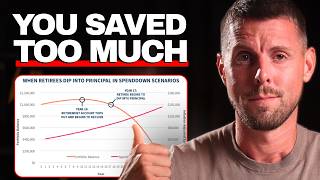
What if I told you you could retire with more money than you could ever spend? It's not a scam, I'm not here to sell you into a day trading Discord or some dodgy timesharing Mallorca, because two-thirds of retirees will die twice as wealthy as when they stop working, drawing 4% from the pension every single year. And in fact, you're more likely to quintuple your wealth— that's 5x— than finish with less than your starting principal after 30 years. And new research shows that many investors could end up retiring much later than they could have based on an industry standard model that's been around since the '90s. So if you're worried about being unable to retire early or worse, running out of money after you've stopped working, then the next 10 or 15 minutes should put an end to that. I'm James Helliwell. I'm a former professional trader turned financial educator, and in this video I'm going to show you the right way to invest for your retirement so that you can retire early and avoid running out of money without telling you just to save. Save more because you're not going to save your way to wealth. And if you're still some years away, then be sure to watch to the end where I'll show you exactly how to get 7 figures by retirement. So how is it possible that you could end up dying richer than when you retired? And I'm assuming that you're not going to win the lottery or actually pull off the Hatton Garden Heist. Let's start by looking at how retirement is usually modeled, because most people think that they'll stop working, they'll start withdrawing money, and the retirement pot will just sink gradually until they're no longer around, which hopefully is before they run out of money. Now in the '90s, a financial advisor named Bill Bengen, not Bingo Bango Basement Jacks, came up with a rule of thumb that said it should be based on this withdrawal rate of about 4%, meaning that if you'd remained invested but sell down 4% of your holdings every year in retirement, you'd be able to budget for it. But when researchers ran the numbers more recently, something surprising appeared. And it might mean that you've been planning for retirement based on faulty assumptions. So this is what the new analysis is based on. That's the period of time that you're going to remain invested as you begin to withdraw 4%, presumably, with inflation running at 3%, which I think is a realistic estimate, and your portfolio return being 8%. Initially, your portfolio continues to rise, and it actually peaks in the 10th year. So it doesn't go down immediately once you begin withdrawing, say, 4%. As you continued at that rate, your portfolio wouldn't actually dip into the starting principal until year 17. But here's the twist— this is actually at a 6.1% withdrawal rate, because in order to get to zero in time, which is in the 30th year, withdrawing just 4% wouldn't be enough. With a $1 million portfolio in this case, that difference is $21,000 a year, and that rises with inflation every single year. So this tells us something really important: your retirement pot doesn't start shrinking the moment that you stop working. In many cases, it will continue growing for 15 or 20 years before you even dent the balance. But those numbers assume fairly healthy market returns of 8% growth and 3% inflation. But what happens if things go wrong, if the 60/40 portfolio is based on the performance, or if inflation just runs hot. Because if we're looking at retirement properly, it's best to plan for the worst and then hope for the best. And what I'm about to show you now could change your plan completely. Now, the researcher reran the numbers to give us this alternative scenario, and it's once again same amount, same horizon, but this time assuming higher inflation of 4% rather than 3% and a lower return of 7% rather than 8%. So in other words, our real return would be 2% less. In order to get to zero by year 30, which is what this is based on, the withdrawal rate still comes in at 4.9%, so almost 5% here. So this would still enable you to withdraw $49,000, or pounds if you were based in the UK, every single year. And of course, that would rise according to inflation from there. So even under these more pessimistic assumptions of lower returns and higher inflation, the withdrawal rate is still comfortably considerably above that 4% level that most of the industry treats as gospel. The rule that was designed to protect employees from running out of money might actually be far more conservative than people realize. But there's one thing that both of those scenarios overlook, and over 30 years we're not talking about a small omission, because those examples assume that you receive the full market return. But realistically, none of us are ever going to get that. There's advisor fees, there's fund costs, platform charges, and they all compound against you without you ever really noticing. And obviously over 30 years they're going to really add up, and that might be the difference between a comfortable retirement, perhaps an early one, and living on a frugal income for fear of running out of money. Talking 'bout the dollar bill. So let me show you how the fees add up and how to mitigate them so that you don't miscalculate things and end up having to get a job again at B&Q, which for my American viewers is like Home Depot. So to do this, I want to look at the impact of fees. So assuming that you're going via an advisor, you're going to be incurring a 4% initial fee followed by then advice fees, which of course are per year. Those are 0.5%, which would add up to nearly £40,000. And then the product fees or the underlying fund fees for the investments that you placed in by your advisor, which are presumed to be 1.75% according to the research that I've done. So when you total this up, the total cumulative charges would be £175,000. And again, forget the absolute numbers here, it's not that important because when you get down to percentage terms, it would reduce the value of your portfolio by more than half. So on an annualised basis over the 30-year period, it's deducting 2.6% off your expected return. So this is the number that we were looking for. That's the portfolio drag. Do you really want to hurt me? Now the alternative scenario to reduce these fees would see you build your own portfolio because that way you're not going to have an advisor which make up the bulk of the charges. So in this case we'll assume the same amount invested but you're going to do this in a portfolio of 20 stocks. There's of course no advisor fees so you don't have initial fee, no advice fee, product fees We're considering dealing commissions. I've based them on the dealing costs for Hargreaves Lansdown, which are negligible, particularly over a 30-year period. But there is a platform fee, and this is 0.35%, but it's capped. So when you total that up, $5,800, it barely touches your portfolio. The total cost over those 30 years is 2.3%, which on an annualized basis comes in at less than 0.1%. Just 8 basis points. So that is significantly less than the 2.57 that we're otherwise facing in this scenario. Now understandably you're going to be thinking, well, that sounds great, but how do I pick my own stocks? I might have had my money managed for me my entire investing life, or indeed I've been sticking to ETFs, index funds, those kind of things, which of course here I think are the devil's work. So here's the model that I use, and I've talked about in my other videos, runs my process, looks at 7 factors, and gives you a very easy visual representation of the fundamentals, which could be compared to the index or any other stock. And what you're looking for is a broader footprint, and I'll be covering a couple of examples a little bit later in the video. But if you want to get a copy of the watchlist that I put together for free with a few of these examples on to help you get started, there'll be a link in the description, and essentially you can see how these top ideas would have performed relative to the global stock market, the MSCI World Index. So as you can see, by building your own portfolio here, you're not only cutting costs, but you're potentially getting more upside by picking stocks that have an edge. And that changes our return assumptions here completely, because whilst it's only a couple of percent initially, it might not be enough to get you excited now, compounded over decades, it's the difference between the pessimistic scenario we looked at and the optimistic one. Or even better, and that's what we're going to look at next. So let's go back to Scenario A, same assumptions, but update these with a return that's 2% greater. You could withdraw as much as 8.1% in order to run out of money in the 30th year from retirement. Your portfolio would not peak until the 12th year, so pretty similar to the first scenario. I think it was the 10th year, and this is where you begin to dip into your capital. So it's a very similar curve to the ones that we've seen before, but at a much higher withdrawal rate. That's the difference that 2% makes. This was our base case in Scenario A, so an 8% return, 3% inflation, giving us a safe withdrawal rate of 6.1%. We then looked at— this was the negative scenario. Where it's very bleak and we still came in above 4%. And then this is the one that we've just looked at. So a 10% return, everything else the same as the first scenario, gives us an 8.1% safe withdrawal rate. Now what you're probably asking is, if I stuck to the 4% withdrawal rate under this scenario and used that surplus as a cushion or a buffer, if I was just, you know, really, really conservative and paranoid about the world in retirement, then this is what would happen. Let me introduce you to non-nuppling. It is when your portfolio increases 9-fold. It's no nuples. Remember, you're still withdrawing $40,000 a year from this. In real terms, your portfolio is going to run away at a 10% rate of return. Even withdrawing over $80,000 a year, that portfolio doesn't fall below the original $1 million until the 21st year. And if you'd stuck to the traditional 4% rule under those assumptions, just as we've seen, you'd have dropped £40,000 a year rising with inflation, but your money wouldn't run out. And that wasn't the plan. Your family would get left with a massive inheritance tax bill and you could have enjoyed your money a lot more instead of limiting yourself to just £40,000 a year. Now I'm not saying that we're all going to live for 30 years in retirement to get that compounding, but that's the payoff for keeping the fees low and improving your returns by a couple of percent. And this is great news if you've already got a million invested, but most of you watching this video, I imagine, probably aren't there yet. The real question at this stage isn't how much money you can withdraw, it's how to build a portfolio that gets you to that point of retirement in the first place. And to do that, it'll need to be 7 figures. So our path to a million really relies on 3 pillars. The first one we've touched on, which is stock selection. We'll cover this in a little bit more detail now before looking at portfolio construction and your time horizon. So the idea is that each of these pillars contributes to your overall edge or outperformance over the market in the long run. In the case of stock selection, this is why I'm obsessed with quality. It not only lowers risk, but it also has increased returns in Europe, in the US, even in emerging markets, and of course global equities overall. And the reason for this is because it's incredibly resilient. This chart from Bloomberg shows us the 5-year rolling return, and specifically the difference between the MSCI World Quality Index and just the general MSCI World. 85% of the time, quality has outperformed as a style. And if you consider that your investing horizon, certainly up to the point of retirement, is unlikely to be greater than 35 or 40 years at most, then realistically you're only going to face one 5-year period where it doesn't really outperform. Now We saw this a few moments ago, the 7 factors I look for. And in this case, we're going to use an example of Fortinet, which is the top-ranked stock in my universe. Generates shitloads of cash— I believe that's a technical expression— and it's also exposed amongst many other relevant trends to specifically securing supply chains, which given rising geopolitical tensions is highly relevant. You can see this in the profitability, having generated $2.5 billion in free cash flow last year, growing significantly on $1.8 billion year before. And then when it comes to the valuation, this surprised me when I pulled it up today preparing for this, to see it basically at the median of 27 times free cash flow is really interesting. There has been something of a correction in the share price in the last few months. It was otherwise at record highs, but now this is beginning to look like great value back to the average valuation. Now of course this isn't a recommendation. Nothing that I've discussed here today is intended as financial advice. We're all grown-ups. I'm sharing this with you for educational purposes only. You can see the performance. Whilst again, past performance is no guarantee of future results, there's clearly a reason why a stock would do 5x over the general market, and it's this fundamental edge. And I know that's just one stock, but it's as simple as asking my bot to give me the top 20 stocks and you have, dare I say, almost a ready-made portfolio for further research. That's how easy it is. Now, I have blurred these out, but you can get a handful of them on my watchlist. Like I said, there's a link in the description to that, which will then show you how and why the companies on my watchlist have done this. It's logical that the best businesses should see above-average returns. Now let's move on to the second pillar. Portfolio construction. This, contrary to popular wisdom, is actually about not diversifying. It's about concentrating your bets in only a handful of the very best positions, things that you truly understand and have conviction in, and therefore you can hold through, well, come what may. There's a good quote here by Stan Druckenmiller in an interview which said that's exactly what he likes to do. He says, actually, do put all of your eggs in one basket and then watch the basket very carefully, because the majority of your returns are only going to come from maybe 2 or 3 big winners every year. And the problem is that as you begin to add more and more positions, not only are you adding incrementally worse bets, but you're diluting your best bets in the process. And yeah, you just end up in a mess where you've diversified away from your best ideas. This bit of research as well backs up— it's by the Journal of Economics— and it says that in order to outperform, if you're running a concentrated strategy like we just seen, you need to hold for a minimum of 2 years. And if you do so, the outperformance they found per year was 2%. So once again, we can chalk up another potential 2% edge here through portfolio construction. 15 to 20 companies is enough. Now the third pillar is our time horizon. This provides our final source of edge. You'll no doubt have seen this chart before, which explains why market timing is a big mistake. If you miss out on just the 10 best days, over a 20-year period, your return would be less than half of otherwise buying and holding the S&P 500. So this goes to show once again that it's about time in the market rather than timing the market. The study by MFS also shows how short-term edge has been competed away. This is a reason why you don't make any money trying to day trade. So opportunity exists on the right-hand side of this chart. So we're looking over multiple years. Ideally, the longer the better, 5 years plus. And the reason why I'm able to commit to a longer-term time horizon and hold through these periods is that going into a contraction and perhaps even a slowdown or full-blown recession, quality tends to be amongst the best performing styles. So it's capable of making money in normal times and performing pretty well, and during contractions and slowdowns, it massively outperforms other styles historically. So the longer your horizon, the greater our edge. You should look to stay invested during slowdowns, and once again, that should deliver you a 2% edge according to the research. Now, of course, the future could vary, but this is based on the data that's been collected by research, which I believe to be reliable. When we stack these sources of edge over the market return, which historically has been 10.5%, a 2% combined contribution seems very, very conservative. So let me now walk you through how you can get to that million-dollar retirement horizon, that 7-figure portfolio, using what we've just seen, the 3 pillars, based on just a 2% edge overall. So you can find this returns calculator on my website. I'll again leave a link in the description to it, and it shows you Based on the amount that you're going to save, let's assume that you've got £50k initially and you're making no contributions thereafter. With advisor fees, your portfolio would only grow to £270k after inflation. Using an index ETF, and this doesn't include platform fees, it would rise to only £600k. But with that 2% edge factored in, and of course eliminating the fees, it would get you to nearly £1.2 million in real terms. So that's if you have 37 years to retirement, so if you're 30 years old. But what if, I don't know, let's say you've got 27 years, if you're watching this at 40, or maybe you're in your mid-30s and you're planning on retiring a bit earlier? Well, £50,000 is not going to get us there in any scenario. So what we need to do is either have more money to invest initially, or see us make a contribution of £500 a month. Which based on estimates where you should be contributing apparently half your age in percentage terms as a rule of thumb, that would get you there. £50K, £500 a month, 27 years. And again, this is based on the edges that I've just shown you with the 3 pillars. And that's exactly how you're going to get to retirement with a 7-figure portfolio and then avoid the mistakes of the 4% rule, which I showed you in the beginning of this video. If you've enjoyed this one, then watch this video next, which is appearing sometime now. Now. Thank you, YouTube, which the algorithm thinks you're gonna love. And if you don't, well, just send me an email and I'll give you a full refund. Might go and pick up a few hours at B&Q, a bit bored this weekend. See you in the next one.