Avison Young Q3 Tri-State Investment Sales State of the Market
Recorded Oct 2025 panel led by James Nelson (Head of US Investment Sales, Avison Young) reviewing Q3 2025 New York City tri-state investment-sales market. Key takeaways: Q3 2025 was a strong quarter (best third quarter post-COVID) driven by large office trades (notably 590 Madison, the first >$1B outright office sale since 2022), 11 transactions >$100M, and a year-to-date pace (~$13.9B YTD) outpacing 2024. Transaction counts and dollar volume rose across multiple asset classes (office, multifamily, retail, development, conversions). Conversions have accelerated (16.7% of office transactions, 27% of square footage sold). Capital markets volatility has moderated, lenders and private credit are active, and lower 10-year yields & expected Fed cuts are supporting increased deal activity. Foreign and institutional buyers re-entering, with notable Japanese buyer activity in multifamily.
Okay. Welcome, everyone. I already see we have a couple dozen people on the line. That is great to see. A lot of prompt people on the dime.
Tom Coughlin would be very impressed.
Yes. Hey, Scott. Great to see you.
You too.
Okay. Right. Someone is taking. Yeah.
Is that all right? I don't know either.
Yeah. I mean, again. Hey, Eddie. Good to see you. Yeah. I mean, look, we're gonna have a recording of this, so, you know, people want to take notes. You know, that's fine. I mean, I think as we ask when, when people refer to this, it's, it's, you know, we appreciate when they cite, especially if it's our, our research and data, but I think that's fine. Great. We'll give it another minute. I see a lot of people coming into the room, so that's great. And I'm going to just make sure that Eric and Brandon are joining. Great. I'm going to go off camera for just one second so we can set up the, the. The deck that we'll go through. Although maybe Eric will be driving that. Okay. Welcome, everyone. I'm James Nelson, head of US Investment Sales from Avis and Young. With me, Eric Adine, who is a principal, also based here in New York, working on the US Capital Markets group. We have Scott Singer, who co heads our debt equity group. And then Brandon Polakoff, I believe will be joining shortly. Okay, so I'd like to start off by sharing with you a little bit about. There's a lot of talk about the upcoming election and maybe its impact on the market here in New York. And we had the opportunity to have Bradley Tusk in our office today to speak to us. And so I just want to relay a little bit of this conversation as I think it will be helpful to you all. For those of you who don't know Bradley, who is founder of Tusk Ventures, Tusk Philanthropies, I think most relevant to this conversation, he was Bloomberg's campaign manager and chief strategist, so has a lot of experience in government, not just here in New York, but also in Illinois. He was also. He's very active on the. In the lobbying space. He was one. One of the people responsible for bringing Uber here to New York. So that was. That was very interesting. And then I think also noteworthy is one of the causes that he champions is mobile voting. So he came to speak to our office today about the benefits of mobile voting because the commentary he's shared on not just this election, this past primary, the upcoming election, and certainly past elections is that voter Turnout has historically been very low in New York. And when you have low, when you have low voter turnout, typically, then you have much more extreme candidates who emerge. So his goal is to have all voters be able to participate in elections, not just in the generals, but the primaries. So that was what he had to talk about. But the reason why we had asked Bradley to come speak and just to share this with you all is because very early on in August, he basically shared. He wrote an article in the Atlantic saying that he believed that Madani was gonna win the election. Now, clearly, it's not over yet, but he was certainly one of the first people to kind of just say, you know, this is certainly the direction this looks like it's going, and really, at this point, to engage and urge the business community to reach out and have conversations. He has certainly done that. And so we talked about how to do that, but we also talked about some of the checks and balances of what the interplay between New York City and New York State and Albany and certainly Governor Hochul. And if you all haven't heard the interview of Governor Hochul on the Wall Street Journal podcast, I'd suggest that you listen to that, because there's definitely some specifics. And one hand, she endorsed Mamdani for mayor, but also talked about some of the things that they agree on, some of the things they disagree on. So our job here is not to take a political stance. Our job is to inform you on how. On how this is going to impact real estate values. And we're going to talk a little bit about that today. But just before we do that, and just kind of round up the comments, some of the things that Bradley also being very involved in tech and venture capital and asking him what could a Mamdani administration look like for New York? And he's very bullish on the innovation of tech. Some of the things he talked about were autonomous driving and mobility, AI to modernize city services, and even making New York City the crypto hub. So definitely a lot of, you know, for. For discussion. I, I think as we kind of talk about this upcoming election and how this is going to impact the real estate market, specifically transactional volume values. I. I did want to suggest, and, and I'll. I'll put it in the, in the. The chat, but we wrote an article probably at least about two months ago, and we did a study of what happened to real estate values and rents, for that matter, under the Bloomberg administration versus the de Blasio administration. And what was interesting is that values actually went up more substantially under Bloomberg, but rents actually went up higher under de Blasio. And one of the things that we pointed out in that white paper as well was that there are considerations such as what's happening with interest rates. And so we also looked at what were interest rates while Bloomberg was in office versus De Blasio. And so the point being that there are macro considerations that certainly play into that as well. So that might be helpful as well. But one other thing that I just looked at before, because we're about to report kind of the sales statistics in the third quarter and I always give the disclaimer that these are rear view mirror facing statistics. Right? Because if you think about it, deals that closed in the third quarter were, were likely signed and negotiated in the second quarter. Right. What is the real pulse of the market and what's taking place? It's really, you know, what are deals that are getting signed. Now, obviously, sometimes when contracts get signed, some brokers might share that with the press, Sometimes they leak to the press. I will tell you as a general practice, when we go out to market, we announce and we have a new listing and then we announce when we close it. We don't speak to when it's in contract because in our mind it's not done yet until something's done. Although I will tell you that we're on pace to close over 50 sales this year. Every single one of those sales had a hard deposit. So again, even if you could say it's a 99.9% certainty it's closing again, we just, as a policy have not disclose when deals are in contract. That being said, what I can share from you and what I wanted to look at yesterday was to look at what was our team's activity the three months before the primary and the three months after. So looking at the period from March to May, because the primary happened on June 24, and then taking a look at activity from July to September. And what's really interesting is it has been completely consistent in the sense of BOVs and contracts signed. So, you know, we're averaging, you know, close to 40 BOVs per month. That was the case March. Excuse me, brokers, opinions of values. When owners ask us what their properties are worth, we're doing roughly 40amonth from March to May. We're doing roughly 40amonth from July to September. So it's not like after this primary that everyone said, oh, you know, what's my property worth? And all of a sudden, you know, we've got Hundreds and hundreds of of requests. I mean we certainly are getting questions. But contracts signed also consistent. We average if we're doing 50 plus sales a year, we sign four or five contracts a month. That's what was taking place in March and May and that's what's happening in July, September. I think we would all be sitting here saying we've got a big problem here if there weren't contracts that were signed since the primary. Again, we are not here telling you that the primary, the upcoming mayoral election is the end all be all of the real estate market. In fact, Scott, after is going to talk a lot about the impacts of the capital markets, what's happening with rates which are in our experience a very large driver. But the one thing I will point out is we have had a pretty strong uptick in the amount of listings. Okay. So the one thing that has changed from March to May till July to September is we have more owners bringing their product to market. On one hand you could say, well all right, maybe that has to do with concerns of where New York is going. But we could also say, you know, really take the positive outlook, which is more sellers are confident that if they bring product to market that it will be well received. And I know I keep saying the last thing I'll say, but I think on this 590 Madison Avenue transaction, the first billion dollar plus office transaction we've had in quite some time, had the chance to hear Scott Rechler speak about the transaction. And I think what was really instructive there is at the time when they were bidding on this, they said that they knew they were in competition with a dozen other groups. They were willing to buy an office building in New York at over $1 billion. So you know, when you have institutions who are willing to make that bet on New York, certainly there's trickle down to, you know, the middle markets and everything in between. But that is a big vote of confidence. So again we think, and you'll see as Eric and then Brandon kind of talk about kind of the macro New York City sale trends and then talk about the each asset classes that it does seem that the market is no doubt stronger in the sense that you have more participants in the market, you have more sellers, you have more buyers. So hopefully that helps set the stage for you all. And we can definitely answer questions along the way if you want to drop them in the Q and A. But why don't I turn it over to you, Eric, you can bring up the deck and walk us through this. Thank you.
All Right. Everybody can see my screen? Hopefully.
Yes.
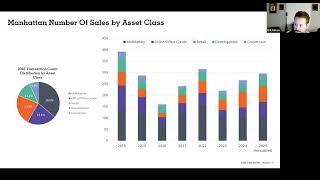
Perfect. Okay, jump into it. Q3, 2025. Very strong quarter from a dollar volume standpoint. It was the best quarter we've seen from a volume standpoint since the first quarter of 2020-2022. And it was the best third quarter that we've seen post Covid. So that's obviously a nod to a lot of the larger deals that have been getting done that James alluded to. 590 Madison. First billion dollar transaction since 2022. Obviously there's been some large recaps that have happened over the years, but this is the first true 100% interest outright sale over a billion dollars. So the third quarter was a nearly a doubling, a 99 increase from 2Q of 2025. A lot of that is happening in Manhattan and well, mostly Manhattan and somewhat in Brooklyn. There were 11 transactions that were over $100 million in the quarter and only one of them was outside of Manhattan, which was 240 Willoughby. The rest of them, so 10 transactions over $100 million. That's the first time that has happened post Covid. So it's very strong sentiment, very strong interest for these larger transactions that are getting done. Also, if you look at the breakdown across asset classes, there was at least $100 million transaction in all of the major asset classes that we'll be covering here today. Office multi retail development and conversion. And then finally, when you take a look at where we've been this year, year to date with 13, almost 14, $13.9 billion of transactions is 23% better than where we were at this point last year. So it's not just the third quarter by itself. Yes, it's a very strong quarter. But also if you look holistically at the year 25 is for certain outpacing 2024. To this point, Tom, we're on pace to do $18.6 billion, which is going to be the strongest since since 2022, which was again pre interest rate hike where a lot of the volatility began post Covid. Looking at the number of transactions right now we have 518 transactions year to date, which is the highest year to date total post Covid. The next highest was back in 2022 when there's 442. This is 31% higher than we saw last year for the same period. So again, looking on a year to date basis, we're 31% higher in the number of transactions. And Most recently the third quarter with 190 is 14% better than we saw in 2Q. Best third quarter that we've seen post Covid as well. So what this is telling us is the larger transactions obviously have the ability to move the needle much faster. You throw a billion dollar transaction into the mix, it's going to move the dollar volume much quicker. But when you can also say that the number of transactions is increasing, you can know that it's not just the institutional space, but also the middle market and the upper middle markets that are performing as well. If you look at the, the numbers that we were just covering and annualize it, you can see that both in New York City and in Manhattan, both on dollar volume and the number of sales, we're going to be above pace by anywhere from, you know, call it 10 to 25% depending on which tranche of the market that you're looking at. So we're feeling strong about that as well. Obviously last year or in typically the fourth quarter is the strongest of the year. And after a very strong third quarter, it'll be interesting to see if we can carry this momentum into the end of the year and perhaps surpass some of these annualized totals with a really strong fourth quarter. One thing that we've been talking about since doing these state of the markets for a while is looking at the 10 year average. When we first started doing this five or six years ago, the 10 year average was in excess of $36 billion, which if you look at the transaction period that that covers, it was really all of the run up post GFC when we saw incredible volumes in 14, 15, 16 and 17, you know, peaking out near $70 billion. Those numbers feel almost impossible now when you look at some of the transaction value that we've seen, we're down to now $28 billion for the New York City 10 year average. But perhaps that's the wrong way to look at it. And so we, we've, we've taken a narrower focus and looked also at the 5, which is $15.3 billion. So what that period encompasses is a lot of turmoil obviously. Covid and interest rate hike volatility and election 2019, which was out of the scope here, had the HSTPA laws as well. So New York City's been in a correcting environment now for what seems to be five or six years. And it looks like 2025. And as most especially the third quarter where we're seeing really, really great transaction value might be the beginning of the next great bull run. And so hopefully our averages look a little bit more like the 10 year than the 5 year. But it's nice to see that we've started to outpace what we've been seeing in the market recently. When you think about where the transaction volume is coming from, if you look all the way back to 18, you can see there was this huge purple section of this bar which is the office office condo portion office. Because so many of those assets are the largest, the billion dollar ones, the institutional ones, they have the ability to move the needle. They've since been out of the market in a big way in all of these post 2020 years. And most recently and well previous to that, the average had had shrunk down and you can see it was as low as 9% of the transaction volume in early 2023. We are now back to 43% of the transaction volume, which is in line with the historical norm, which is 45%. If you look at some of the other transaction or the other slugs of the market, multifamily at 15% is actually inside of the historical average of 27%. Retail and development are approximately in line. Oh sorry. Retail is approximately in line with the historical average in the low teens. Development is nearly double what we would typically see. And there was an especially large transaction that tally did at 8005th that really moved the needle there for $800 million. And conversion, we've consent, we've continued to see conversion pick up a little bit more of the, of the airspace each year, especially post 467M, the City of yes, and now most recently the Midtown south rezone. All of which will contribute to conversions picking up at a at a higher pace. If you look at where the transaction counts are coming from, multifamily is a bit down 36% compared to an average of 43. Office is about in line. So the number of office transactions has stayed fairly consistent, up only a little, a couple percentage points. But it's really the size of them that is making the difference. And then if you look at retail development and conversion, they're all approximately 1 to 2% within their historical average of the slugs. So speaking of averages and medians here we tend to really like to look at the median sale price as a good litmus test as far as where and how much capital is pouring into the marketplace. Because we saw a nearly halving of the average and median deal size coming out of this, this interest rate hike environment that happened, you know, second half of 2022 until most recently and the volatility is really experienced more so on the Average side. So you can see back in early 2022 was the last time that we saw an average deal size for the city for Manhattan rather above $60 million. And those 11 transactions over $100 million that I had spoke about earlier are definitely the beginning of the average sale price in the city increasing. We have seen a slight increase in the median as well, but it's really the average that's been pushed up most significantly when you look at the seller profiles of who's transacting in the city. I think the thing that jumps out to me in this very dense chart here is looking at the institutional participation on the sell side. Right. So if you look at post Covid 21, 22, 23, they were in the high teens there from 17 to call it almost 20% of the inst of the seller composition. And then you saw an increase in 2024 and now in 2025 up into the, you know, call it 10% greater than it was before. And I think a lot of that is based on the stability that's re entered the marketplace and their understanding that there's actually going to be a buy side of, of this equation as well. If there's not a marketplace, there's no real sense in bringing an institutional deal out into the market. And as James was talking about 590 where there was a bid sheet at least 12 bidders long, institutional sellers are going to feel more comfortable now into the future as those institutional quality assets also will be met with institutional quality buyers. So you can see on the buy side there's been a 10% increase in the institutional space as well. Private capital has been first movers in this, this recovery and still continues to be a strong component of it. But I'd say the biggest, most noteworthy change here has been the institutional capital. And with that we're going to jump into some multi family trends with Brandon.
Sure. Yeah.
I think the, the main thing here is you can see the number of sales has picked up along with the dollar volume. So I think the main takeaway here is you're also seeing though like cap rate expansion. So what we're seeing on our end is the willingness of sellers to accept higher cap rates the buyers are comfortable executing today. So you're seeing an uptick in sales cap rates on the higher end relative to the past and then the price per foot also, you know, on the relatively low end. So we can go to the next slide. So 560 West 43rd, JP Morgan bought this. What was interesting was actually a 4.6 cap, fully got renovated. You know, swimming pool, media room, sauna, gym. The, you know, this is 418 units. 100% fair market. Really. You're just betting on rent growth due to limited supply. 240 more Willoughby Street. This was purchased, it was part of a ground lease. It was 554 foot. So it was a 99 year lease. New construction, building. They're going to stabilize at lease up at like a six and a half gap on the abated taxes. So again, you know, 554 foot and that's a new 428. So it'll be a 7030 building and then the next one would be 146 South 4th new construction as well. This one was 764 foot. You're seeing a lot more of these trades. These are expired. This is an expiring 428 deal. There's two years left on the abatement. So they're going in at a 5.75 cap. And then the assumption is once the abatement burns and those units go to market, they'll go in, renovate lobby amenities, apartments to increase those rents. Development, which we've touched on. So you know, we could tell you anecdotally there's been a major uptick in demand for development sites. You know, demand is really stimulated by how people are predicting the future to look like. And I think people are feeling pretty positive. So you know, for luxury condo sites and strong rental sites, we're seeing a big uptick and obviously new abotment program under you know, 421A or whatever you want to call it today that's definitely got 45x, you know, is going to help with development out in the burrows as well.
Yeah, we've seen some really strong pricing for our sites in the city at over a thousand a foot and over 1200 a foot for two different sites on the Upper east side. So definitely agree with you that the location, you know, Manhattan sites are obviously mostly condo and the prime, the more prime the better. And in the boroughs you're just not seeing those development sites over 100,000 square feet. Unless it's sites that can be broken up into five or six 90 to 99 unit buildings. And that's just developers responding to the incentives that are put in front of them. So if you look at the total buildable square footage in Manhattan and the same story will play true in New York City as a whole, which we'll take a look at on the next slide, is just the Total amount of development is still down. So the number of permits here, slight uptick, 23 to 24 and then 24 to 25. You have a pretty big increase here going from 14 to 26. A lot of that is going to be one capital, a affordable project. Projects that are happening at great scale further out into the boroughs and then sites that are, you know, many, many, many 99 unit projects that are happening.
Well, yeah. And the 23, 24 numbers, those that just reflects when there wasn't an abatement program in place and why you'd see such low filings. 800 Fifth, we touched on high end luxury condos. This site was purchased at almost 2900 a buildable. So you're going to need to sell out condos, let's say north of 10,000 a foot. But look, it's, it's arguably one of the best residential corners in the city. And if someone's going to pull it off, I think Naftali can do it. The other two sites, so exterior street, that's in the Bronx, that was 150 a foot. It's going to be large scale, affordable project. And then 962, 972 Franklin Avenue, Crown Heights, similarly, that's 187 a foot. It'll be another, you know, 485X large scale site. 60s 43rd. So this was Van Barten purchased from immigrant, just under 400, just over 400 a foot for a residential conversion next to Grand Central, 1011 First Avenue. This was Van Barton purchasing from Archdiocese of New York who moved their headquarters near St. Patrick's Cathedral. That was in the mid-200s a foot for residential conversion. 809 Madison Avenue, as I joked earlier, was sold by the best investment sales team in the world. It was also sold by us. So that was 1250 a foot for a conversion to Scotch Nay and Harry Macklow. They also assembled some landmarks air rights, some neighboring air rights. They got LPC approval for a little bit of a pop up on the roof, the southeast corner of 68th and Madison. So they're going to be doing condos there.
Speaking of conversions and the pace of them. So we've been tracking every office building trade since COVID So talk about the beginning of 2020. And what we've been doing is tracking the breakdown of which ones are office that stay as office, which ones are purchased by users and which ones are going to be slated for conversion. And obviously the amount of conversions has really picked up in recent years in response to a number of things, including the housing crisis vacancy rate on apartments sub 2% and then some of the incentive side of things like the city of yes, zoning, Midtown south zoning and the 467 tax abatement most pointedly probably so. Conversions account for 16.7% of the transactions that have happened, but 27% of the total square footage sold. So a lot of the larger buildings, obviously not your class A590 Madisons of the world, but larger format, your immigrant savings, your 1011 first have size buildings where you can fit 4 to 600 units in a conversion seem to be the ones that are most ripe for those conversions averaging 267 square feet per. Now if you look at the office sales volume per year, conversions really entered in a big way over the last two years in 24 and 25. Now what will be interesting to see is as the office leasing market, which we won't, won't present any stats on that, but as the office leasing has had its best year since, I want to say I think it was like 2006. Depending on the stats that you're looking at. Will will a lot of these conversions be taken off the table as the office leasing volume has picked up and then the easier path forward it might be just to keep it as an office building to respond to that leasing volume. When you think about the pricing for the different tranches that we've, we've tracked here. Yes, the top and the bottom ends of these arrows show some pretty exceptional ranges. You know, with the high end there, 4, 500 a square foot which was the Bloomberg's purchase on the Upper east side from RFR or looking at the conversions, we just sold one for over $1200 a square foot in the Upper east side. But on average the conversion pricing needs to be lower than the conventional, which is the middle block here. And then the users have the widest range because it's very specific to what they need and less so based on, you know, some return fundamental or metric that they're trying to hit, breakdown of the sales, where they're happening and we always thought this was interesting to look at is if you have a building that's 90 to 100% occupied or, or 0 to 10%, it's pretty clear on what you're going to be doing with those assets. It's either office to stay as office or if it's nearly vacant, it's probably right for one of two business plans. Sell to an end user or convert it. It's all those occupancies in the middle and especially that lower end of the spectrum here where the path forward becomes a little fuzzier because you don't have yet enough vacancy to paint a clear path for conversion or for somebody to step into it in a meaningful way. And it's not least enough where you, you realize there's a clear path to full occupancy or stabilization which also comes with a lot of cost and by way of TI's, LC's base building and such. So that's the state of conversions as we see it.
So retail sales, it's been generally, you know, it was in a pretty good place. It's been relatively flat. We haven't really seen, you know, people always ask are we seeing downward pressure on, on cap rates. It's, it's really been more or less the same. With that being said, obviously there's been some large scale trades, you know, but in general, again, kind of like the other asset classes, pricing more or less the same, maybe a little bit down. And then number of sales and dollar volume slightly up. 529 Broadway. That, that was the sale to Ikea from Jeff Sutton. This was. Yeah, I mean it's a user purchase. So they're going to take over the whole building. Cooper Avenue in Queens. So that was purchased by Ashkenazi. It's a big shopping plaza out in Glendale. It was 80% leased if I remember correctly. So there's like 40,000 square feet vacant. They bought that at 193 a foot. And then finally you have 300 West 43rd and 303 West 42nd Street. This was actually in for all intensive purposes, a flip. So this was purchased by a group of local investors almost, I would say like a, a year ago for $48 million. So they turned around without doing anything to it and sold it to a group, Jin Capital. So they're going to be doing a food and beverage concept upstairs in the vacant office space that exists there. The ground floor is 711 Chick Fil, a smash Burger and Little Italy pizza. Yeah, and that ends up being $430 a foot across the board. Office sales, you know, we've kind of touched on it. There's been some very, you know, large scale sales that have definitely helped the dollar volume. As you can see, 169% increase. That was really triggered by the, the 590 Madison Avenue trade at over a billion dollars, which was the largest sale in Manhattan in over three years. Number of sales again, you know, 10%. Same thing with price per foot. It's, that's kind of Margin for error. So not dramatically different than what we saw, but definitely look up from 24, which is good. So 590 Madison, that's the one we referenced. That was a 5.3 cap. So this was purchased by RXR and Elliott Investments. 1080 a foot. They got 65% leverage. So a 650 million dollar loan, you know, it has LVMH, Apollo American securities, you know, some, so some pretty name brand tenants. 1177 Sixth Ave. So this was purchased by Beacon Capital Partners from Silverstein Partners or sorry, Silverstein Properties. 627 a foot was almost a million square feet. 47 story building, 86% lease. That's pretty much the, the gist there. 611 Fifth Avenue. So this one was Vornado, bought it from Coen brothers. This was 570 a foot. And this was the office tower portion of the building which is 36 stories. And also I should note it was class B. And they're going to, you know, upgrade the building to class A. Yeah, at.
One point I think they were talking about converting that tower and I don't think that's the plan anymore. Which might be a nod to just the resurgence of the leasing office. Office. Leasing AI is actually their office was in that building almost 10 years ago now at this point.
Yep. So I think, you know, what do I see here? It's, you see pricing has slightly come down, in some cases slightly gone up on the retail side at least. But you're seeing just a huge increase in the dot IN the sales volume which is really ultimately the, when you see, when you see the market start to surge, it's like a herd mentality. The first thing that happens is the volume increases and then the pricing follows. So we saw the same thing end of 21 into 22. So the hope is obviously the volumes definitely picked up. I mean we can tell you we signed a contract yesterday for a development site. We signed a contract about an hour ago for an apartment building that's going to close in eight days. We closed on a 76 million dollar sale yesterday. Like every week we're signing a lot. We closed on another property actually in Brooklyn too. So we're, we're signing a lot of contracts right now. We're closing a lot of deals. It's, it's definitely fun again in, in the business. So that's always a good sign. Usually pricing follows.
I think the flywheel has started turning. Every time one of these transactions happens, you're getting somebody getting their money back and ready to put it right back out and it'll increase that competition. So I think the boat's leaving harbor and the year ahead should be great. James, you want to finish these trends up and hand it over to Scott? Sure.
So I think we definitely talked about the, the potential impact of the mayoral election at the beginning. Although that reminds me, I need to drop that article in the chat. I will do that. You know, look, these large scale office transactions are really what's going to move the needle here to kind of get us back. And, and I don't know if we're going to keep using the 10 year average. I like the fact that we did the five year average and the important thing is we are improving. But it is, if you look at how New York is compared to other markets, the fact is that we have the tightest availability rate at 16% that that's been contracting. I mean, if you look at these other markets, you know, they're, they're north of 20%. So New York has a very healthy market from an office standpoint. Certainly there's been a flight to quality with the class A buildings. I think that's also, you know, gave Boston Properties the confidence to go vertical with a speculative office building at 343 Madison, about 800,000ft. So that's, that's positive news. But you know, once, once the trophy and A space fills up, you're going to definitely get that trickle down to the Class B. And then the other thing we've seen is that we've tracked that close to 4% of the office stock here in Manhattan is being planned for residential conversion. That's also going to help because that's going to reduce the denominator. We'll talk about the impact of these rate cuts. But you know, certainly after getting a cut and seeing where the 10 year treasury is this week, I mean, I think that has gotten a lot of buyers and sellers for that matter, off the sidelines. So we'll see. I know Scott always brings his crystal ball with him. So he'll, he'll let us know how many more rate cuts we can expect exactly the next year.
That's what I, that's what I was hoping.
How's that for a handoff?
That's great. Thank you.
Right, sure. Yeah.
Exactly. Well, yeah, yep. Glad to be on here. It's interesting. I, I think Brandon, you said the fun is back. That's, that is right in the debt market as well. Now, you know, last quarter, my, I think my remarks were, were called volatility is the new Normal. And we had to change our slides both the night before our presentation and then in the, in the morning because there had been a 30 or 40 basis point swing in the treasury rate overnight. So in this case Eric, if you go yeah, it's volatility has moderated in the treasury market and that's a very big change. And I think that a lot of the sales volume can than the availability of debt and the capability of owners. You know it seems to forecast what their rate is likely to be within a range as they're pursuing acquisitions now. And that's a, that's a welcome change that that over the last quarter especially the, the expectation. Why is it fun? There's a higher level of expectation of success now. We you get hired, you get in the market, you get offers and you get closed. And there's a different level of productivity now that is not always normal but starting to feel normal again and again helps drive transaction volume. And I think there are a number of factors when we look at wire owners borrowing now much of it is taking is going back on offense. Some of it is still defensive, some of it is organic. Maturities are coming and there are lots of loan maturities in you know over this period of time there's less appetite among lenders to extend and there's just pure pent up demand funds coming back as Eric said through sales or funds that are getting closer to the end of the life when they, they can be invested. So all of those are driving transaction volume on the debt side. Eric, if you go to the next slide the we're always looking backwards a bit at rates. And this is a slide that's the second half of something we put up on the last one. And what we were focused on on the, on the last one was let's say the left side and the middle. This is a slide going back to the beginning of 2024. 4. The orange line is the highest yield that the 10 year treasury hit in each month since January of 2024. And the blue line is the lowest that it hit each month. And what we're looking at is if you look From January of 24 through April there's a 60 basis point swing between the high and the low. And there were you know, months like April of 24 where, where you had almost that much just in that month. And then if you look from From September of 24 to the end of the year there's 110 basis point Delta in the, in that, in that rate. And it just it every month it felt like there were wild swings. Well if you take April or May of this year, the right side of the graph, there's far less distinction not only within each month after April and April included Liberation Day, but if you look at these last several months we've been much closer within each month we've been much, we've been very much trade bound between four and mostly four and a quarter and now we're seeing some meaningful reductions. You know just this week we rate locked a deal yesterday at a 395 treasury for the 10 year. So it's Eric, if you go next we're so, so this is a 25 year look. This goes back to January of 2000. The green line is LIBOR and SOFR. So that's essentially tracking the Fed funds rate. That's the short term rate and blue and orange are 5 and 10 year treasuries. So as I said before the, the short term rate is primarily policy driven. It has these massive quick ups and downs and what I notice on here is that policy driven increases when they hit their peak. It's generally hard politically to maintain that those high short term rates. And so in the dot com you had a quick top just before the gfc, another relatively quick top just before COVID you didn't even really reach the top. And then there was a need to open up the spigot of capital. And if you simply look at this chart in these 25 years it's easy to get excited with an expectation that well are we now on the, really on the way down. If you take a longer term view on the next slide we're looking at the 10 year treasury over the last going back to 1962. And you know on this slide we're still very much in the lower portion of where rates have been. That orange line across the middle is the average 10 year treasury rate since 1962. That's a little under 6%. The green dotted line is my career since 1994. That average and that you know that obviously knocks out the super high rates of the late 70s early 80s. That's still just under 4% almost exactly where we are today. So the, what is the likelihood of treasury rates dropping dramatically from here? The, the, the average delta between 10 year treasury rates and the Fed funds or so for Libor rate has been about 150 basis points. So I think if we go to the next it's the forward curve. So this is the forward curve as of today. The yellow line is the one month term SOFR and Then purple and Blue are the 5 and 10 year Treasury. And so the traders who trade on that relationship between short and long term rates are certainly expecting several rate cuts over the course of the next nine, 10 months down to you know, bringing the sofa down another 100 basis points and then you know, relatively gradually gradually increasing over time and in the face of that expected 100 basis point drop in the short term rate, no reduction in treasuries. So now how much should we rely on this? Eric, if you go to the next curve we're going to do the same thing. This is as of our is when we did our last presentation. This is May of 2025 that we're looking at now. The curves look the same. There was an expectation of drop in the short term rate and and at that point there was an expectation of flat and then increasing Treasuries. Well but that was with a 10 year treasury at 440 and today we sit at 395. So one of the things that someone asked a question today, how corrected or incorrect is the forward curve over time and we're going to drop that into copilot and we'll talk about that on the, on the next one. My guess is that looking farther out it is more correct than it is in in any short duration period. So I think from our perspective, you know what, why has it gotten more fun? I think the there is that need and desire to transact which has that is on both the borrowing side but also on the lending side. And so what we're seeing in every deal that we take out now is substantial competition on and that includes construction loans, both recourse and non recourse. It's permanent loans on multi family. Our rate lock yesterday was just barely over 5% for a 10 year term. That's as low as we've done in a long time. It is for deals with some risk there's probably even more competition and more and more money available. There's so much money in the what we used to call the debt fund space and now is private credit. The I heard a stat the other day that there are 400 debt funds out seeking to raise capital for the next fund now. So just a massive amount of liquidity that has maintained some discipline. And so you know, very secure deals can get quite attractive rates and very challenged deals can find liquidity but with with higher returns. So you know it feels to us like a fairly healthy market at the moment and one where it is possible to take almost any deal to market and see substantial Competition in a borrower's favorite.
Awesome. That was super helpful and appreciate the feedback and perspective there. I will see if we have any questions. I'm looking at this in the chat. I know we did have a comment before on the, the mobile voting but I think that probably be better directed to Bradley if you want to reach out and interface with him. I know he's, he's passionate about that. So I will say Brandon, I know we talked about the institutional pickup and activity, but just anecdotally about foreign investment, I know that's always a hot topic. I think last year and I've, I've lost track if, if we've been counting but I know at one point last year we had done a dozen transactions with Japanese buyers for multifamily. I know that's a pretty specific requirement, but I'm just curious, are we, are you still seeing that from specifically in the multi family sector?
Yeah, I think I had mentioned we signed a contract about an hour ago that was a Japanese buyer closing all cash on October 30th. We were under contract. I mean I can just quickly run through some of these on like the multi side. 1031, 1031, Japanese, Japanese, Vietnamese, Japanese and then of the contracts out, some of them Japanese, Israeli, 1031, Japanese, Korean, German. So yeah.
And how, how are we finding these, these buyers? I mean are they just showing up to your doorstep or. Because if I'm not mistaken these are all individuals. And I know at least with the Japanese purchases last year, I, I, out of a dozen transactions, I don't think any of them were repeat buyers, which is amazing that they were all individuals. I mean, I, I know. So maybe talk about how, how that is.
Yeah, a lot of it's the, it's a lot of hand holding and I know it sounds very simple but just being like kind to people. So you know, you build the network with a lot of these advisors that work with a lot of these Japanese groups. So when you have opportunities, they're excited to work with you and try to get something done together. And then on the 1031 side, obviously, you know, we're tracking so many of these and trying to you know, thread needles where we can. And I think just knowing what certain people like to buy and what they want to, where we have opportunities. I think, you know, we also have a lot of products so there's the ability to cross sell a lot. So maybe someone doesn't like one thing but you can move them into something else. But even on the development side, I Mean, you know, we just closed that sale yesterday and that was with a developer from China. So, you know, a lot of the LP money too, on the development stuff comes from overseas. So we deal with the developer operators, but a lot of their equity is often coming from overseas.
So you guys need the new AirPods that translate.
I know, I know. You know, we, we were joking, Ryan. And our team was starting to take Japanese classes, try to get a leg up there. But now look, it's, I think the follow up, expanding the network, you know, making sure that you leave no stone unturned and not just relying on putting it on a website and really working a deal, I think is, is the big difference. But honestly, the hardest part today is getting from point A to point B once you have an offer is, is the diligence. I mean, deals right now are definitely, they're getting done at a large rate, but I would say everything is scrutinized even more than it ever was. So you got to work through it again. I think that also has to do with the market. Right. So buyers tend to have a little bit more leverage and they can do that. I think, you know, it goes back and forth. That just happens to be today's world and tomorrow it could be different.
It's interesting because we're seeing, I mean, when we look at, when I look at the deals that we're signing up now, the lenders are regional bank, American Insurance Company.
Yeah.
CMBS Private Credit, you know, long time locally active. So it's been a lot of traditional sources who are, who are winning deals. It's, it's, it's. So now you're, I think you're selling to some American owners as well.
Yeah.
So what I tend to find is in, in the, in the markets, those type of, the local groups, they come out when covet hits.
Right.
They're cash heavy. They see the opportunity and they, they strike. When pricing starts to go up a little bit and run away from them. That's when you see the local group start to pull back a little bit and start to sell more. And then you see the new buyers coming in and paying that quote, unquote premium.
So just, you all know, I just dropped in the chat that article that had the study on what happened to real estate values and rents under Bloomberg versus De Blasio. So maybe that'll be interesting. If asked, you know, how much impact does a mayor have on sales values? The other article that we just put out there, and I've got to say now with, with Eric and My national roles and perspectives. I think it's really helpful to see how New York is doing comparatively to other markets. So the second article that I put in there for you is what is driving office to residential conversions? And I think what we're really looking at is what cities are most successful. So I'm going to just pull up one last slide and then we'll break it at one. But if you look now, these are planned potential office conversions by market. So Manhattan, as you can see is has the most square footage planned at 17 million square feet. Well, guess what? Manhattan's a 500 million square foot office market. So not surprising that, you know, New York has the most conversions. But look at the percentage of office that's planned for resi. 3.4%. Okay, we're doing a pretty good job. We're doing, we are in line with Dallas. So DFW, you know, 7, 8 million square feet plan for conversion. But again as a percentage of their office stock, 3.4%. But look at Northern Virginia, 8.7% of their office stock is being converted. Now we can sit here and talk about, oh, which, which of these markets have, you know, the right types of office buildings that lend themselves to conversions. But we know that Northern Virginia has really fast tracked zoning approvals along with some, some tax incentives. DC2, 4.7% of their office stock being converted. They have a 15 year abatement. Now we have a 35 year abatement as most of you would know with the 467M. And again, I think that's, you know, a good reason why we're having some success here. So I think sometimes it's just helpful to also look at how New York is faring relative to other markets out there. So that, that's on that article that we sent the link to as well. So with that I think think hopefully that was helpful to you all. We appreciate you all joining us today and we'll send out a copy of this deck as well. So you have it. We, we look forward to being in touch with you. Thank you.
Thanks everybody.