Q3 2023 State of the Market
A Q3 2023 webinar presenting a New York City real estate market report. Speakers (James Nelson, Scott, and Brandon Polakoff) review Q3 closed sales (> $5M, retail >$1.5M), across multifamily, retail, office, land and development, discuss impacts from recent regional bank failures, capital markets, foreign buyers, cap rates, and lending activity; they conclude transactions slowed in Q3 but capital/lenders remain active and opportunities exist in multifamily value-add, retail high-street, and select office/development plays.
Hi everybody.
Sorry for the technical difficulties. Listen, James is going to jump into, into this discussion, but I wanted to say for all of us that our hearts and minds are very much consumed with the devastation caused by the Hamas terrorists in Israel. We've just gotten out of a conversation with a friend whose daughter was, had planned to be at that meeting music festival and she lost 20 friends dead and others abducted and her boyfriend's on the way to the front. So this is, this is real and live for all of us and it's very much on our minds. We are going to move over into a presentation and we'll have some validity, but none of us want to ignore what the bigger things that are happening.
In the world now.
So, James, it's tough for me to hand it over to you after that.
But no, thank you, Scott. I think it was really important to say and certainly on all of our minds. So yeah, yeah. And yes, a tough transition, but we will jump into the state of the market. Scott is going to cover debt, equity. He's going to try to jump on from his desk so where he has his notes prepared. And we have with us Brandon Polakoff, who most of you, if not all of you know, certainly he'll be talking about some of the multifamily trends that we're seeing out there. But let's go ahead and jump into the deck. Okay. And I see we do have one hand up, maybe that was asking whether or not we were getting the show on the road. But yes, this is our third quarter report. I always give the disclaimer, not really the disclaimer, but more the explanation of how our data is presented in that this is really a rear view mirror indicator. So these are the sales that actually closed in the third quarter. But of course, many of these sales were negotiated, signed in the second quarter, maybe even the first quarter. Certainly still a lot of uncertainty at that time as far as with rates continuing to rise. We'll wait to hear from Scott and whether or not he thinks that we should be more certain or not. So I'll leave that part of the conversation for him. But certainly one thing that really to just preface the conversation is I think if you look at the bank failures that took place, certainly signature as well as First Republic, those closures and the lack of those lenders being in the marketplace, I think unfortunately has dampened the third quarter sales and we're starting to see some of the reactions to that. So with that we'll look at what has happened across and this is across all asset Classes. So we track the major food groups, multifamily retail, office development, land conversion and we're looking at sales that happen in New York City across. Oh great. Scott is on. Wonderful, welcome. Okay, so we're looking at sales that took place at over $5 million. Except for retail, we reach down to about a million and a half. We see a lot of these retail condos that the trade. So we make sure and pick those up. But as you can see here across the board we are looking at this point with three quarters in. Unfortunately it looks like the annualized dollar volume for sales will end up at less than $10 billion. So I think we're long past looking at that peak in the market of 2015 where there was 68 and a half billion dollars of sales. Now I think we're really more comparing to what the 10 year average which was certainly more normalized. I mean I think we can all agree that 2015 there was a set of circumstances that we will probably never, you know, see again or we're hoping that maybe we will one day but a lot of things would have to go right. But I think 30, 34, 35 billion in sales across the city is certainly more normalized and no doubt a lot of that dollar volume is driven by the office sector and these billion dollar plus sales which you'll see are going to be absent from this quarter's report. So you know, if there's any good news, you look at one point it looked like we were reaching down to the depths of 2009, the GFC. We will still surpass that I think. Thanks. You know, in large part to different circumstances for sure. Certainly more equity out there. And again these are things that Scott will, will talk about in his discussions because I know he's going to look back historically as well. But with the exception of upper Manhattan at $98 million in sales, every other borough or geography I should say that that we track and how we break this down had a decline in dollar volume when comparing to the prior four quarters. So next we're going to take a look at the number of sales. And here you see that the number of sales were on pace right now to do 469 sales across new York City. Obviously that's only about half what we would see in a typical 10 year at close to a thousand sales and once again 10% over the trailing four quarters. And upper Manhattan, the only region right now that is tracking north of of the last 4/4 activities. So now looking at just quarter over quarter we have New York City dollar volume from Q2 to Q3 dropping 21. We have Manhattan dropping 7% on number of sales. We have New York City down 12% and Manhattan again, the only green arrow on number of sales. And Brandon's going to talk about some of the trades that are happening in the multifamily space. We did see a slight uptick from 58 to 60. So unfortunately, and this is where you can all say, you know, James, if you were all listening to last quarter's state of the market, you'll remember when I said that we're in for double digit volume growth every single quarter. Because when we went from 1q to 2q, the numbers were a lot more positive. So last quarter we were talking about a 26% increase in dollar volume. We were talking a 77% increase in Manhattan as far as dollar volume when we were talking about Q1 to Q2. And again, what we really believe happened in three Q is with signature First Republic out of the market, a lot of these deals have been stalled out, challenges to close. So I think that's, that's why we are where we are. And hopefully we'll certainly regroup and get back on that upwards trajectory. But with that, Brandon, if you want to talk about what's going on in the multifamily sales market, please. Sure.
Yeah, thanks. Thanks for having me. Yeah. I'd say first off, I just wanted to echo what Scott said earlier, so thank you. And then just jumping back into multifamily sales. So I think it's really critical. I do think that if you look at the sales across 2023, it's been dominated by the multifamily mixed use space. Obviously the fundamentals are very strong. Limited supply of apartments, rents are still going up. You speak with owners every day and they're still seeing, you know, their rents increase, which is crazy. But it's happening. It's a supply issue. As far as dollar volume, that's where you see the biggest drop off. And that's tied to, you know, the larger the sale, the more debt required, which makes it more challenging as, as treasury rates have, have gone up and so have borrowing rates. So really was only a small drop off in the number of sales, a small increase in cap rates and a small drop off on price per foot. And you know, we can say I, I ran through every multi family sale from this past past quarter and I would say my, my big takeaway was there's just a lot of outliers still in the market. Right. So this is Still Manhattan. It's still where people want to park their capital. So just to give you all the numbers across users, foreign buyers, domestic high net worth buyers and 1031 buyers. Those, those that outlier buyer profile made up approximately two thirds of all the acquisitions of multifamily properties in the quarter. So you really only saw about a third of the, the sales going to local buyers. And even within that, what you generally saw where the local buyers were picking up properties that were, you know, ownership had retired or there was a partnership dispute or there was a death, you know, the other natural causes for, for a sale, not too many sales tied to over leveraged properties and needing to get rid of the asset. And I think everyone wants to always focus on that as the opportunity, but there's really other opportunities just that you see in any cycle tied to, you know, again the four Ds which are, you know, death, dispute, divorce and debt. So I think that's critical to think about. Yeah, that's, that's pretty much, and I can tell you all like anecdotally on Friday we signed three contracts with four foreign buyers that are going to be purchasing assets, all cash. We closed the sale with a foreign buyer on Friday. We have more signings this week, all with foreign buyers. And at least from, from our team, we have a lot of closings coming up in the fourth quarter. All the foreign buyers. It'll be interesting to see the rest of the market. You know, we're not as privy to what else is happening. But for our team specifically, we do have a lot of upcoming closings, more than, more than typical. We have about approximately 16 to 18 properties that'll, that'll close in the next few months. So you know, that obviously will help the numbers.
Right.
And if you look at just the averages again, I think, you know, we're at the point now and approaching a 5.22 cap. And I, I think Brandon, you know, suggested also that a lot of this are these outlier purchases. But Brandon, the question I would give to you is also tell us what goes into that cap because obviously very different if you're selling a fully regulated building versus a fair market building. Because I think a lot of people might listen and say, you know, how did you come to that 5.22 cap? Because it could be higher and then you'll see some caps that were also quite a bit lower.
Sure. I would say firstly, I do feel very strongly about our data. We spend hours and hours of time to dig up this information, to figure out numbers and we really analyze it. So that's the first thing. But it's a mix because you have finished properties that are selling potentially north of that or even value add properties. But you do have a lot of sales where the income levels were low and it's a value add strategy and there's still a path to getting to that six and a half to seven percent yield on cost. You're buying a property at a basis of 400 to $500 a foot. You know, you weren't seeing those opportunities even two years ago, a year ago. So that would justify the lower cap rates. And then candidly, it's, it's, it's a needle in a haystack. But we are still selling 5 caps, sub 5 caps to foreign buyers. And that's not a exaggeration. Happy to introduce you to the clients where, where it's happening and they're obviously happy. But those buyers do exist. But a lot of it, to your point, there's just a lot of value that can be added. So buyers are looking at it from a yield on cost standpoint instead of a going in cap rate, so to speak, they're taking bridge debt and they'll stabilize, you know, in a year or so when they finish their business plan.
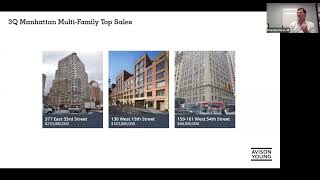
So we'll go to some of the noteworthy sales. Brandon, I don't know if you want to talk about these three traits.
Yeah. And I know we have a lot to get to, so I'll be quick. I mean, 370 70s, 33rd. Perfect example of your outlier. This property was purchased. They did an extensive renovation. NYU Grossman School of Medicine. They had the first two floors which uses like office space. They're purchasing this property the way they purchased it. They're going to utilize their commercial spaces that they already have and then they're going to house faculty, staff and trainees in the residential units. So again, not as cap rate sensitive as your typical buyer. They are just looking at, you know, the utility that they get from occupying the space. I'll let you go through 1:30 West 15th, which we know about, and then 1:59, 161 West 54th Street. This is actually a foreign buyer in nature. The money's from overseas. Again, this one was a, we actually just sold this buyer. Two properties were under contract to sell them another four properties. He is looking at his money overseas, family money. And it's a, it's a long term investment. And the basis in this property was sub $500 a foot for a corner elevator building that was approximately 75% fair market most. I think four of the five retail spaces were delivered vacant but he's okay with that. The biggest challenge with this property I would say was there was a union, union payroll that was like five hundred and fifty thousand dollars a year which is extremely high. But the buyers going in. I actually spoke to him last week. He's already renovated three or four of the apartments and he's seeing great rents in response. So again bought this at a low cap rate, low basis upside and feels good about it as a long term hold.
Great, thank you. And 15th street was purchased by an institutional buyer. It was really about the vintage of the building in that also the 421A was expiring. So the buyer plans to extend the 421A to extend that, that tax benefit for another 15 years. This also was in that 4 cap range. But certainly the buyer is going to look to make improvements on, on existing rents there. So that's an overview of the top multifamily sales. We're now going to look at some of the land sales. Very few of them, only 3 of those trades average now is 322 buildable, which is certainly on the lower side as we look at those sales and what we're seeing out there, corner second Avenue, this is on the Upper east side, there's some regulated buildings. This was a REIT AIMCO that had sold off some of these properties and this was, this will be for condo development. We were involved in the ground lease on 3rd Avenue on the corner of 23rd Street. And what's interesting here is that there was not a 421A. This is probably the exception in that we would say in large part that rental development has come to a screeching halt with the expiration of the 421a. So but in this case the location and the developer's confidence in the potential rental market or might be able to explore potentially a co op conversion. We've seen a couple of those where you're selling off of a ground lease and then the corner of York and East 81st Street. Very active condo developer in Manhattan. So we are seeing demand for these boutique condominium developments. So in the case of York and 81st street we're talking about a project of only about 31,000 buildable feet. The question of course is will they assemble more air rights, inclusionary air rights and expand beyond that. The site at 1691 Second Avenue was 7 or is 77,000 buildable? The base far. So next we'll go to retail Sales. So retail has definitely been one of the, has had the largest swings in value. So you can see it was actually a strong quarter for retail sales. 16 trades price per foot is 16 $32 a foot. But as, as you can see, one of the retail sales on its own can, can boost the entire average. So but significant dollar volume at 330 million. So we'll look at some of those, those trades that are accounting for that which is here on the corner at 30 East 65th Street. So here Dyson, this is I believe his third purchase after buying a retail store in Soho. Here buys the corner. Retail pays a huge price at over $12,000 a foot. So interesting that the highest residential sale went to an end user. Now the highest retail sale going to a user. We're going to look at office next. But here, Broadway, this was a portfolio that was sold by Vornado, includes not only two retail condos on Broadway, two retail buildings on Spring street, as well as a retail condo with the north face at 510 fifth. And once again the Rubin brothers, who've been very active buyers of high street retail, buy this. And then a smaller ground floor retail condo on second Avenue again sold to an end user. So we're seeing a lot of user demand for this kind of product. Meanwhile with office sales, and this is really remarkable that over 7 sales there was only $208 million of total sales proceeds. That means the average office building that's trading is under $30 million at least for this quarter. So you know, the question is again, what about some of these larger, larger office trades? And we have seen some of them. We talked about 529 Fifth Avenue where some of these larger nine figure transactions are working their way through. But right now it's been more boutique type properties. So if you look at 575 8th Avenue, this was a building that still had some significant vacancy. Well I guess relatively speaking. So in this case there was about 30% vacancy that I think certainly contributed this. And this was here in the garment center to 265,000 square foot building. But you have over 280 office tenants. So again, 65% occupied at closing. So Kaufman purchases, purchases along with Beacon Capital from Sierra. And then looking at 110 West 32nd street, this was a foreclosure closure sale that was purchased by a Korean end user group, 6 East 45th Street. This is really about the price per foot. In fact, both of these buildings, all these within only 5, 10% of pricing. And this is pretty remarkable. Corner of 6th Avenue, excuse me, trading at $349 a foot, whereas 110 W 32nd St, $362 a foot and 6 E 45th St, even though this was predominantly occupied, still trades at 338 a foot. When I spoke to the buyer, this, who closed Cash, said it was all about the basis. So I think that was pretty interesting that, you know, a lot of these office deals, especially if they have, certainly when they have vacancy, it's really more about the price per foot as opposed to the cap rate. So we look at some historical pricing. Again, retail has been the most volatile and certainly dropped significantly from 21 to 22, but it's certainly on its way back. So it always helps when you have a retail sale. Again, if I didn't say it for that Dyson Trade was over $12,000 a foot. So that certainly helps when you put that into the average. But meanwhile, office, and a lot of this has to do with the class of office. So there weren't any class A office buildings that traded this quarter, which might be contributing to the drop to $640 a foot year to date. This quarter certainly brought down that average. And then you look at multifamily, that even though cap rates have expanded, the increase in rents and year over year, the Miller, Miller Samuels report reported 9% increase in rent. So that certainly helps. And then land sales certainly taking a dip from their, you know, $600 buildable foot average in 2018 and 2019. You look at the cap rate expansion and you can see really retail leading the way. Average caps now approaching six and a half percent. Multifamily, as we said, around five and a quarter. And office, again, there's been so few cap rates, so few fully occupied office buildings that I think, you know, the fact that this cap rate is held since 21 is a little deceptive. But the cap rates that we have observed have averaged out at four and a half percent. So with that, again, what we're thinking a lot about, and maybe this is a good setup for Scott, is looking at these bank collapses and what that did to volume and certainly a setback and trying to figure out how the capital markets can regroup and address certainly the debt that's coming due. We did see small to mid size and Brandon alluded to this, certainly cash buyers coming in in many cases. And then again, a lot of the office product that we're seeing is leading to higher vacancy. And I would have put certainly one of the top trends of this quarter would be end users stepping up taking advantage of this market to purchase. So with that, Scott, over to you.
All right, thanks, James. And yeah, I think happily, because the Fed, and while there may be complaints about them, because the Fed and the FDIC stepped in and protected all the deposits when the bank collapses happened, we have the ability now to talk about a continuing finance, continuing finance market. And it is active. What we've, you know, I listen to economists with PhDs make intelligent arguments about rates going in both directions and what we, you know, and then the pundits get on and they can make vehement forecasts about where they're going to go. I'm willing to admit that I don't know which way rates are going to go in the near term. And so what we've spent a lot of time looking at, and I'll give Jeff Morock on my team a lot of credit for helping me find and decipher it is historical context, understand what's happened before and to provide that context and help guide borrowers in making decisions. And when they are ready to move, then what we're finding in this environment is still an abundance of capital. So this is the sort of longest graph that we can find of 10 year treasuries and there has obviously been a much higher peak than where we are, than where we are today. James, if you can just, I think you're still controlling if you go to the next one for me. So this is looking at the, the per. The Pink is the 10 year treasury and the blue is one month Libor and then, and then 30 day SOFR from 1989 through the current, through the current time. And when we layer those against each other, you know, what do I see? Not as an economist but as a, but as a mortgage broker. The short term rates are primarily driven by policy. That's again the blue line. And policy is affected or affected by politics over time. And so there are, when there are the, when we see these dramatic rises and they're typically quite steep. That is generally being done as a policy measure to slow the economy. Politically slow economies are hard to maintain and different point. The policy often overshoots and so soft landings have generally been hard to accomplish leading to fairly short peaks in the short term rates and then aggressive cutting to re. To re stimulate the 10 year, the purple line, the pink line. The tenure tends to lag and it, and it goes, it does come down when the short term rates come down, but it lags. And so I don't have great expectation for wonderfully aggressive and inexpensive financing market in the, in the immediate future. James, if you go to the next one we what we've looked at here, this is a slide that we've now revised a couple times going back to April of 22 and the, and the next couple are as well. So the first question in black was, you know, should I refinance now? This is the time when Treasuries and we'll get to the next slide in a minute. The when the treasury tenure treasury had hit 287 which was the highest it had been in quite a while. And the question was, is it possible to refinance? Then we looked at it again a few months later and rates were even higher. And it became is it advisable to refinance? And now it's really, you know, how well, how am I going to refinance when rates are now most borrowing rates are in the 6.5 to 7% at the lowest. And there's this continuing question of should I think of that as a high rate or a low rate. And our last question which was about prepayment penalties is really off the table because there are almost no deals that have a meaningful prepayment penalty at this point. So James, if you flip to the next. So this is the slide that we used in April of 22 when the 10 year had hit 287 and that felt incredibly high. And yet when we looked at the average from 2006, this is the purple line at the bottom that was only in line with the average from 2006 in a really hot real estate environment to 2020 just before the massive cutting. And you know, interestingly we also were looking at that point at the orange line. So across the whole analysis we were doing, which was my whole career since 1984, one of the points I was making there was across my career the average 10 year treasury rate had been 385, which was still a fair amount higher on the next one we are now in November. James, can you hit that next one? Okay, so ironically when we did our Next presentation in November 22, the 10 year had gone up to 385, which was exactly in line with that during my career average. And again, this is not intended as I told you so because this is not and neither were the others prognostications that rates were going higher. It's rather keeping history in mind. So if we flash forward to today on the next 1 Now the 10 year treasury rate is in the 470 range. We've expanded this graph to go all the way back to 1962. And when we look at the whole graph there are a couple interesting things that come out. Across this entire 62 till today the average is about 100 basis points. James, we're seeing your whole screen here. The the across that whole since 1962 the average is still about 100 basis points higher than today's. We also then looked at how much is this skewed by the all time high period which is 1978-91. And during that real top of the market period now that's a 13 year period, the average was about 10%. When we look at the all time low period which was from the aggressive cutting in 2008 all the way through today and including the rises of the last year or so, that average was 239 so dramatically below today. So that's you know, let's say the hope. Are we going to return to what anyone whose career started during or after the financial crisis has seen? If we strip out both the green period, the high period and the purple, the low period, the average happens to be almost exactly the 5.8% the same. So what do we draw from this? It is that if you take a long term perspective, today's treasury is significantly lower than what the people with the longest careers who are in the market today have seen. So James, maybe just flip to the next to the next. So you know this is one that we've used a few times and it's, and it does go to that question of where, where are we now? You know this period in 2023 has, does look somewhat similar to the point right before rates got so high. I think you know we have a very aggressive Fed now who's trying to prevent the inflation that led to the runaway rates after, after that period of time. So what we're seeing in the market now is an abundance of capital, both debt and equity that is hard to pull out of lenders and investors pockets. It is but it is possible to do so when deals are constructed well, meaning the sizing is appropriate, the expectations, our rates are in line with today and the projects make sense in this environment. Then we are seeing bidders and we're seeing deals get done. We took an office building refinancing out to market last week. Very low leverage, very attractive, a long term owner, a fully occupied building. And we have more than a couple dozen lenders who are interested across all types. We have a significant number who aren't able to land on office now. But it was a validation of our expectations and what we've seen throughout the year that even in office there is significant appetite to put money into good deals. So you know we hope that continues. We're seeing the same thing on the development front where developments make sense that again if you construct it right and create some protections for investors and you deal appropriately with the market challenges then there is a tremendous amount of powder on the sidelines and that can be brought in and doesn't have to stay dry. James, you're muted but I think we're available for questions.
Yeah, that was wonderful. And we'll please if you have questions on the presentation please go ahead and type them into the Q and A. I'll go ahead and take take a look. Scott, while I'm looking for those. It was not a leading question but this was the topic of my October Nelson Report article was about the amount of dry powder. So I know that there's a lot of focus on the debt coming due. I hopefully it would seem to me that the amount of equity and I you alluded to it but the equity that's sitting on on the sidelines at some point is hopefully going to jump in. I mean most notably and I think it was Pears report that talked about the or Prequen sorry that mentioned that the amount of dry powder has tripled since COVID Leading the way is certainly Blackstone with their X fund. I believe they have 30 billion circled. So how do you anticipate that wave of capital kind of hitting and again along with the increasing rates we know that there is downward pressure on proceeds. That's certainly been challenging. But do you think that you know this, this equity that's setting on the sidelines could certainly help bridge the gap?
Yeah, for sure. I mean it's really a question of capitulation. The capital and liquidity exists to and is eager to come in to and depending on who it is and how they say it either take advantage of the challenges that exist or or to participate in the solutions. And I think what we have is a market and environment that your view of it is very much determined by your situation. At a macro level there is capital to come in across all types of real estate and all types of challenging situations. We are not in a credit or in a liquidity crisis for real estate. What we have is at an individual micro property level a series of challenges that may look catastrophic to individual owners with debt coming due on out of favor properties. But we're starting to See more transactions 100104 Fifth Avenue that was reported where you have Sophisticated parties who are you know entered into a sale transaction at a substantial discount. It is you know a necessity that there be more trades and as there are more trades and there are more comps than I would expect more. I think the lack of transactions in the market is very much driven by sellers, not buyers is how I would say it. And it's not and there is the capital to go along with right sized valuations.
Fully agree. Brandon, maybe you can field this one question about what countries these foreign buyers are coming from. Brandon, you're on mute.
Apologies. Definitely has been a mix. I mean for example last Friday was actually like Lebanon and Israel coincidentally that the con but predominantly has been actually Japan. So they have specific depreciation rules that apply to their country where they can depreciate the entirety of a wood framed property. And I think it's four or six years. So if they have significant gains upcoming it there's additional benefits for them to buy in the property. And again I think the general feedback that I've been receiving. We just signed a contract with it's the, the oldest sake company. It's a, it's a family oldest sake company in Japan and for them, you know they had already been always been receiving opportunities at 3 caps, 4 caps and now they're saying okay I can buy a 5 cap that's really attractive and somewhere I want to put my money and they're buying. So it's, that's, that's been a huge source of business for us.
Wonderful. I guess I can take the next question about are we seeing distressed sales? And you know I, I think this is yes in, in short but it's very different than 2008 and 2009 when we were representing the big banks and loan sales I think but we, what we're seeing certainly with a lot of the private lenders who are UCC foreclosing I think it's happening a lot quicker. We are certainly seeing some short sales in the office space. That was certainly the case of 529 but I think more so what we're seeing and probably where there's going to be the opportunities for a lot of you investors out there is to look at these situations where the borrower still has equity in the deal but when it's time for them to refinance the bank is actually asking them to pay down the loan and they do not have the ability to or wherewithal. So they still have equity in the deal, they still have the ability to pay off the loan. They just don't have the ability to, to refinance. So I think we're going to be seeing a lot of those opportunities.
Yeah James, I would say that that's if you, and when you're seeing them or then again the capital is there and the desire is there to do it. I mean what we're seeing among capital providers, especially for you know, a New York audience is a strong desire to get into New York. And this concept that New York is or will be on sale is very, very attractive. I think. You know Brandon, as you said to investors around the, around the world but also to I'm hearing it from the younger generation of multi, of the multi generation long term owners in the, in the city. The concept that similar distressed environments in the past created the opportunity for these long term owners to build and build up their portfolios and now a feeling that that opportunity is here. So it's really coming from all, from all fronts.
Yeah. One other thing I thought was interesting and we didn't really touch on it but James, I think at the beginning of the presentation, I don't know if we want to go back. It shows the number of sales from like 2008, 2009, 2010. And I think like I'm definitely realistic understand what's happening but we are still about, we're like double the number of sales even in those years. So I think a lot of people want to say, you know, it's completely dead and everything's terrible and look, there's challenges. But to sit here and say that we're not working or busy is would also be a false statement. So it's just you have to pick and choose and there's stuff happening. You just have to spend your time on the right opportunities.
Right? Yeah. I mean look, we end up end up at 469 sales across New York City for the year. It's certainly not something to celebrate and it's certainly off the 10 year average but it is still, you know, north of you know, 2020, 21 even. Look what happened from 2000 into 2010. Look at this run up and, and again I, I already made my bold projection last quarter which I, I'm now having to explain. But do look at this run up from 2009 to of course 2015. I mean just exceptional. But every single year number of sales increased dramatically probably by at least 50%. So it looked like that was happening from 2020, 21, 22 and then of course once rates started going up. But we, we were on that trajectory and certainly exact same thing on the dollar volume. Look, look at what happened to dollar volume out of 2009 on up. And, and what we were doing from 2020 to.
And, and that's really the point I wanted to make. And, and I think the reason we haven't had that like a run up is going to be a result of herd mentality. People feel like they're no longer catching that falling knife and they don't want deals turn away from them and that's when you see the run up. I think it's been hard to get to that point because we've had so much volatility. So people are, there's not as much certainty. I think as soon as we have some form of certainty and if we were to use that short term memory scenario of we just went through Covid even before rent rolls had finally increased, there was that understanding in summer of 2021 where oh, the city's coming back. And even though the actual numbers weren't there to support that, there was that confidence. And that's when you started to see the run up in sales again. It'll be the same thing, you know, in the, with the rate environment and the overall, you know, political atmosphere. As soon as people feel confident, even if the rates aren't all the way back down to where they were, there's that confidence that things are going to start running away from them and then they'll jump back in.
Great. Another question for Scott. What new lenders do you see coming into the market? And, and maybe besides specifics, maybe type of capital. So maybe you could talk about the major buckets and talk about the, what's happening in CMBS versus life insurance companies. Are you seeing private lenders and who are the new lenders in the space?
It's really all of the above. And so the CMBS market is back and active. It's volatile and spreads move, but it is, but, but it's active. And I think that the, that that is we're back to, on some loan offerings receiving the question what do we have to do to win the deal? And that is, and that attitude is back certainly with, with Wall street and at spreads that are lower than I expected, you know, spreads in the, in the low 200s, even on commercial assets and on the bank front, there's a bifurcation across the various banks and how they, you know, we had, you know, two conversations I had this morning. One was a bank who said I'm viewing this as a great opportunity to add office because so many others are running away and I can lend at a rate now that's roughly what mezz lenders were getting several years ago. And yet I'm at half the basis. And I had another one say we cannot make an office loan no matter what the whether, no matter what the metrics are because the regulators are just punishing us for having office on our, on our books. So there's a lot of, a lot of I guess arbitrage between the various individual lenders and you know, insurance companies are looking to put money out. It's a mix from insurance companies now between whereas they were primarily very long term lenders before, some prefer to be shorter despite the higher rate. Some are more focused on bridge and other investments where they can get more yield for taking risk. So it's across all the types of lenders who have been active, there's liquidity and interest.
Brandon, I've got a tough one for you. So the Supreme Court's decision not to take the court case, how does that impact multifamily pricing?
Sure. I think in the short term I actually think, I know it's hard to comprehend. I think it might be for the better in terms of just not saying for pricing standpoint but just in terms of sales taking place. Because I think again that uncertainty of is it going to pass, is it not going to pass? I think you'd have sellers saying it's going to pass, buyers saying it's not going to pass, buyers who are sellers saying it's not going to pass depending on which seat they're in. So I think that helps just having that clarity. Like leading up to July of 2019 it was very hard to get sales done because no one really knew what was going to happen. You're seeing the same thing today in terms of the sub rehab properties and combo units. People are and there's no clarity on what's exactly going to happen in terms of pricing. I personally don't think it necessarily changes how people look at these. I think until something happens, I don't think people are willing to take the additional risk. At the end of the day it was candidly a long shot. It still could be. And ultimately it's going to come down to the politics. More New York City based and New York State based I think than the federal movement which was always going to be really, really challenging even given the Supreme Court, the heavy, the heavy conservative leaning Supreme Court. But yeah, I think it's more of the same. I don't think it hurts. I don't think it helps. I think rent regulated assets were already being priced based on the 2019 rent laws. I don't think it gets worse. I don't think anyone was making a bet that it was going to change anytime in the short term. I think anyone who's buying rent regulated product to see that long term upside is thinking very, very long term. They're not making bet that it was going to change in the next five years. So I personally don't think it changes at all.
Yeah, no, it's a great, great observation. I would agree with, with you that I mean everyone was hoping that it would be at least from the landlord. The real estate industry wanted to hear, have that course, that case be heard. But yes, I don't think anyone was relying on it certainly for their valuations. And that is the point who are making bets or making longer term bets. So with that I think we'll do one more question. Where do we see the opportunities? So look, I've been singing the praises on retail you've seen and that one, I can point to the chart and say that we've been right on that one. We're still seeing incredible growth in retail rents and especially high street coming back to life. So that's been really exciting to watch. I think with all these challenges of rent regulation, certainly with the lack or rental development coming to a screeching halt, what that has done is put even more demand on fair market housing. So we've seen the rents expand there. So I know, Brandon, you're bullish of the value add, fair market multifamily opportunities, even if it does come with a little bit of regulation. And look, I mean everybody's still trying to solve for office conversions and when they work, I think it makes a lot of sense. But there's a lot to go into that. We could certainly have a whole separate webinar on that. So we just want to thank you all. And yeah, there was another question. Are we going to provide the deck? Yes, absolutely, we will send that out. And if you have any other questions in the interim, we're always here as a resource. So wishing you all the best and looking forward to be in touch soon. Thank you.
Thanks everybody.
Thanks everyone.