Q3 State of the Market Webinar
This is a YouTube video titled "Q3 State of the Market Webinar" recorded in October 2022. The content is a detailed webinar presentation featuring James Nelson, principal and head of the Tri State Investment Sales group at Avis and Young, along with Brent Gladowski and Scott Singer. They discuss the New York City real estate investment sales market, covering topics such as sales volume, asset class performance, cap rates, debt markets, retail sector trends, office space challenges, and the impact of rising interest rates. The webinar includes a Q&A session addressing market conditions, financing challenges, and investment opportunities. The format is a professional market update with multiple expert speakers sharing insights and data analysis.
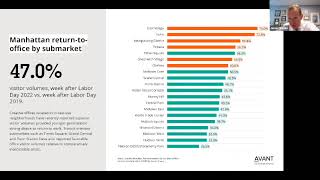
Okay everybody, thank you for joining. Welcome everyone. I see we still have a bunch more people who are signing on right now, but we can go ahead and get started so we can leave plenty of time for Q and A. And also to hear from Scott Singer who I know many of you are certainly anxious to hear about his thoughts on the debt market. Certainly a big driver in everything that's going on right now. And then Brent Gladowski as well, who heads up our retail sales for the Tri State investment sales group. And a little bit of a bright spot there with the interest that we've seen in the retail sector of the market. So we wanted to share that with you. So those of you don't know, I'm James Nelson, I'm principal and I'm head of the Tri State Investment Sales group here at Avis and Young. We have close to three dozen people in our group here and have a great team who helped prepare this information. So, you know, we're looking forward to sharing this. So I see Scott has just signed on and looks like there's Brent as well. So. Good, perfect. And gentlemen, if you interject, feel free to as well, but we'll, we'll go ahead and get rolling here. So, so let's talk about what happened for investment sales in New York City this past quarter. You can see across the city there was a total of $5.2 billion in sales. So yes, we did see a 16% decline over the trailing four quarters. So at this point it looks like we are on pace to do $24 billion of sales with an average of 35 billion comparatively for the 10 year average. So certainly you could see on one hand we've looks like we'll make a decent jump from 2021 where last year was 15.4 billion. Not much to write home about, but yes, we are seeing a, an upwards trajectory and we hope that that continues with the headwinds that the debt markets are now providing. So when you look at what is happening in the various boroughs, Manhattan, $3.5 billion of sales and again we're talking about multifamily retail, office and land over 5 million do million. And with retail we look at sales over $2 million. In Brooklyn you see an uptick of 6% with a billion dollars of trades last quarter. And Queens down 15%, 437 million. The Bronx with only 73 million in trades, that's a drop of 74%. And upper Manhattan as well seeing a pretty significant decline with only $89 million in sales. So and by the Way if you do have questions along the way that want to ask, feel free to add those in the, the chat and I'll, we'll see if we can, can get to those or excuse me, in the, the Q and A box. Okay. So as far as the number of sales for New York city, we experienced 141 trades this past quarter, which is if you annualize, that's 589 sales, about half the annual 10 year average of just over a thousand sales. So you can see that the number of sales was down in Manhattan, Bronx and upper Manhattan, but Brooklyn actually had an uptick in the number of sales as did Queens. So it still amazes me whether you know, we end up at 500 sales or even, you know, you look at the 10 year average at a thousand. You know, I always get asked the question, is it a, you know, as a seller's or a buyer's market when you only have 1,000 properties on average the trade per year, it's still a competitive market. So I find that interesting that there's, you know, only so much of the inventory that turns over every year. So now we'll look at what's happening in each of the asset classes, which is multifamily had a very Strong corridor with $2.2 billion in sales. That was a 51% uptick from the trailing Tom for quarters you did see a drop in the number of sales at only 36. So these were more significant sales that were taking place. And we did see an uptick in cap rates. So we're already seeing some upward pressure on cap rates, mean downward pressure on pricing. So the average cap rate in Manhattan for an apartment building is now 4.78%. But the average price per square foot went up by 27% to an average of 982. Now you know, as you know from listening to this in the past, green arrows are generally good. That means things are moving up. Red is generally a negative, meaning that things are declining. So we have, you know, over these 36 sales, some mixed messages that are taking place here between the average cap rate and the price per foot. So you know, the, the sense we have here, if you look at these higher quality assets, yes, they are trading, giving a little bit more yield, but they're also generating higher prices per foot because they're better quality assets that are trading. So that is my explanation for that. And if you look at where this year should shake out, right now the average multi family cap rate has been just below four and a half percent average price per foot at 872. So you certainly see some cap rate expansion. Now, Scott's going to get into this. I'm sure Brent's going to get into this. But it is an, it is important. And I should have reminded you all right from the start that this is a rear view indicator. Okay, so we are reporting on sales which closed in the third quarter, right. So we can talk about July, August, September. But remember that those deals that closed in those months were negotiated in many cases 60 to 90 days before. So we said this on the last webinar that we did. And what we were just then experiencing were these rate hikes that began to go in an effect in June. So a June rate hike, if you signed a contract later in that month in June, that sale, unless of it closed in this last quarter, might not have even registered. And that's why we have been saying that the full impact on pricing, on volume of this recent run up in rates has not been felt by the market. So we probably should caveat that. And when we talk about, you know, upward trend and trajectory, like I said, it's going to have a challenge keeping up with this respect. But I do think multifamily. You take a look at the amount of product that's sold and certainly you have a lot of this institutional product trading. If you look at 19 Dutch street that sold for a half a billion dollars, 160 Riverside Boulevard at $415 million, and 685 First Avenue for $387 million. These are large ticket sales that have taken place. And it's interesting. It's mostly we get asked the question a lot, is it institutional buyers? Is it foreign buyers? What you see here is a little bit of a mix of all the above. So you have a foreign group that purchased 19 Dutch. You have 160 Riverside Boulevard that was purchased by A E, which has been a very active local operator. And here you have another private operator in Black Spruce and Orbach who purchased this was part of the solo multifamily buildings that sold. So now we'll move on to land sales and we will see that it does appear that the price per square foot, price per buildable square footage is going up. In fact, in this last quarter the average was 532A buildable foot, although there was only 7 sales. So sometimes it's difficult to read too much into averages when you do not have as many data points. What I, what I can tell you about land sales is because of the expiration of the 421A, we're not seeing a lot of sites being sold for rental. So again, why has has land gone up by over a third over the last year? Well, yes, if you look at the averages, but I think the big reason there is because the majority of these sites that are being sold are for condo. So here you can see some of the different trades that took place. 5:70 Washington, this was a massive site down in Hudson Square and you had Atlas Capital join, I believe, with the Zeckendorfs to acquire this site. You have a development site here on the Upper east side that was purchased as well as First Avenue. I believe all these sites, if I'm not mistaken, were for condo development. So next we talk about some of the office sales which have taken place. And here we have seen a big decline in dollar volume and you know, the number of sales. Well, more so the dollar volume down 63% over the trailing four quarters for a total of nine sales. Average price per foot at 977 a foot still has seemed relatively stable. You look at the average cap still in the mid 4% range. Average price per rentable foot just above average, a thousand a foot per year. But again, we are not seeing a lot of sales that are taking place here. I mean you look at the average deal size here, you know, 745 divided by nine is a little over $80 million on average. So these are not the big trophy office deals, the billion dollar trades that really drive the market. It's been a little sleepier as a lot of the investors you could see are shifting more towards multifamily. So again, the multifamily dollar volume was more than double, actually almost triple what office was. So I think that's pretty interesting and telling. So you look at some of the, the trades that did take place and interesting here that the first one at 95 Morton that RFR sold to Meadow, this was mostly occupied. So here, this would really kind of characterize this more of a core deal. But then on 61st street you have, I believe it was HSS or excuse me, Mount Sinai that purchased this for their own use. You all might have also read that Mount Sinai also purchased the base of the Lipstick Building. So interesting that you have end users now stepping up to take down large vacant office buildings or portions of them. And then lastly, 45 East 53rd street, this is right off of Park Avenue. Bank of Santander was the tenant, they were the sellers. And ultimately, excuse me, they were not the sellers, they were the tenant. They were leaving and so this was Rialto that bought this as vacant. So, you know, we do see some instances, certainly for prime locations, certainly off Park Avenue, where buyers are willing to stretch and take the risk for vacant buildings. We have not seen this as much when you go kind of further into the class B and C space, unless if these were end user sales as stated here with 61st Street. So I do want to talk a little bit about the return to office because you know, that tends to get the, the headlines and you know, the stat that you all have probably heard is this 47%. So when you talk about a 47% return to office post Labor Day this year compared to post Labor Day before COVID So going back To September of 2019, 47% doesn't sound so great. But what I really want to stress to you all because it's not just the return to office, it's, you know, where are people living now, where are people shopping, where is the activity? And you know, again, I think you can glean a lot from these numbers, which is, yes, if you average the whole city, it's at 47%, but it's very different based on where you go. So the east village in Soho have over 70% return to office in those markets. Obviously meatpacking, Tribeca are showing strong growth as well. And yes, you know, you see the financial district is having some challenges down here, even Hudson Yards and you know, I would imagine some of those areas, you certainly have more tech tenants who might still be working remotely or hybrid. So we hope that those will continue to come back. There has been a strong return from finance. Obviously real estate law firms are starting to utilize space more. And I think the last thing I would say on the return to office is it's not, it's so specific not just to the submarket, but also the quality of the building. There's the LMI survey which studies the quality of the building and they, they took one tenant who was in the same market across three different buildings. One was a class B, one was an A, one was a trophy. Not only was the class A a trophy, but it was also lead certified, certified wellness. And what they found was that the return to office was far greater in that the highest quality building. So that, that's interesting that it's about the neighborhood, but it's also about the quality of building and flight to quality if that's what you want to, to have your workers return. The last thing I want to talk about for office is really the need to convert a lot of this Office space to residential. So the availability rate is now around 20%, which is about 100 million square feet available in the city for lease. And look, some of this office space, whether it's class B, C, is obsolete now and we need to come up with a plan. When I say we, it's the city, it's the state to figure out how to allow for office to residential conversions. It's challenging because a lot of these buildings, the way that they are built full on the lot, are not conducive from a light and air standpoint. But also many of them are in manufacturing districts which do not allow residential. So we're working with the Real Estate Board in New York and trying to figure out ways where we can facilitate office to residential. And what we are hearing from a lot of our clients and office owners is the numbers just do not pencil unless there would be a tax abatement. And as you all know, we're still waiting for 421A to come back in its latest iteration. So hoping that Albany can act on that as well as come up with a program that makes it more enticing and more feasible for office owners to convert to residential. So that will be the topic of my white paper for next month. So certainly keep a lookout for that. Okay, Brent, over to you. You're going to talk a little bit about what you're seeing out there for retail.
Thanks so much, James. Good morning everyone. Hope everyone had a nice weekend again. Thanks again. So next few slides we'll talk about what we're seeing in retail, which you know, effectively was, it was a bit of a four letter word even pre Covid and then of course during COVID But we're starting to see some green shoots in the market. It'll be really interesting, really interesting to see how the market plays out over the upcoming quarters. But here's a little bit of an overview of what we're seeing. Volume is slightly up as well as cap rates from the previous quarter. Very interesting here. Taking rents are up for the first time since 2016. So that's an indicator, I think, of tenant confidence. Again, it's an indicator that we're, I think through the bottom of this market. You know, it'll, it'll again be interesting to see how things play out over the next few quarters as there's now kind of a bit more confidence and stability in the rental market. Biggest issue we're seeing, and I know Scott's going to touch on this, is rising interest rates. Huge factor facing retail in what you can Borrow. This particularly affects retail condos and properties that have one or two tenants. I think you know, when we're seeing trades and I think what we'll see in the next few quarters is many of these trades are going to be multi tenant trades. If you've got one or two tenants in your space and a tenant go sideways or the tenant leaves the, you know, the transaction can really be stalled or go backwards. So and that's got to plays in very heavily with, with, with interest rates. Who's buying cash heavy families are buying. They're buying very selectively, very discernibly. And of course 1031 groups are buying because they have to, because they need to put the money to work. Just some statistics here. And again these are trailing fourth quarter averages. And just looking at Manhattan, total volume is down 20% from last quarter. 121 million. Number of sales are slightly up 14 and the price per foot is down you know, 1,000 to $1,000. Basically $1,000 a foot down 45%. You know that can kind of be a little bit of a, of a, you know, not telling story just because each retail condo, each submarket is so very specific. You look at an area like soho for example, price per foot on Broadway can, can differ drastically from say Spring or Prince Street. So with retail it's always, you know, kind of always trying to thread the needle with some of these metrics but just good things to be aware of. Cap rates are up. 6.16% is the average cap rate. If we look at just the last 10 years this is at its highest and price per foot is at its lowest, 1,014 or 1400 dollars a square foot. So very interesting to see that relationship there. Again I think we'll probably see that, that continue to spread over the next few quarters as again as rates tick up. But will be interesting to see a few retail sales of note. 897 8th Avenue $35 million. Again this was a multi tenant asset as I mentioned. You know I think we're going to see more of these trades. Again multi tenant is easier for I think a lender to get comfortable with. 230 Barrack street and I should mention the buyer of that is a family office. We've been very active in the city. Same with 230 Barrick. This is also a family office. Multi tenant asset here down in a little bit more of a prime location. 897 8th was in Chelsea and 1330 Broadway. Active investor here purchased this. This is interesting that it was purchased vacant for 9.7. Previously, this was asking a much higher number, so maybe a little bit of distress in that one, but this lays out very nicely for a single tenant, for a single tenant operator. And again, this is Broadway in the, in the 40s, so very prime location there. And I'm going to kick it over to Scott, who will discuss the debt markets.
Yeah. And just, yeah, just to wrap it up on the investment sales side. And hopefully this is what Scott, Scott will be answering is, you know, when will we see interest rates begin to stabilize? So I know he's going to love.
That you snuck that one in on me.
And, you know, we talked about this office demand and the return to office. So we'll continue to watch that. And then we're also going to keep you posted on this conversion of office to residential because we think that could be really a great solution to these challenges. Okay, Scott, you're up.
Terrific. All right. Hi, everybody. Glad to be on. When are they going to stabilize? I'm going to try not to prognosticate, but focus more on what if. And I think the good news from my perspective is that we're in the market with a lot of deals now and we are getting proposals on everything that we have out there. And it ranges from cross property types, including development land. There is liquidity in the market. I would say there is a very, very strong desire on new deals to close in 23, not 22. And, and I don't need to be Pollyanna. It is, it is certainly challenging, but it is still a liquid and functioning market. I'm going to revisit my slides from our last quarterly update or the last one I was on, which was first quarter this year. So, James, if you can hit one forward for me. So the handwriting is the changes to the slide from last time around. So when we did this last slide, we were looking at a Treasury that had hit 285, which seemed sounded high, and borrowing rates were on some deals hitting 5% for the first time in a long time. And the question was, should I, Should I refinance? I think now with what's happened since then, in many cases the question has become, can I? And is it? And if I can, is it, is it advisable? And I'll come back to prepayment and circle back to prepayment penalties, which is, which is interesting. We can go to the next one we put together the longest term or longest duration, look at treasuries that we could find, which goes back to 1962, and it's look, we're all trying to figure out where are we going now, where are we going next. But it is interesting to look at the very long term. I was surprised frankly at the rates in the 60s. I didn't realize they had ever been as low as 4% at the, @ the very left of this graph. And I think the last time around we focused on 1994 forward, which was when, you know, my career started. But this is an interesting, it is an interesting graph. If we go to the next one. Again, looking back to our presentation in April, the argument we were making then was that 2.87, I guess it was on that day wasn't so bad. And I think in hindsight that, that, that sounds right now I think if anyone who could borrow based on a 287 treasury today would be highly likely to sign up. And at that point, what we were focusing on was the second point at the top, which was that happened to exactly equal the average treasury from 2006 to 2020, which was this low period in the market. So even though at that point 287 was sounding very high from that more recent historical standpoint, it was at an average. Now if we look, and again this is the slide from the last time around. But I think on Friday maybe we're up to 390 today. But the treasury where it sits today, 10 year is still at an average that over at the average of my career, for what it's worth. And I'm getting a little long in the tooth. But still as we think about, wow, the treasury is hitting 4. Has this ever happened before? The answer is absolutely yes. We've had many environments where treasuries were higher than this and again over, let's say charitably a 25 year period that, that we're still only at the, you know, at that average. So if we move on to the next one, James, it's. So this is something that, so I have often talked about the fact that Libor moves really quickly and Libor now it's sofr. But the point is short term rates, when they move, they move really far and really fast. And Jeff Morock gets the credit here for finding this and putting it on a graph where you can see it. The pink more jagged line is a more consistent line is 10 year treasury since 1989. And the blue line with the big ups and downs is one month Libor over that, over that period of time. What I see, not an economist, but when I look at this, what catches my eye is the amplitude of the changes there have been since 1989, three rapid decreases in short term rates that were more than 6% in change. So at the very beginning of this, from 9% down to 3% in the early 90s, in around 2000, it's really around 9 11, from almost 7% to almost 1%. And again in the beginning of the great financial crisis, from five and a half down to close to zero. So what does that mean? We couldn't get Bernanke or Powell to come on with us this time. But it's what I, what it, what I see is very short periods of time at the highs in short term rates and rapid declines. And what does that mean? It seems to me that means it's politically difficult to hold short term rates high for extended period of time. Where is the top? That's obviously a very big question now. And that brings us back to James, if you go to the next one in this, and I tend to focus on longer term borrowing, although we do a lot of development financing, but in this longest duration look at Treasuries, where are we? And I think that, and what's going to happen next? So I'm looking back to, you know, why are rates going up now? Rates are going up now because the Fed, primarily because the Fed is trying to stop high inflation. And there have been various raises in the, or increases in rates over the last 25 years, but the last time that the increases in market rates were driven to, were being pushed up to try to combat inflation was the late 70s. And so James, if you go to the next one, I'm sort of look, when I look at, okay, where are we in and what's coming next, these two periods of time look uncomfortably similar to me. And so if the, if that's the case, which I hope it's not, then the question becomes can the Fed control rates? Can they rise and can they stop the rise or will they stop the rise before getting into the very uncomfortable period that followed that rise in the late 70s? So this then gets back to, for me, the question at the beginning of is it advisable to refinance now when the borrowing rate is likely to be well into the fives, maybe into the sixes on a, on a short term basis? And it obviously depends on it to a certain extent. It depends on what an owner borrower feels about what's coming next. But the approach that I have tried to advise is to focus on the asset and the game plan and the hold period. And if the financing that's available in the market is can be supported by the property, then I think on long term holds it makes sense to play focus on the real estate game rather than the interest rate game. So is it pleasant to refinance now? No. If you refinance now and treasuries do drop, which I'm rooting for, will you wind up kicking yourself or kicking me? Probably. But I think the alternative in other periods of time has been, has been worse. And the downside to not taking advantage of rates where they are can be. Can be quite negative. But there is one silver lining that we can point to. And James, if you go to the next slide and Jeff Morhok gets the credit for creating this too and I'm going to try to explain it. The sort of simple summary is that prepayment penalties are totally different need to be thought of totally differently than they have been for the last however many five, 10 years. You know, in, in, in. For many years it's been the case that if a loan had more than 18 months left, it seemed impossible or inadvisable to refinance because the prepayment penalty was so high. The reality is that because of the, the change in the yield curve. So the blue line here is the yield curve a year ago. And it show. And what it shows is that the bar, the treasury two year treasury rate was dramatically lower than the 10 year treasury rate. Okay. In the one year interim, short term treasury yields have risen by 400 basis points. That's the purple arrow on the left. While long term rates have risen, they have risen for sure but by significantly less 230 basis points. And so now with the purple curve line at the top, an inverted yield curve, it is the case that it is in a very advantageous, it seems to be an advantageous time to prepay the, the. In fact we have a transaction we're working on now that has a swap in place on the existing financing it. When we looked at it let's say a year ago, the cost of repaying that loan was very high. The borrower would come have to come out of pocket to repay. Now in looking at it, there is a $5 million payment that will come to the borrower from breaking that swap and repaying. And so we're in a scenario where any prior assumptions of prepayment penalties need to be thrown out. And it is very important to, to look or we can look for you. But to look at the cost or benefit of repaying existing financing if it's a defeasance or swap structure Then it is possible that there is a positive payment to the borrower. And if it's yield maintenance, it's probably down to a minimum of a point or half a point. And this is down from payments that could have been as high as 10% of a loan amount. And so while that won't entirely offset the pain of borrowing in the fives and sixes as opposed to the threes, it may soften the blow. So that is, you know, a silver lining that, that we're pointing to and something that can change the metric on some deals if where an owner has a concern that rates may rise or liquidity may dry up, this can help in moving forward to that next step. So, James, that's, those are the slides we had prepared. Happy to continue to chat.
Thank you, Scott. That was very enlightening. A little bit scary, but I think you, you, you definitely painted, you know, both sides of the picture there and some opportunities as well, which, which I think is great. Definitely. If you have questions, go ahead and put them in the Q and A or I see we have some in the chat as well. So I will, I'll dig into those momentarily. But Scott, I, I had a question for you and I know we talk a lot about this in our group meetings in the morning. But you know, with these rates going up, it's not just a function, unfortunately of the debt being more expensive, but what that's also doing is putting downward pressure on the amount of proceeds that are available. So I, I think and, and a lot of our, our listeners are investors who love the idea of, you know, distress and, you know, finding opportunities where someone has to sell. And so maybe talk a little bit about the type of proceeds, loan to value, loan to cost because there is, you know, certainly a correlation there as these rates continue to go up and banks get, you know, become more conservative that when borrowers go to refinance, unfortunately with a lot of these, they're going to have to pay down this debt or figure something else out.
Yeah, I think there's a real, clearly a challenge in the market for borrowers who were pushing the leverage levels on loans. And so yes, that's an opportunity for, you know, for others potentially lenders instituted some changes as rates got very low. That will turn out to have been helpful. So earlier in my career when before rates dropped to the 1 1/2% treasuries, the typical metric for sizing loans was debt service coverage. And as the, which was historically a strong and helpful metric in preventing loans from getting too large when the treasury dropped to its all time lows. Every loan of any sizing would be possible to achieve on a debt service coverage basis. And so the lending community smartly moved to the metric of debt yield. And debt yield is not driven by the borrowing rate, but rather by comparing the net income to the loan amount. And so I think that that sizing on debt yield will turn out to have been helpful. Although with tremendous amounts of liquidity coming in, debt yields decreased significantly. So the traditional metric earlier in my career was the amount that could be borrowed was what was equal to 125 1.25 coverage of an 8% constant, which equates to 10 times the NOI. 10 times the NOI equals a 10% debt yield. And had borrowing amounts fixed at 10% and not changed, then debt yield would have worked entirely as, as, as intended. But mortgage brokers and borrowers and others pushed and there was a need to produce and debt yields got as low, as low as say six and a half or even six percent on sizing, which did create large loans and loans. And certainly there's a significant segment that will be challenged now because while lenders mostly switched to using debt yield as the constraint, debt service coverage ratios remained as a second metric on all, virtually all transactions. And now with the higher rates, as we revert back to being constrained by debt service coverages, the loans are going to be smaller. Right. So it's a long winded way to say new loan sizings are smaller in most cases. So from a existing borrower's perspective, fixed rate loans were generally long duration, rates were very low over the last few years and borrowers who took advantage of those low rates have a cushion without refinancings coming due. But I think that where there are challenges for borrowers and opportunities for buyers are in the nearer term, nearer term duration.
Great answer. And I, I know the other thing we've been talking a lot about is how to solve for that gap equity that's going to be required. So you know, and, and you always see this when, where there's challenge, you know, there's, there's opportunity. And so we see a lot of, you know, pref and mez, you know, funds that are starting to figure out, you know, looking to solve for this. I know one of the questions and I started talking about distress. Is there distress yet? I mean obviously broad questions. So you gotta, you know, talk about if we're just talking about New York and by asset class, you know, we have not seen, you know, the floodgates Open here by any capacity with loan sales. I mean certainly here and there. And we've been working with some of the private lenders to sell off some, some of their loans mostly, you know, still looking for par, very close to it. But it wasn't like in 20, 2010 when you know, a lot of these construction loans just went bust and there was, you know, from some of the big banks, you know, massive write downs. So we just haven't seen that yet. It also seems to me that, you know, in the past pretend and extend kind of worked. You know, everybody's waiting for this return to office and thinking, you know, can things get better. But I, you know, I think office is going to have some real structural issues, you know, especially for that, you know, class B and C stuff that's just obsolete now with that flight to quality. So I think that's what really underscores the need to figure out, you know, how to re repurpose it. But we also got a question on what type of cap rates are we seeing out there, you know, for multifamily. You did see in the presentation that there, there has been upward pressure that we are seeing cap rates now in the high 4% percent range. We have a lot of buyers out there today who do not want to take on negative leverage. And Scott, as I was looking at your, you know, 20 year picture, I was thinking back, you know, to 0607 when yeah, the rates were higher but investors were willing to take on negative leverage because of that unbelievable upside that was perceived in the market. A lot of that was kind of geared at some of the rent regulated apartments that used to be able to decontrol. You know, we'd see Tom, investors buy those at 3 caps even though they were borrowing money at 6. I, I do not see as many investors today willing to take that on. They, they want to, you know, at least get neutral leverage. You know, office caps, again, they seem like they've held because there's been so few sales. Most of the stuff that's selling is the core fully leased up, kind of like mid to high four cap range. And then you have on the other side completely vacant. But you know, have not seen any, you know, super high cap rate deals yet for office. But we are starting to see certainly more yield on the retail side. So Brent, maybe you could talk about some of the retail cap rates that we've been experiencing as of late.
Yeah, sure, you know, we touched on it a few moments ago but certainly the new benchmark is the six cap figure and Wish the, I wish for all the owners out there we could tell, you know, have a little bit of a better story. But it really is 6 cap and it's probably going to tick up from there. What I do think is interesting though is, you know, now that we're through Covid, how will the market analyze and interpret these new retail leases that are signed? Because now I think there's a story to be told that some of these new releases are going to be perceived as under market, you know, under market in the next few quarters and few years. I think it'll be interesting to see where yields move once sentiment sort of settles in. But we had such a long period of time, whether it was Covid, whether it was right before COVID and even up to a few months ago, I would say where almost every retail lease was considered an above market lease. And so buyers were adjusting accordingly. But I would say run of the mill. I think the 6 cap is the number for retail and in certainly instances it can and will go higher. Will go higher than that.
Thank you. We have a question about ground leases. Are they becoming more prevalent and more attractive? And the person writing in said since they represent a third of the capital and can allow investors to lock in much lower cash cost for that portion of the capital. So, you know, Scott, maybe. I mean, we've certainly struck a lot of ground leases and the benefit. Yes. Is that you don't have to come, you know, with that amount of capital up front and for development. Yes, it can be interesting, but. But then, you know, you're looking to build a rental as opposed to a condo. I mean, I guess you could build for co ops, but you know, there's a whole business out there now where institutional investors like I star are bifurcating the fee from the leasehold and hoping to kind of solve for that. And it's got, in many cases, I don't know if you've seen this on your side, but it also almost becomes a cheaper way to, you know, to the finance. So curious your thoughts on that.
Yeah, it's interesting. So we have used that. It's interesting that it became a big new business, you know, in the last few years. And I think that Sebold in particular really created it as a. Not didn't create it, but expanded it and brought wider recognition that over the long term, we have used that as a solution in other markets at other times and it seemed more esoteric in the past. The challenge is that with the rise in all both short and long term rates, the question is how inexpensive will will those ground lease payments be and what will and what increases will be necessary in order for the money that's been raised to make those investments? What, what will those funds accept before. So there have been times it was you know we use structures like this in 0607 period when but you could bring the essentially if you think of a ground lease as very long term financing you could bring in a market that was borrowing senior mortgages at 5 and a half 6% because of the expectation of growth. You could structure some of those at going in cap rates of 1 and a half or 2% and that was hugely accretive to value. Whether that'll be the case going forward is I think very much on to be determined and dependent on where all of these other options and rates go. I see a question with regard to you know, best rates available now and I'd say look the 10 year treasury sits around 4%. Looking at another screen here and the 5 year is at 4.1 4.2. Spreads have risen a bit as well. Not and it really depends on the the lender and the product type. But I would say that the whereas a year ago the let's say the treasury rate would have been hovering in the one and a half to range and spreads were ranging from a low of about 110 to say 150 for the most aggressive as the absolute bottom of the market. Today we're looking at those Treasuries around four and spreads that at an absolute low would be in the let's say 135140 range with far more of the market in the 175 plus range on spreads and many deals that are requiring spreads of 250 to 300. So it's, there's more arbitrage in the pricing of deals than we've seen certainly since let's say late 2009 and 2010. And it is very much deal specific, lender specific, situation specific. But I don't see any fixed rate options for borrowing below you know the five and a quarter to five and a half range for as long as treasury stay. Now I keep glancing over the screen because sometimes in the course of an hour there's a 25 basis point spread these days. But, but that hasn't, but that hasn't happened now and on the floating rate side going back to that chart that showed the rapid changes in in Libor over time we've gone from essentially zero as the short term index rate to almost three and a Half percent. So similarly it's not significantly less expensive to borrow or less expensive at all to borrow short term. Now.
Thank you Scott. We had a quick follow up question on cap rates for multifamily. What if half the units are market rate and the other half are regulated? I mean look, with regulated units right now with the inability to decontrol and go to a market rent and you know, even with combination combining units, you know, now the DHCR is questioning whether or not, you know, this idea of establishing first rents by creating a new apartment size. So this is just putting more challenges for rent regulated. So you know, if you ask most investors they would tell you, you know, if it's multi, if it's rent regulated, the cap rate needs to be in the, the 6 cap range, mid sixes. But then I'm just, I'm not, I'm not seeing those, we aren't seeing those, those trades. I mean on the multi family side it's really a question of well is there upside, right? So if, if you know, we're still seeing 4 caps, Tom, mid 4 caps for multi family. If there is immediate upside for those fair market units, if you're telling us, hey, the fair market units, this is a stabilized asset, meaning completely improved rents are maximized, then yeah, investors today based on what Scott's saying are probably going to be looking for low to mid 5 caps. So if you're talking about a blend that's probably going to push that well into the, the high five range and the Burroughs, you, you might very well see cap rates in the sixes. I think we'll do one. We've got. Yeah, we've got two more questions here. And Arthur, thank you for asking about, you know, are we seeing an impact of you know, crime on transaction volumes and values? You know, I think it's difficult to make a direct link there. I think it's certainly something that quality of life which is on New Yorkers minds and we are hoping that as you know, as we have a return and more people out there on the streets that you know, quality of life is improving, hopefully more police presence out there. But yeah, difficult to say. I mean we haven't seen a drop or any concerns or lost any sales because of crime but we'll certainly keep an eye out. But last question asking about, you know, are there still big sales being announced and if so, were they signed up a couple months ago or you know, are they just closing now? Reference to 175 Water street at 252 million. You know, look I have no doubt that several of these certainly were in the works for the last few months. And I think the key, as Scott, you know, said, is that when buyers go in, they have to be conservative and understand that if the proceeds, you know, they need to contribute more equity to a deal that they're willing to do that. We're actually getting ready to sign a deal right now downtown where the, the buyer might take less than 50% leverage, especially, you know, if rates keep up.
So yeah, I would say, James, just to kick in on that, I'm not sure that it is as relevant as it seems whether a deal was negotiated in the past, because the reality is where deals are uneconomic now, buyers are not. James buyers, but, but some buyers are, are walking from deposits. And I think that, so I think when you see a deal that trades now, regardless of when it was negotiated, that is a decision now to spend the rest of the, say, 90 or 95% of the, the of the cost. And I think that all sales, all trades now should be viewed in a positive, in a positive light. It's rare that the, given the, the volatility that has existed in the market deposit is not necessarily enough. The transaction had to have made sense to move forward. So we are both simultaneously hearing about new contracts being signed based on this new paradigm, and old contracts both get closing and not closing based on it. So I think the, the market now is a, is a rational, functioning, challenging but active, active place. And I think that we should, you know, be celebrating those, the closings that, that are occurring as, as an indication, as an indication of that, regardless of when they started. Because we, because we have certainly heard of some very large deposits also being, you know, being walked from. And I think we're out of a period of time when the, the, the expectation is that all transactions close smoothly and easily. And the thought of walking from a deposit was, was really unthinkable and a major failure. I think that the deals that, that were signed up that were negotiated previously are being rethought and if they're closing it, it's because there's cents in that price.
And when selling, I think certainty of execution is paramount. And sometimes the highest offer that you have is not the best offer because you want the offer that's going to stick and it's not going to get retraded during contract negotiations or have one of those unfortunate situations like Scott mentioned, where a buyer walks from a deposit, you want to make sure they have realistic expectations going in and again, the amount of equity that they're going to have to pay to bring to the table. So I'll answer, sorry, one more quick one and then we'll, we'll call it just because if I wasn't clear on the Update for the 421A and you probably remember up in Albany they were trying to pass 485W, that would have required even deeper levels of affordability and that could not get done. Everybody I'm talking to is saying that this is going to have to wait for after the elections. It's just too, too much of a hot potato issue. But certainly they'll get right back on the, the docket because as we said before, without some type of tax abatement, we've seen rental land sales come to basically a screeching halt. So we want to thank you all for joining. If you'd like a copy of this presentation, feel free to email us or any follow up questions. We love hearing from you. Hope this was, was helpful and we will certainly be looking forward to seeing what transpires over the next couple months. But I would, I think the last thing I would say is one of our fellow principals, Brandon Polakoff, wrote a nice white paper that you can find in Real Estate Weekly about, you know, staying attentive, staying in the market. I think, you know, one thing is when there's transition like this, sometimes the senses I'm going to just sit here on the sidelines and then miss opportunities that come up. And so I would, it's great that you all are showing up and listening to this and I would encourage you all to continue to stay out there looking for opportunities because you never know when they're going to strike. So thank you again. Thank you, Scott. Thank you, Brent. And we look forward to being in touch.
Thanks, James. Bye, everybody.
Thank you.