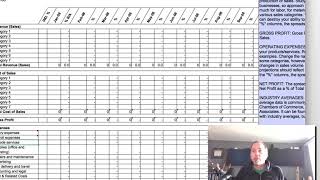
In this segment J. Anthony Allen explains the financial‑plan section of a business plan, emphasizing that investors often jump straight to the numbers. He outlines the 12‑month profit and loss (P&L) projection, which combines revenue forecasts with detailed expense categories to show expected profit. Allen stresses the need for consistency between the sales figures presented earlier in the plan and those used in the P&L; mismatches are a red flag for investors. To simplify the process he provides a downloadable worksheet that structures the P&L into four main blocks—Revenue, Cost of Sales, Gross Profit, and Expenses—filled out month‑by‑month. An additional “industry percent” column lets entrepreneurs compare their projected sales to industry averages, helping to position the business within its market. The overall message is that a clear, consistent, and benchmarked P&L is a critical component of a compelling business plan.
Chapters
Okay, your financial plan. So this, while not necessarily the biggest section of your business plan, it might be the most important. This, I've seen some of those pitch meetings where the investors just flipped straight to the financial plan. They said, let's cut to the chase, show me the numbers. So this is the numbers, right? This is the details. So we're going to have kind of seven main sections here. The first one is probably the most nitty gritty of all of them. This is going to be our profit and loss projection. So this is going to say what we plan on making and what we plan on spending. And we're going to do it on a 12 month basis. So we're going to say for the next 12 months. Now you might be thinking, didn't we already do this? Didn't we already do this in section 4, way above? We kind of did, but we really only focused on profits, what we planned on selling. So this is that combined with what we plan on spending in a bunch of different ways. So, so make sure that those match. That's a big red flag. If in the earlier section you say, you know, I plan on selling 100 units in the first year, but in this section you plan on selling a thousand units in the first year, that makes you look disorganized. So be sure that they're both the same and you know what you're doing. So in order to help simplify calculating all of this for you, I'm going to give you another worksheet. So in the next little blurb, there's a download link to the same place as before where we got a worksheet and it'll get you to download this. So this is a profit and loss projection. You can put this grid right into your business plan. Once you fill it out, you know, get rid of the blue stuff and make it look like your own. But that's okay. So this has four main sections. Revenue, that's your sales, the cost of your sales, and then gross profit, that's just how much you made and then expenses. Okay, Everything you had to pay. And at the bottom we have some calculations that happen. So fill this out. And this is for each month. So the one extra thing that this chart has on it, which is great and it's good for you to include, is these columns. This is industry percent. So industry average is a better way to look at it. So what is the expected average sales in your industry for this kind of thing? So take an estimate and this will tell us if we're in line with our industry and where we're sitting in the industry.