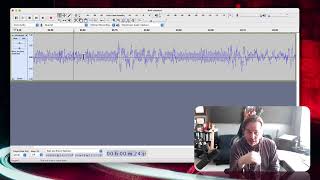
J. Anthony Allen breaks down how waveforms visualize sound: the vertical axis shows amplitude, the horizontal axis shows time, and the center line is zero. Stereo waveforms have separate left and right channels, while spectrograms plot frequency against time to reveal pitch distribution, though they're computationally expensive.
Chapters
Okay, so there are two ways that we look at recorded sound. And the main way, the way we're looking at most of the time is as a waveform, like this. Now, what we're looking at here is first, we're looking at a stereo waveform. So that means that there are two audio signals. Let me just separate this. There we go. So here's one signal. That'll be our left signal. And here's our right signal. Most of the time when we're dealing with music, it's as a stereo track, meaning it's got two signals, one for the left side and one for the right side, because we have a left and a right ear. But when you're dealing with individual samples, you might only be looking at one file or a mono signal. So let's treat this as a mono signal. I'm going to get rid of the other one. Okay, so now we have a mono signal. Now this is going to come out right now it's going to come out the left side, but I can change it to be coming out both sides by changing the panning to the center. You remember the term panning back from when we talked about how to use different programs. So now what are we looking at with this big squiggly line? What we're looking at is amplitude on the vertical axis. So volume. Amplitude and volume are the same thing. So volume on the vertical axis and time on the horizontal axis. So as it goes forward in time, the different volumes. Let's zoom in. Okay, so this gets here, and then this gets. Goes up and down. Now, you'll notice that the center is zero. So the way we represent volume here is a little weird. The center is zero, meaning if it's sitting right on that line, if the signal is right on that line, no volume. If it goes under that line, that means volume. And if it goes over that line, it means volume. So you can see here that we have 0, 0.5 and 1, and under it we have 0, negative 0.5 and negative 1. We'll talk more about those in just a second. But basically, the thing we need to understand here is that what this is representing is what our speaker is doing. So imagine a speaker, right? A speaker can push out, and if it pushes out, it has to come back. So if it's standing still, that means our signal is right on the line, right on zero. If the signal goes above the line, then, and so it has a positive value, then it's our speaker pushing out. If it has a negative value, it's Our speaker coming back in. Okay, so. So speakers are always doing this. Now, that would mean that most of the time, it's symmetrical. It goes up the same amount that it goes down. So it's always going in and out the same amount, but it's not actually always going in and out the same amount. If we zoom in, we can see there are little spots where it doesn't see. Like, look right here. They're pushed out, came back to zero, dipped under zero just a tiny bit, and then pushed out again. So that's kind of indicative of maybe a distorted sound or something like that. It's not bad. All audio files do this. They generally go back and forth like this. But even that, you know, isn't perfectly symmetrical. I should have grabbed a more normal sound. This is kind of a glitchy, weird little sound. But what we're seeing is volume above or below, and then time. So the amount that it goes above this line or the amount it goes below this line is how loud it is. Okay. And then we scroll through time on this axis the other way that we look at sound sometimes much more rare, but sometimes we look at sound as a spectrogram. This is a spectrogram. You may have seen something that looks like this in the past. What we're looking at here is frequency over time. Okay? So we have the frequencies that we're hearing and then scrolling across in time. So anything that's got a color means we're hearing those frequencies. So we're hearing in this one, you know, we're hearing a bunch of stuff up here. A little bit of a void in the middle, and then something really hard down here. That looks to me like maybe it's a snare hit or something. And we typically represent volume with color when we're looking at a spectrogram. So this is louder than this. This yellow and white is the loudest. Sometimes you encounter these on what we call spectral effects, effects that really do things with pitch. But this is actually pretty hard for a computer to do because it has to figure out all the pitches and all the frequencies that are being used in a sound. And that sometimes takes a little bit of time. It definitely takes a little bit of computing power. So more common is to see a waveform that's doing volume over time, because a computer can figure that out on the fly, like, immediately. So this is typically how we look at sound.