Lecture transcript of Andrew Ng introducing multiple linear regression (linear regression with multiple input features). Covers notation for features x_j and training examples x^(i), model form f(x)=w^T x + b, interpretation of parameters with a housing-price example, and the dot-product/vector notation. Concludes by mentioning vectorization as the next topic.
Chapters
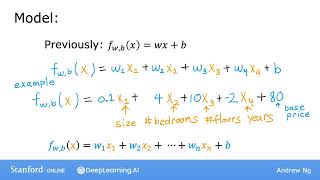
Welcome back. In this week, we'll learn to make linear regression much faster and much more powerful. And by the end of this week, you'll be two thirds of the way to finishing this first course. Let's start by looking at a version of linear regression that can look at not just one feature, but a lot of different features. Let's take a look. In the original version of linear regression, you had a single feature, X the size of the house, and you're able to predict Y the price of the house. So the model was fwb of X equals wx plus b. But now what if you did not only have the size of the house as a feature with which to try to predict the price, but if you also knew the number of bedrooms, the number of floors, and the age of the home in years, it seems like this would give you a lot more information with which to predict the price. To introduce a little bit of new notation, we're going to use the variables x subscript 1, x subscript 2, x subscript 3 and x subscript 4 to denote the four features. And for simplicity, let's introduce a little bit more notation. We'll write X subscript j or sometimes I'll just say for short, X sub j to represent the list of features. So here j will go from one through four. Because we have four features, I'm going to use lowercase n to denote the total number of features. So in this example, n is equal to 4. As before, we'll use X superscript I to denote the I've training example. So here X superscript I is actually going to be a list of four numbers. Or sometimes we'll call this a vector that includes all the features of the I've training example. So as a concrete example, X super strip in parentheses 2 will be a vector of the features for the second training example. So it would equal to this 14, 16, 3, 2, and 40. And technically I'm writing these numbers in a row. So sometimes this is called a row vector rather than a column vector. But if you don't know what the difference is, don't worry about it. It's not that important for this purpose and to refer to a specific feature in the ith training example, I will write X superscript I subscript j. So, for example, x superscript 2 subscript 3 will be the value of the third feature, I.e. the number of floors in the second training example. And so that's going to be equal to 2. Sometimes, in order to emphasize that this X2 is not a number, but is actually a list of numbers. That is, a vector will draw an arrow on top of that just to visually show that is a vector. And over here as well. But you don't have to draw this arrow in your notation. You can think of the arrow as an optional signifier that's sometimes used just to emphasize that this is a vector and not a number. Now that we have multiple features, let's take a look at what a model would look look like. Previously, this is how we defined the model where X was a single feature, so a single number. But now with multiple features, we're going to define it differently. Instead, the model will be FWB of x equals w1 x1 plus w2 x2 plus w3 x3 plus w4 x4 plus b b. Concretely, for housing price prediction, one possible model may be that we estimate the price of the house as 0.1 times x 1 the size of the house plus 4 times x 2 the number of bedrooms plus 10 times x 3 the number of floors minus 2 times x 4 the age of the house in years plus 80. Let's think a bit about how you might interpret these parameters. If the model is trying to predict the price of the house in thousands of dollars, you can think of this B equals 80 as saying that the base price of a house starts off at maybe $80,000, assuming it has no size, no bedrooms, no floor, and no age. And you can think of this 0.1 as saying that maybe for every additional square foot, the price will increase by $0.1000 or by $100, because we're saying that for each square foot, the price increases by 0.1, you know, times $1,000, which is $100. And maybe for each additional bathroom, the price increases by $4,000, and for each additional four, the price may increase by $10,000. And for each additional year of the house's age, the price may decrease by $2,000 because the parameter is negative 2. And in general, if you have n features, then the model will look like this. Here again is the definition of the model with n features. What we're going to do next is introduce a little bit of notation to rewrite this expression In a simpler but equivalent way, let's define W as a list of numbers that list the parameters w1, w2, w3 all the way through wn. In mathematics, this is called a vector. And sometimes to designate that this is a vector, which just means a list of numbers, I'm going to draw a little arrow on top you don't always have to draw this arrow, and you can do so or not in your own notation. So you can think of this little arrow as just an optional signifier to remind us that this is a vector. If you've taken a linear algebra class before, you might recognize that this is a row vector as opposed to a column vector. But if you don't know what those terms mean, you don't need to worry about it. Next, same as before, B is a single number and not a vector. And so this vector W together with this number B, B are the parameters of the model. Let me also write X as a list or a vector. Again, a row vector that lists all of the features x1, x2, x3 up through xn. This is again a vector. So I'm going to add a little arrow up on top to signify. So in the notation up on top, we can also add little arrows here and here to signify that that W and that X are actually these lists of numbers, they're actually these vectors. So with this notation, the model can now be rewritten more succinctly as F of X equals the vector W dot, and this dot refers to a dot product from linear algebra of X the vector plus the number B. So what is this dot product thing? Well, the dot product of two vectors of two lists of numbers W and X is computed by taking the corresponding pairs of numbers w1 and x1, multiplying that w2, x2, multiplying that w3 x3 multiplying that all the way up to wn xn, multiplying that, and then summing up all of these products, writing that out. This means that the dot product is equal to W1x1 plus W2x2 plus W3x3 plus all the way up to WN xn. And then finally, we add back in the B on top. And you notice that this gives us exactly the same expression as we had on top. So the dot product notation lets you write the model in a more compact form form with fewer characters. The name for this type of linear regression model with multiple input features is multiple linear regression. This is in contrast to univariate regression, which had just one feature. And by the way, you might think this algorithm is called multivariate regression, but that term actually refers to something else that we won't be using here. So I'm going to refer to this model as multiple multiple linear regression. And so that's it for linear regression with multiple features, which is also called multiple linear regression. In order to implement this, There's a really neat trick called vectorization, which will make it much simpler to implement this and many other learning algorithms. Let's go on to the next video to take a look at what is vectorization.