Learn the Explore phase of the Bogota Air Quality Project: engaging stakeholders, writing a problem statement, and assessing whether AI can help. The project aims to give public health professionals real-time, citywide PM2.5 estimates so citizens can evaluate health risks using historical hourly measurements from 2021 and Python analysis.
Chapters
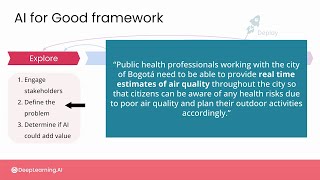
In the last video, you got a rough sense of the problem that needs to be addressed and what a successful outcome might look like. You're now ready to jump into the Explore phase for the Bogota Air Quality Project. In this Explore phase of the project, your goal is to engage with the stakeholders to make sure that you understand their needs, to clearly identify the problem you're going to work on, and to determine whether AI can in fact provide value as part of a potential solution. For the step of engaging with stakeholders in this scenario, you would need to spend some time with representatives from the city to make sure you understand clearly what a successful outcome looks like for them. And you would probably also want to spend time with the citizens who are going to be the end users of the product that you create. It would also be a good idea to talk with people who have implemented similar solutions elsewhere to better understand the best practices and things to avoid. As you engage with different groups of stakeholders in the Explore phase, you'll also learn about additional stakeholders that you should talk to when it comes to your problem statement. As I mentioned in the previous video, there are two key features that the city would like to incorporate into their air quality mapping application. First, they would like to be able to provide estimates of 2.5 levels even when a given 2.5 sensor is offlined. And second, they would like to improve the estimates for areas in between sensors. In this case, your problem definition could be something like Public health professionals working with the city of Bogota need to be able to provide real time estimates of air quality throughout the city so that citizens can be aware of any health risks due to poor air quality and plan their outdoor activities accordingly. Notice with this problem statement, you're not describing the technology at all. You're not describing the technology, but instead are focused on the the individuals involved and the problems that they need to address. With this framing of the problem, it makes it clear who some of the stakeholders are, what a successful outcome will look like, and also what you're not trying to do. We are not trying to or able to completely solve air quality in Colombia. We are improving sensor measurements in a very small part of Colombia, namely the areas around these centers in Bogota, which in turn can help us move policy and practice in the right direction for air quality. Finally, you need to determine whether AI can even add value as part of this project. If you're not an AI expert yourself, this might involve talking with some people who have worked in practical AI settings in the past to get an idea of whether AI has been used for similar projects and the potential risks and consideration. This step will also involve establishing what kind of data is available and necessary for a successful project. In this case, the data that has been made available to you looks like this. What you'll notice here is that you have several columns of data, and in this case, each of these columns correspond to a particular pollutant. So you can see here that you have PM10, which is a larger particulate matter, PM2.5, which we're focused on here, as well as other pollutants like oxides of nitrogen and carbon monoxide. We also have an identifier for which station each measurement comes from and the time and date the measurement was made. So you can see here from the time and date column, this is historical data. It comes from 2021. So here for the date and time column, you see that the first date is January 1, 2021, and the last date is December of the same year. So it's about one year of data. You can also see that a new data point is recorded hourly. So you have hourly data spanning about one year. Ultimately, with this project, you would like to be building a system that can ingest and make predictions in real time. But having a historical data set like this allows you to consider various implementations of the solution and test it out before working with current data. If you look at the details of some of the other columns, you can see that the number of valid data points or the count shown here is different for each column. And this should be your first indicator of the extent of missing data in the data set. You can also scroll down through the data and start to see some of the places where the data is missing. Right here, for example, you can see that the PM2.5 sensor data looks like it was offline, but you can see that we still have measurements for some of the other pollutants at that station. And this is important because this will turn out to be features that we can build our models on to create better estimates, what that 2.5 data should look like. So now you've got a bit of a sense of what the data looks like. And this is one of the first things you should do in almost any project. Have a look at the data, whether you're an AI professional or a disaster response professional. A lot of the things we look at first, spreadsheets of data to get an understanding of the distribution of missing data, of potential outliers of the diversity in the data, of how much we can and can't interpret. So while looking at spreadsheets is the right, first move. When we want to start building more scalable systems on top of that data, we then move into coding environments. So here we'll be working with the same data in using Python in a Jupyter notebook environment. If you've never used Python or Jupyter, don't worry. I'll walk you through how to navigate the lab environment in the next video.