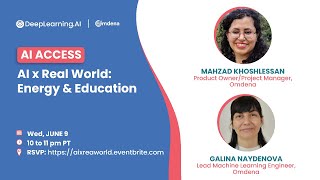
Mazat Koshnasan analyzed Twitter sentiment about energy transition across five countries for the World Energy Council, finding regional differences and biases from single-source data. Galina Naidenova led 40 ML engineers to build a student-loan planning app that models repayment capability and reveals disparate impacts on women and first-generation students.
Questions this video answers
About 15 minutes each (mentioned by host).
USA, UK, India, Nigeria (plus several other countries noted).
A five-year period described as 2014–2015 (speaker phrasing inconsistent; noted as a five-year window).
Eight weeks; about 40 machine learning engineers (Omdena).
Chapters
Welcome everyone. Hi everyone and welcome. My name is Lucy Schnitzer, I'm the head of community at Omdena. So welcome everyone to AI Times AI Real World Energy and Education. This event is co hosted by Deep Learning AI in Amdena. So just to give you a little bit of background about what Omdena is. AMDINA is a bottom up collaborative AI development platform where a global community of change makers come together to build innovative and ethical AI solutions. Some of the world's most pressing real world problems with NGOs, social enterprises and impact driven startups from all over the world. I'm excited to be here today facilitating the event representing Amdina and our community. Today we have invited two guest speakers from Amdina to give us a walkthrough of AI case studies they have worked on with us in this case. So just as a form of introduction, our first speaker, Mazat Koshnasan is a product owner and project manager at Amdina and she'll be talking about AI for energy transitioning toward a sustainable energy system. While our second speaker is Galina Naidenova who's a lead machine learning engineer at Omdena. She'll be giving a presentation on understanding the causes and effects of student debt through machine learning. So these are two really interesting case studies that they have worked on. So looking forward to hearing and learning about those to talk about logistics. So each presentation is about 15 minutes in length and we'll follow with a Q and a session. So if you'd like to post a question or upvote other questions, please find the link to slido in our YouTube description. So the YouTube description or in the event reminder email that was sent to you. And now without further ado, I would like to welcome our first speaker, Mazat Koshle San.
Hi Lucy. Hi everyone. Really glad to have a chance to talk to you guys. So I am a current product owner, product management manager with Ondena. Previously when I did the project with the World Energy Council, I was a lead machine learning engineer.
Most of my activities are in the.
Field of machine learning and AI and I'm really looking forward to this presentation and to answering your questions. So let me share my screen and get started with the presentations.
Okay.
So I'm going to talk to you for you, like talk about the AI for energy and basically the human aspect of energy transitions and what it means to basically humanize energy transition. So basically there was a project that we did with Omdena and World Energy Council and the goal of the project was basically to Find out basically how people in different parts of the world perceive issues related to energy transition.
Do people care in different region of.
The world, do they care the same? Or is it like some people in.
Some countries are really passionate about basically energy transitions and some people are like they don't really care, so what and when? In addition to that, we also wanted to know what are the barriers to the people transitioning to cleaner forms of energy? Is it like they have issue with reliability, availability or prices? So there are basically many concerns and we wanted to basically understand these concerns. So basically we wanted to look at the sentiment and like people, how people view the climate change and energy transition. Are they really concerned about it? And they what we like after doing this project. At the end of the project, our end was to basically provide governments with.
Different type of customers that exist in each country.
Basically there are different sections, people can.
Be categorized into different sections and the.
Concerns and problems of each section are definitely different. So like providing governments with these insights would be very valuable. So basically we do want to. We are not really looking to focus on renewable energy, but we are looking to basically focus on social aspect of renewable energies. There are some definitely relationship between the environment part and economic part. And these are all basically interconnected. But we specifically wanted to look into the social aspect. And through the social aspect we find.
Its relationship with other factors that are.
Important for energy transitions. Basically when we started this project, we had many challenges. We had challenges related to data. The challenges was that for example, we didn't have any available data from World Energy Council, so we had to gather our own data. But we didn't know what countries we need to consider for the start. We didn't know basically how much data would be enough for us and how should we collect our data. Basically, are we really supposed to look at English language only because different countries in different parts of the world, they do not really speak the same language. So how should we basically tackle this problem? There are also some biases, like when you like the way you approach a problem and the way you view the data science problem can lead to biases. For example, if we only look into a specific country or if we only look at a specific language that can cause a problem, basically the final output and the final results can be biased and might not necessarily necessary provide a generalized and basically comprehensive feedback to the world energy concept. So, well, this was a very complicated problem. In order to solve it, we needed to basically keep it as simple as possible and add to the complexities as we move forward. So then we can like basically solve the problem. So basically one thing is that when we wanted to gather data, we used multiple social platforms like Twitter, Facebook, Reddit, YouTube. We wanted to look at news website, although news website is basically represent and show a specific person's or company's belief, but the way the people react to them and it's really important and it's kind of a useful resource for gathering data. But here today I'm going to only present the data about Twitter because the time is limited and I don't definitely get the chance to go through all the results. And the data and time basically period that we considered for our SAP was 2014 to 2015, basically a period of five years. And why we needed to look at multiple resources. The reason was because when we looked at the tweet data, there are some major tweeting countries around the world like usa, Canada, like Australia, but the other part of the board do not necessarily use tweets. And so like if you want to use Twitter as a resource for gathering our data, then the final data would be biased. So this is one single example of how a bias can happen in a data science project. And like, in order to remove basically remove the bias, we decided to combine the data from multiple resources. But as I said today I only focus on Twitter. The other part was languages. So as I said, there are multiple languages there. Each country has, when people talk, they use their own native language. But the results that I am going to focus again are for English language. The countries that we studied were among underdeveloped, developing and developed countries. Specifically underdeveloped and developing countries are really pressing and they have a really important effect on the final energy transition. So that was very important to the World Energy Council. Countries that have been studied and I'm going to talk specifically about today are usa, uk, India, Nigeria and a little bit of several other countries that I will basically discuss them in the next slides. So when we wanted to gather data from Twitter, we decided to basically instead of defining the important keywords that we think are important, we decided to use Google Trend and Google Trend help us to see how the end interest of the people change for a specific country, for a specific country change over time. And that will basically help us what a specific keyword we can use to gather the data and basically scrape data for a specific country. So that's how we basically choose our keywords and we scrape the tweets data. Now let's talk a little bit about implementation and the methods that we have used for this basically problem we have done a lot of data collection and data cleaning. Then we have done sentiment analysis, topic modeling, clustering. There are various supervised and unsupervised methods that we have tested for our basically for this problem. And we have compared the results so that we can find the best performing models. And at the same time we try to do sophisticated data visualization because it's a very important part of any data science project. And at the end of the day you want to basically provide insight and interpret those analysis and results from any model. At the start when we looked at the supervised models, the results that we got wasn't really interesting. It wasn't, as you can see, the accuracy, the highest accuracy that we have got for supervised methods are like about 0.69. So what was the reason that like basically supervised methods were failing? The reason was that the tag, we were using tags to basically collect data, keyboards tags. And the tags really mean different things in different countries. For example, in a country like Ghana or Nigeria, there are no light means there is no like fuel or no electricity. And they have been without electricity for days or maybe a week. But in a country like Canada, no light means basically, I mean people is talking, the person is talking about like hat that they have used for hiking or camping or etc. And the other thing is that when people tweet, they use a combination of many positive and negative tags at the same time in a tweet. And it really makes it hard for a machine learning model to understand basically how should it classify basically tweet, whether it should classify it as a positive sentiment that is in favor of energy transition or something that is really against it. The other things are that many tweets as you know, or like any kind of Twitter or any kind of social platform, they contain many emojis. And emojis also can be meaningful when you are basically analyzing these tweets. And many like people who are using Auntie Green tweets, they are using a lot of happy emojis in their tweets. And that's really again confusing the model. So that's not that what all these like factors was making our models really unreliable. So we were able to look at clustering methods, which is an unsupervised model. When we applied it on tweets data, we were able to basically separate, get clear separate clusters. This wasn't necessarily the case for YouTube data. For example, when I did this, when we did the clustering and we were able to get clear clusters and group, we started some visualization and I want you to. I want to show you some visualizations for like data that we have gathered from Twitter. Let me.
Share my screen again. It seems that I got.
Okay, so here you can see the word embedding availability. Basically I have for the word embedding availability I have plotted the results from the one cluster against another cluster and this basically shows that what are the words that are frequent for each specific clusters and what are the words that are frequent. For example first cluster and these are the words that are frequent for both. For example, when I look at electricity for like uk you can see that most of the comments and discussions are about like having like electricity like providing electricity as a renewable sources or a mixture of renewable and like renewable energies. Or maybe they are talking about basically if like providing people with 3D form of renewable basically electricity and like there are also these discussing the electricity bills and like how they can basically reduce this electricity bills and etc. But when you look at this availability basically the same graph basically for a country like Nigeria. And when I look at electricity specifically you see that people are talking about no water, no electricity, no electricity basically for hours or for example being for example having no bed, no space, no electricity. So most of the people are basically complaining about not having access to any electricity or being without electricity and water for days. So these two graphs basically shows how the concept of two countries in two different parts of the world can be really different. Let's go back to the presentation now. I wanted to show you a little bit of a more like interpretation of our data. When we have done this data visualization. Basically you are looking into the data for Nigeria. People are looking at basically electricity supply. The concern is they have been without electricity for days or electricity are a big concern for them. But when you look at the country like UK basically electricity basically having renewable form of electricity, free electricity, free renewables and basically generating power through renewable energies are the most basically frequent like basically topics of discussion. Like in addition to our supervised and unsupervised models, we have also looked into deep learning based models like basically LSTM bears based and like we were able to get a very good result with one of BERT model and on our tweet data. And I'm going to just show you the results that we have got for from this deep learning model. So here in this graph you can see polarity plotted versus different basically top concerns of the people, different components that are really important for energy transition. And as you can see the percentages are showing the frequency for which people Are discussing these topics and the polarity shows that the strengths of the sentiments. And you can see that for example competitions such as oil, for example coal, etc. These are the most important topics that people discuss. After that, policy of the governments, how they are going to use it.
And.
Help people to use energy transition or another important topic that people discuss. And then technology and then financing. But as you can see the sentiment of the people regarding the financing and technology are around pretty similar. But the people are mostly concerned about technology when they discuss energy transition rather than financing. So this graph shows a breakdown of how the concerns of the people around the world is basically related to different factors. Excuse me, here you can see the renewable energy cost, the complaint breakdown for various countries that we have plotted here. For example, for a country like Brazil, technology has been pretty important and like financing is also an important topic. People are mostly talking about these. In a country like Germany, technology and policy is important. But in a country like Italy, only policy is very popular and discussed among the people. And in some countries actually there is very little discussion about energy transition as.
It is not a popular topic.
So that is also something that again is very useful insight. So like I'm going to like go through the conclusion and what we got from this like basically study we have got a variation of social interpretation around the different countries and we know that this is going to be different with countries and the social media platform that.
We are going to use.
When you do sentiment analysis you definitely need to go beyond text like look at, like pay attention to the pictures, emojis and many other factors that might affect the model performance. When you use data, make sure that you use data from multiple resources, do not really rely on one data from one specific resource. That would definitely lead to bias. And then we like looking at the sentiments from different places around the world. You notice that the countries that are closer to each other, they have like basically similar sentiments. And that was also an important insight. And like and the other things is that some countries are very positive toward energy transition and are really caring about it, discussing it, different factors and like parameters that might affect it. And in some countries they are negative or even not really concerned about it.
So yeah, that was it.
And thank you for basically listening to my presentation.
Thanks Mazat for your wonderful presentation. I already see many interesting questions so I can't wait to get those answers answered after the second presentation. So just to remind you guys, if you have any questions for Mazat and her presentation, her topic, you can find a link to slido in the YouTube description box, but we'll be answering them after the presentation. So now Galina Naidenova, I'm going to present her in her presentation. She'll actually be demoing a student loan app and you can find that link to the app in the YouTube description box as well. Welcome, Galina.
Hello and nice to meet you. So my name is Galina Nidenhuva and I'm a lead machine learning engineer at Umdina. In my most of my working life I spent in the technology and education sector. So actually it was this experience and interesting education that made me join the Umdina Challenge, which I'm going to talk about. I'm going to share my screen now. So I'm going to talk about the cognitive effect of student debt through machine learning. I'm going to talk about why we have to investigate that problem, talk about the deliverables and the task we set to ourselves, the technology and the data we used. And also at the end, I'm going to give you tips about how to tackle real life problems with machine learning. So why do we have to worry about student debt? So it's not existential threat as it is climate change, for example. However, quality education and lifelong learning is one of the UN Sustainable Development goals. And unfortunately education in some countries of the world is still not free, especially higher education also in most countries of the world is not free. So you have to finance your higher education through either your own resources or getting a loan. So looking at the statistics, they're actually quite striking. It's a big problem and worse of all, it's actually getting worse over the years. More than one out of ten alone is currently in default. So can actually imagine the stress and disruption in family finances in that. And some groups, which is exactly the groups which the student loan system was supposed to help are actually disproportionately affected by groups like female students, first generation students and ethnic minorities. So what was our challenge as machine learning engineers? We had to understand the causes of student debt problem to generate analysis and based on that go even beyond analysis and generate some actionable insights and also prototype solutions. So on one side we had the challenge and on the other side we had the team. So we were 40, about 40 machine learning engineers of Umdina with different background and skills. And our partner in this challenge was the Shaping Edu community, hosted at Arizona State University. So our focus was the US Student Loan System Institute crisis in the US but it can be applicable pretty much to any country in which higher education is accessed through loans. So I'm going to go about. So what did we achieve? We're given eight weeks for this challenge. So what did we achieve those eight weeks? So some of our outputs concerned loan decision. So why students have to take loans, why do you need to borrow and at what point the loan becomes debt. And some solution was quite practical which I'm going to show next, such as building an app to generate personalized loan projections. Some of the other outputs actually concern the loan dimension. So how big is the problem? What's the scale of the problem? How does this stand in terms of. In context of household finances as well? And some macro analysis on the student loan portfolio and other group of our deliverables is about the effect of student debt. We looked about the effect on the different demographic groups, especially the disadvantaged demographic groups and explored, we explored topic and sentimental social media sites and we talked about the effect on mental health as well. This variety of output and this range of output is also testimony of the different skills of the machine learning engineers of Ondina. Some of them they have experienced in accounting and finance or could tackle some more financial planning tasks. Some of them they used NLP for the topic and sentiment analysis. So a variety of output and skills used and used for that. So before I go with some of the examples in more detail, I'm going to talk about the data. So as you know, that's a core of every machine learning project. So probably in most projects for data kaggle is the first point of call. However, especially in kind of highly regulated industry like higher education, it is possible to use actually data from official sources. It's better in many ways. So first is a full data. You can have access to the full schema as well. Sometimes you actually have some training materials of how to use the data and very often you also have publications like press releases based on these pieces of data in which you can see how this data is being interpreted for analysis. We also aim to have a lot of diverse formats. So of course we currently hope all the data to be on one place, especially for such a big problem. So we, we took, we had statistics, we have financial information as well. We have statutory returns from higher education institutions and we also have surveys as well just to highlight the importance of the, of the data. We had a separate task force dedicated only to extracting, processing and defining data and making it available down, down the stream for analysis. So I have put here some of the sources we used at the bottom and the data actually the data we. The rich data we managed to get from, from these Sources. So now I'm going to go through a couple of very different examples about our output. So the first one is a typical machine learning application. It's a predict predictive model for a payment capability and follows pretty much the typical machine learning cycle. So we get our data, we do our dimension reduction, we select our features, we select our target, what our modeling target, we do our split, we model, we evaluate and we do our modeling selection. So it's pretty much straightforward machine learning process. However, what was really interesting was actually the insight that followed after this analysis. So we could actually see that it's not only the student characteristic which we're kind of thinking that might be the case, but it's actually the institution characteristics. So the fact that some institutions, in assessing the repayment capability of students and institutions really pays off to attend some institutions like the one with high completion rates, higher earnings after graduation, and so the institution actually is a poor investment, such as like visual arts and design institutions. So that was quite interesting. Highlight the next example. It's how we use the use storytelling to illustrate impact on disadvantaged group group. So what what we did even before we started dealing with any data, we built like a framework or a journey of student loan journey. So what happens? So why, why the student has to take a loan? What is the family situation that makes taking this loan necessary? What happens as the student goes through study? What happens then when it goes to employment? And finally, what are the long term depth effects? So after we built that framework, only after this and these questions, only after that we started filling in and adding data to this kind of skeleton framework. So what did we find? Not surprisingly, but still quite depressingly, groups for which the system is designed to help the most, which is ethnic minority groups, female students and third generation students, they encounter disadvantages at every step of that decision, that student loan process. So for example, in long decision they have to because exactly of their family situation, lack of planning, the fact that some of them are first generation students as well, they have to borrow more and borrow more often. What happens next is as they go into study, they tend to attend for profit institutions. So for profit institution is something probably typical for the US but probably in other parts of the world. So they are, especially in the US they are characterized by low completion rate. So actually students attending those institutions are less likely to complete. Also students from those groups are less likely to study STEM subjects which normally materialize in higher paying opportunities after that and going to employment. We also we know about the gender pay gap. It's a well known problem. We could actually illustrate it quite clearly with our series of dashboards as well. Very even more worse situation is that the gender pay gap actually widens. The more advanced degree is. So for example, if you compare male and female employees with advanced degrees like Master's and PhD, the gender pay gap is actually higher than for bachelor's degree which is really like unfortunate because we do promote a higher degree, we encourage women to aim higher, but then it doesn't actually pay off that much if you go for a higher degree. So actually one of the takeout of our analysis is actually how hard women and female students are hitting. Not only by missing out on STEM subject and having to face the gender pay gap, but in general they suffer from poorer youth health and also poor mental health as well. The degree of debt related stress is also higher for female and ethnic minority students. And the last point here is very important is about how students from those groups group perceived their degree worth. So was my degree worth taking? Was the expense worth it? And actually in some cases for I think for profit institutions, nearly half the students said that it wasn't worth taking a degree. So let's, let's talk a bit more about this, what that may mean. This means that actually for those disadvantaged group, if they don't see any value in the degree, they are very unlikely to promote or advocate their peer group going into higher education. And that can really cause a participation rates of these groups to drop off. My last example is also very different. This is when we actually put all our insight into action. So we designed a personalized student loan planning app which has the following features. So first it used the rich student profile data to be able to enable you to select students like them. So I can see for example what student loan repayment will look over the years for students like me. They could also select institutions since we saw how important the choice institution it is. So in that sense they can for example compare local institutions or shortlist institutions which they're aiming for and see how the payment will vary and the outcomes can vary as well. They can also factor in some personal details, for example how much they have already saved or they can put towards a loan. They can also play with the changes in interest rates and last but not least, a very important completion factor. So we people go in with higher education with the intention to complete, but that doesn't always happen. So they have to be aware. So what happens if I don't complete? What happens if I take a student loan but I can't really capitalize on Higher earnings after that because I haven't actually finished my degree. So there is the link in the chat, I think, so you can play around and see and see how that works out. So I'm going to talk about a point that I mentioned which is going beyond the analysis. So now we have all this rich analysis with so many different output, different tasks. So what do we do about it? So what can be done and who can do it? So once we have identified some particular problems we can concentrate on, we can then identify like the actors, the people who can. Who can actually influence a problem and suggest solutions. So for example, the planning app is such a example. So we identified financially low financial literacy as a recurring topic all the way. We also define that as a kind of a low hanging fruit as well, something which can be tackled fairly easily. And we designed an app that will help students put in their personal circumstances and do better financial planning and compare different scenarios. So another example may be the work on completion. So institution they can't really change the system of student debt, but they can actually work on improving completion with solution. For example, like using learning analytics or predictive modeling for completions and direct help to those students who need help who are at risk of not completing their degree. And of course there are things which are beyond the reach of individual institutions but have to be tackled by the industry or the government, such as tackling the pay gap and also getting new models of. Of higher education. For example, go go to beyond the degree. Go go with some other other models. For example 2 years degree is one example. Certificates and diplomas as well. So it doesn't have to be this all in investment in a degree. So I did promise some tips on working with how to make difference with working with real life problems with problems. First, where possible deal with official data. It's very important to if you. If you want to be credible, if you have to work with official data, it also brings you on the same page as like the media who are reporting all this problem as well build your domain knowledge. So not only look at the data, but look at things like who the players are, what the trends are, what is the individual impact as well. Also look work in combination with the social scientists or subject experts. They not only know the dependencies and which problem as well, but they also know who to influence and how to make the change. Another point illustrate the individual impact. So in our case it wasn't until for example we looked from the eyes of the individual, for example minority students and see how all the obstacles they have to face to get to their degree and how dangerous? Pretty much on every step of dropping out and to not kind of materializing this investment, they've made call out the differences. So not all the systems. So the student loan system is not bad, but in some cases it doesn't work out. So I mentioned the for profit institutions. I also mentioned the aspect for some groups. They really face difficulties with the system as it is. So go beyond knights with actionable insights. Yes, we had an example about that. Also look outside the immediate problem. So it is. Yes we do with our first instance. If it's a student loan problem, look at the financial, look at the dimension. However, when we dig up deeper, it's actually a big problem is the hidden problem is the completion. So the student loan by itself is not a bad thing. But if you don't complete it really converts into like a double problem. You've taken a debt and you can't really complete your degree and get the returns on your investment. So offer solution and practical tools like the one I just demonstrated. Think about the future impact. So what will happen if the problem is not addressed? Like you can kind of do a projection. So what will happen if you don't address that problem? What will happen is the participation of disadvantaged group will drop and actually decades of progress which were spent in building the participation those group will be lost. And use the conversation. At the moment, I think we are quite well, ironically, say lucky to have things like last year, like the start of the COVID epidemic as well the Black Life matters movement as well, which helped kind of put a new spotlight on the issues of minority students and also the increased conversation about mental health as well. So that really helps kind of resonates with people and brings the problem to life. And last but not least, do things ethically from the start. Think about the biases, think about transparency, think about kind of the robustness of your methodology. Because based on your insight, decisions will be made, proposals will be made. So it's really, really important to be ethical from the beginning. So my advice is. Yes, how do you make change in real life problems? So find an area you're passionate about, find your team, join your team and start making change. That's from me. Thank you.
Thank you, thank you. Galene. I really like that, that ending part where you gave some actionable insights. I hope everybody took a good look at that. But we'll share that after the presentation as well. So let's jump into the questions. We still have around 17 minutes left. I see that a lot of People have submitted questions on Slido, so let us start there. All right, so. And everybody keep submitting your questions so that we have. We have enough to go through. All right, so the first question would be probably from Mazat. Did you consider the overrepresentation of a certain sentiment? For example, climate change deniers might post more than other sentiments.
Yeah, definitely.
When we were doing the sentiment analysis, basically there were tweets that for example, for some tags, for some specific keywords, there were some more tweets. And then we wanted to like prepare the data. We were definitely paying attention to have a balanced data set. And like, basically we didn't want to have a specific country's data be more than the others or basically have a data for a specific tag more than the other tags. So these are the things that when you prepare the data at the first, when the data is raw may not be the case, but when you are basically working on the data to clean it and prepare it for the training model, then you have to definitely consider all of these factors.
Yeah, I think that also you were talking about the bias in the data when you were going through your presentation and that kind of fits into what you're presenting there, right?
Yes.
Cool.
Yeah. So that question was from pim. Thank you, pim, for answering that question. Next one is, I'll direct another one to Mazat. Actually, this question is from vinod. I found many people prefer sarcasm while giving an opinion. Can we consider such text on sentiment analysis? So can you distinguish.
So as I described when I was basically when I was looking. Even when he was looking at supervised model on tweets data. One of the reasons that we noticed that caused the supervised the model to be confused and wasn't to not be able to basically classify the tweets properly was because many tweets have sarcasm. And for example, the person might use a positive tag but in the whole sentence in overall might have a negative basically sentiment or meaning or basically comment. So that's why when you are basically preparing your basically remove this type of data like tweets that are big, that cause the model to be confused.
Okay.
And that's something probably only humans can at this point identify. That's why it has to be removed.
Yes, yes.
Cool, Cool. All right, so next question also by pim, but this time.
Sorry to interrupt you.
One quick like point is that when you are training your model at a start and you are working on the data set, you may not know what is really. You may not know these kind of tweets exist or may cause a problem with it for the accuracy.
But when you train the model and.
Gain accuracy then you want to improve the accuracy. There are different factors you have to explore and look into one of them is data and the different categories of the data. And then you explore the data set during improvement of the model accuracy. Then you will definitely find these factors that will cause drop in the accuracy. Yeah, sorry about that.
Cool, cool. Great.
Thank you.
All right, so next question for Galena. This one is an interesting one. Did you take into account the time data from your data sets? So if you did, did the number and profile of students in debt change over time?
Oh yes, that's a very good question. Thanks. So yes, because it's exactly because it's like a regulated industry with returns from institution that had to be done on a regular basis. We could actually track the same data over time. So it is actually what I mentioned at the beginning is getting. Probably getting worse. So it's especially for like disadvantaged students from the group I mentioned as well. It's. It's becoming more of a problem. So. Yeah. Yes. So another insight might be, however this is probably we could track performance over time for things like participation of groups, student loan problems and volumes as well. Default as well. Because that's something which is written. However, some pieces of data which was very useful, they didn't probably because they're like newly introduced. They didn't have kind of equivalent to compare it. For example some surveys, they were actually kind of one off. Especially the analysis on Covid as well. Like Covid over industry and the impact on different universities. Something which came out only last year as well. So I'm not sure how that can be, whether that will be kind of repeated as a survey and as a collection as well. But yes, where possible. Yes, we took data to build our trends as well, but we didn't discard data which was just. Just one off. And just like one off survey, for example, without follow up.
Okay, great. So that question was from Diane. So thanks Diane for answering that question. I think a good follow up to that question would be from PIM again for Galina. So at the start you mentioned the findings of the study can be applied to other countries outside of the US but did you also consider the cultural differences for example, in order to apply it outside of the U.S. okay, that's great question.
So because our work was in partnership with Arizona State University, who is like a USD institution, so the focus was US only and it actually that time frame, it's probably unrealistic to tackle more than one country. However, knowing for example UK has also student loan system which also is becoming quite problematic as well with a lot of coverage about loans that can be paid back. I would say the cultural differences is like for example in European countries, while you still have like student loan system, you have a lot more scholarships, for example, you have exemptions for disadvantaged students, certain categories. Also the student loans for example in the UK works differently. So you only pay after some threshold of salaries achieved as well. I'd say probably if you have to apply it across other countries, probably your definition of minority wouldn't be the same. So. Yeah, so in US that's a kind of well known distinction. But I think in other countries probably you think about different groups who to analyze as well. So yeah, I think when transferring analysis like that. Yes. Think about like. Like that whether the regulation system is the same, whether the financing was the same, like extra help as well to students as well. And whether your. Your definitions of groups are the same as well. Thanks for the question.
That's a good point. And also probably one thing to take into consideration is the cost of education.
Right. Which is. Yes.
Which is a big factor to understand if the problem is worth solving. Right. In a given culture. All right, cool. Thanks for that. Thanks for the question too. Mazat, I have a practical question for you. Where can I get reliable from Kofi? Where can I get reliable energy data sources for academic research in the energy field?
Okay, so that definitely depends on the nature of your project. If you are, for example, there are. For example I recently was working with an energy company. They wanted to basically understand energy consumption for each specific building analyzing the rooftop images, but that some private data you would not definitely be able to access it. The other like the issue is that for some specific projects there are some open like data like open source data sets that like is public to everyone. The like US Government like the Department of Energy from US Government is like if you look at the website there.
Are you would definitely be able to.
Find some data sets that you can.
Use for your research.
But for many research projects there is no data that that completely basically satisfies the needs of your project. So many times you have to basically gather your own data. And this was the case for our project. We basically had a lot of time thinking about where we can gather the data, how should we gather the data and how should we clean our data sets. So I cannot really tell you a specific resource that might be like an answer for every project. But as I said that depends on the nature of the projects. For some projects you might be able to find some public data, but for some this may not be possible. And then you have to basically create your own data set.
All right. Yeah.
And for World Energy Console you create all of the data that you used was open source and you created it yourself, right?
Yes.
Okay. Okay, cool.
All right, thanks for that question. Galina, I have one for you from AJ Sanchez for the data used in the storytelling and the rest of the ML based analysis were bias analysis and statistical significance analysis conducted.
Oh, that's. That's interesting question. So I get. Well that is probably the. What each group was doing, I think as a preparation of their data as well. But good thing about the data is, especially when it was a survey data we took, it was already because come from official source before they published, they already done the statistical analysis in significance. So actually alongside your survey responses, for example, you get the extra, extra worksheet with those metrics as well. So I think in some cases we are lucky to have that built in as well.
All right. All right, thank you. I have an interesting question from Christian. Christian, how did you deal with some African local languages on Twitter for NLP tasks?
So basically, is this question for me or for Galileo?
Yes, yes, yes. From Mazad, I'm assuming because. Yeah, that was.
So as we basically had different collaborators that were coming from different countries and they were familiar with the language of that country. So we basically focused on gathering data for those countries, local African basically countries. We didn't get the chance to study them. There are many countries around the world and these are going to be.
Basically.
A point of future study. But for this project, when we were looking at different languages, the local African countries unfortunately, unfortunately were not included in the languages that we studied.
Okay. But it can be relatable to other languages. For example, like you said, to give you some context, you know, the team that was working on this project was 40 to 50 people big. And there were people from all over the world between 15 to 20 countries. So the people. So that's very typical for our projects at Omdena. And so the people from those specific countries worked on those specific languages and tasks. All right, thanks for the question. Let's see. So we have another question here from Mazat you mentioned. So from Jason park, you mentioned policies during your presentation. Did technology in different areas have an impact on your observations?
Actually technology is a different factor than Polygon. Policy is related to tariffs, taxes, like many other like related governmental decisions and policies that they will follow when they want to basically transition have transitioned toward renewable energies. But definitely different regions of the board have like different. The policy and technology are basically they are different. For example, in fully developed countries.
The.
Technology is not really concerned. But in some other countries, developing and underdeveloped countries, technology can be a big concern because the government may not necessarily have access to the technologies. Yeah, I hope that they have answered your question.
All right, I'll just, I'll just answer like a quick question in here. Can we reach the presenters by emails? Yes, they will share their. Well LinkedIn profiles will share them after the presentation and emails as well. So you can always reach out to them. One next question for I guess both either avoiding the bias, collecting data from various areas, would it sometimes. Oh sorry, Yousef asked this question. So avoiding the bias, collecting data from various areas, would it sometimes be better to accept bias and inputs and deal with it at interpretation stage? I guess either of you could answer that.
Well, I definitely believe that in the interpretation as stage it would be kind of impossible or hard to deal with it. Like I would definitely recommend to avoid bias when you are gathering the data because like if you have bias, like I'm not sure how you can address that when you are, when you have, you are done with training and you want to basically interpret the data. But like in case it's not possible to like gather the data set that doesn't have any bias in case there are many limitations. Yes that might be the like the way forward but like in most of the project I would definitely recommend to like take care of bias when you are gathering your data.
Yeah, I'm going to. Since our data was very different so we didn't gather data we get it from apart from some of the NLP tasks but we got through official sources. Actually what I mentioned before, actually official sources they do sometimes take care of biases and they wouldn't report data if it came with for example. So for some institutions which they have like lower numbers, they wouldn't report data for one year because it's too low but they'll combine it across the years. So that kind of. That's another advantage of the official data. They do take care of the biases as well. And also when you work with official data as well, it's normally actually that it's quite clear what is included and what they cover and what the sample size is as well. So for example some of our, when we're building our dashboard boards as well, some of the data was for completers only for students that Complete. So you take that data, make it clear it's completers only, and look for another piece of data to complete your missing data. So it depends on the source. So it's actually two different opinions here where it's possible to actually exclude the source or just go with that and make clear theory interpretation.
All right. All right, thank you. So we'll do one or two more questions just to wrap it up. I think we have another question for Galena, more technical one from AJ Sanchez. How was feature impact conducted?
Okay. Yeah.
For example, lime, shapely shaping.
Okay. So I think it's probably meant in the first modeling example that I mentioned that I think they use the regressors. I think. Well, I think in the chat or in the link there is a link to two articles about that problem and one of them which is actually dedicated to that modeling task, it will have probably the workbook attached to. So I think it's possible to see what technique they use for dimension reduction. All right. All right, thanks.
So one more question. So we'll wrap it up for Mazat. This is from Mohammed Berat Alami. So in Africa, ICT and AI seems too innovative for many. How do you make them accessible, especially for the energy needs and when linked to clean tech?
Sorry, could you please repeat the question one more time?
Yes. So in Africa, ICT and AI seems too innovative for many. How do you make them accessible? Well, in your opinion, how do you make them accessible especially for their energy needs and when linked to clean tech?
Actually, I do not have the right answer for this question at this time.
Okay, okay, no problem.
So I think let's wrap it up because we're a little over time. I see a lot of many questions still there. But you will have the contact details of Galina and Mazat so you can shoot those questions directly to them either via LinkedIn or via email. So just for the sake of wrapping it up, I know there were some questions about how to get involved with Amdina. What you guys can do is just go to our website, we'll share it after the presentation. We have projects on our website you can apply to them through our website. Just like projects that Galina and Maza just went through. And then you can collaborate with a group of 40 to 50 people on these real world problems. But regardless of that, thanks for all of the great questions today. I wish we did have more time to cover it all. Thank you Galina and Mazat for joining us today. There was a lot of useful insights that came out of this and also some practical advice, which I think was great. I hope that everyone enjoyed today's event and we're going to, like I said, we're going to send a follow up email with a survey for all of the attendees today. We'd love to hear about your feedback and to make the future event better. So we look forward to seeing you next time.










