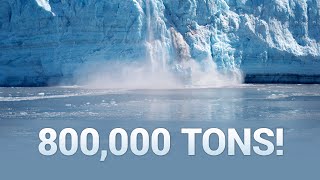
Joshua Wolper's simulation tracks how glaciers fracture and icebergs interact with oceans. The work validates against lab experiments, then scales up to a Greenland event where 800,000 metric tons of ice broke off, with simulations matching real wave speeds and iceberg sizes.
Chapters
Dear fellow scholars, this is Two Minute Papers with Dr. Zsolnai. Today we are going to see that some computer graphics simulation techniques are so accurate they can come out to the real world and even teach us something new. And it can do this too. And this too. Today, computer graphics research techniques are capable of conjuring up these beautiful virtual worlds where we can engage in the favorite pastime of the computer graphics researcher, which is destroying them in a spectacular manner. Here you see Joshua Wolper's paper, who is a returning guest in this series. He was a PhD student at the time and his first work we showcased was about breaking bread and visualizing all the damage that takes place during this process. His later work was about enriching our simulations with anisotropic damage and elasticity. So what does that mean exactly? This means that it supports more extreme topological changes in these virtual objects. And in the meantime, he has graduated. So congratulations on all the amazing works, Dr. Joshua Warper. And let's see what he has been up to since he leveled up. Note that all of these previous works are about simulating fracturing and damage. I wonder what else could all this knowledge be applied for? Hmm. How about simulating Glacier Fracture? Yes, really. But before we start, why would we do that? Because a technique like this could help assess and identify potential hazards ahead of time. And get this, maybe even mitigate them. Who knows, maybe we could even go full Harry Seldon and predict potential hazards before they happen. Let's see how to start out, we need three things. First, we need to simulate ice fracturing. Here is a related earlier work. However, this is on snow. Ice is different. That is going to be a challenge. Two, we need to simulate the ocean, and three, simulate how the two react to each other. Wow, that is going to be quite a challenge because capturing all of these really accurately requires multiple different algorithms. You may remember from this previous work how difficult it is to to marry two simulation algorithms. Believe it or not, this is not one, but two simulations. One inside the box and one outside. To make all this happen, plenty of work had to be done in the transition zones. So this one for ice fractures might be even more challenging. And you may rest assured that we will not let this paper go until we see my favorite thing in in all simulation research, which is of course comparing the simulation results to real world footage. For instance, the results would have to agree with this earlier lab experiment by Heller et al, that measures how the ocean reacts to a huge block of ice falling into it. Now hold on for a second. We can't just say that it falls into the ocean. There are multiple kinds of falling into the ocean. For instance, it can either happen due to gravity or to buoyancy or capsizing. So we have two questions. Question one, does this matter? Well, let's have a look. Oh yes, it does matter a great deal. The generated waves look quite different. Now here comes the most exciting part. Question number Do Dr. Wolper's simulations agree with this real lab experiment? To start out, we wish to see three experiments, one for gravity. The color coding goes from colder to warmer colors as the velocity of the waves increases. We also have one simulation for buoyancy and one for capsizing. We could say they look excellent, but we can't say that because we don't yet know how this experiment relates to the lab experiment yet. Before we compare the two, let's also add one more variable theory. We expect that the simulations match the theory nearly perfectly and to more or less match the lab experiment. Why only more or less? Why not perfectly? Because it is hard to reproduce the exact forces, geometries and materials that were used in the experiment. Now let's see. The solid lines follow the dashed line very well. This means that the simulation follows the theory nearly perfectly for the simulation. This plot is a little easier to read and shows that the lab experiment is within the error limits of the simulation. Now, at this point, yes, it is justified to say this is an excellent work. Now let's ramp up the complexity of these simulations and hopefully give it a hard time. Look. Now we're talking real icebergs, real calving. The paper also shows plots that compare this experiment to the theoretical results. And found good agreement there too. Very good. Now if it can deal with this, hold on to your papers and let's bring forth the final boss EQIP surmia. Well, what is that? This was a real glacier fracturing event in Greenland that involved 800,000 metric tons of ice. And at this point I said I am out. There are just too many variables, too many unknowns, too complex a situation to get meaningful results. 800,000 metric tons. You can't possibly reproduce this with a simulation. Well, if you have been holding onto your paper so far, now squeeze that paper and watch this. This is the reproduction. And even better, we have measured data about wave amplitudes, average wave speed, iceberg sizes involved in this event. And get this. This simulation is able to reproduce all of these accurately. Wow. And we are still not done yet. It can also produce full 3D simulations, which requires the interplay of tens of millions of particles and can create beautiful footage like this. This not only looks beautiful, but it is useful too. Look, we can even assemble a scene that reenacts what would happen if we were sitting in a boat nearby. It's not fun. So there we go. Some of these computer graphic simulations are so accurate they can come out to the real world and even teach us new things. Reading papers makes me very, very happy and this was no exception. I had a fantastic time reading this paper. If you wish to have a great time too, make sure to check it out in the video. Description Perceptilabs is a Visual API for TensorFlow, carefully designed to make machine learning as intuitive as possible. This gives you a faster way to build out models with more transparency into how your model is architected, how it performs, and how to debug it. Look, it lets you toggle between the visual modeler and the code editor. It even generates visualizations for all the model variables and gives you recommendations both during modeling and training, and does all this automatically. I only wish I had a tool like this when I was working on my neural networks during my PhD years. Visit perceptilabs.com papers to easily install the free local version of their system today. Our thanks to Perceptilabs for their support and for helping us make better videos for you. Thanks for watching and for your generous support and I'll see you next time.