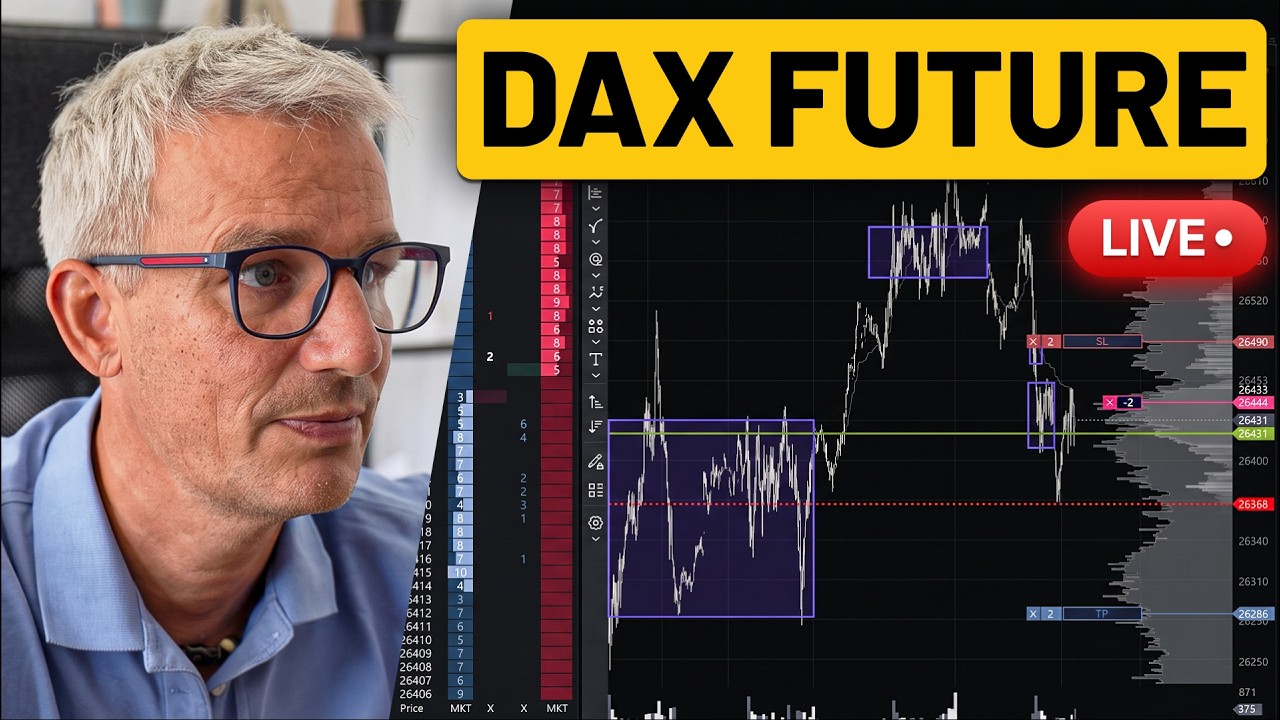
In this live‑trading session, the presenter walks through a short trade on the DAX futures contract, illustrating how to spot and exploit market excesses. He first explains why the DAX was over‑extended by examining the heavy‑weight components (Siemens, SAP, Allianz, Airbus, a telecom stock) and comparing the DAX’s price action to the S&P futures, highlighting a divergence that signals a potential reversal. He then details how he used market‑profile and volume‑profile concepts—identifying liquidity gaps, balance zones, and the second acceptance of lower prices—to determine a logical entry point, stop‑loss placement (based on the second liquidity acceptance), and take‑profit strategy (expecting a re‑test of the balance zone). The trade execution is described step‑by‑step, including the aggressive opening move, the observed volume spike, and the subsequent price action that validated the setup. Finally, he discusses swing‑trade management options such as trailing stops, partial profit‑taking, and letting the trade run to a larger target, while briefly promoting his “World Class Edge” course. The video serves as a practical demonstration of using cross‑market correlations, component‑stock analysis, and market‑profile tools to time and manage a DAX futures short.
Chapters
Live trade in the DAX future. When does it make sense to trade market excesses, and when is it better to wait a little longer? And that's exactly what I want to show you today. I'll show you first when the right time has come to, for example, enter a trade in the DAX future. Second, how you can use correlations in terms of other markets to gain an advantage that helps you optimize your timing and strategy. And third, I want to show you how to look outside the box of the futures markets to get additional information That's incredibly useful for you. Yes, I was able to execute a wonderful trade here where it's about gaining an advantage through correlation because the DAX overextended itself again. And now, of course, the question is, how do these market excesses actually happen? And to understand that, you simply have to understand an index better. And I can tell you, when stocks within the index are very heavily weighted and they rise sharply or are extremely strong, these imbalances often occur. And that's exactly what happened with the DAX, and I want to show you that now and walk you through my idea for executing this trade step by step. So first, I want to start here and show you this up here is the S&P future, and this down here is the DAX. Yeah, and you can see it perfectly here that the S&P future moved sideways during the same period where the DAX was already marching upwards. And also, in terms of the percentage expansion, what we had in the corresponding DAX index was Significantly more compared to the wonderful S&P future. So what do I do then? Then I start investigating which stocks are in the DAX and are currently driving this outperformance. Because what I observed there was one thing above all, especially during the cash sessions where the stock markets are traded in real time, the DAX was incredibly strong. And I watched that. It was very interesting. And I'll show you. Yes, let's start with a stock like Siemens. Yeah, you can see it here, for example, in comparison. Technically, that was the last high, and here you could see that Siemens is starting to sell off, just technically speaking. For me, that's the first indication that Siemens stock could now make a move downwards. The second one, and this was very, very exciting, was SAP. SAP, for example, had a gap down here and then ran back up, but it also hit resistance again at the absolute high. The third was Allianz, and Allianz ran like crazy, also produced a gap here, but then got stuck at this high point for the time being. Yes, and the fourth one was particularly exciting for me because Airbus also has a heavy weighting. It had already created this range up here and then ran down here and performed a pullback, specifically a pullback to this wonderful B. And because of that, there were several stock values where I said a counter movement could occur now, even if we're at an all- time high where many like to buy. And last but not least, we had the nice telecom stock which had already bumped up here several times. And you have to know, stocks usually run much, much cleaner technically. And here it basically said, nope, not going any further for now, I'll just form a range too. And whenever a range appears, the move can of course go either downwards or it can go upwards. And in this case, it was very clearly visible that liquidity was drying up, and you can see that perfectly right down here. There was simply no demand left at all. So what did that lead to then? All of this led to the DAX future squeezing right across in this sideways phase, and then it ran downwards and tried once more up here. Technically, it's all perfectly verifiable, but for me, much more crucial, there was the first B and then the second lower balance. And when I see something like that, I don't just have the first move down, which, by the way, was also accompanied by a volume spike. That means the market really took off to the downside there. But above all, it means the market then said, I accept these lower prices. Then it ran down here, ran back up again. And this was simply the point for me where I said the probability that we'll complete this large sideways phase, which we've already tested and accepted here, is relatively high. And so the idea came about to place a trade accordingly between this lack of liquidity and the new acceptance of liquidity. What is of course very crucial is this: why is the risk located up here? And I always say a stop loss needs a logical point of reference. And for me, that logical reference point was simply the second move where the market accepted lower prices, because if it had gone back above that, I would have assumed we'd run at least to the next higher level, if not even higher. Higher. And that's why I said that's where the risk would simply be met and accepted for me. Regarding the take profit strategy, I have logically thought about it this way. I assume that we will first test the lower boundary of this current sideways phase. This is because I firmly believe that whenever a market has found acceptance at a certain level again, it is statistically much more likely to trade through that area of acceptance once more before moving on. But of course, that is just the technical version of how I see this playing out in the immediate future. Let's look at the profiling version, and we had a really great picture there. Before we get back into it, a quick notice: World Class Edge just launched, and if you want to know how really institutional traders and market makers actually trade, click the link below and secure your spot at World Class Edge. Alright, back to it. At the market open on the day we booked our short trades down here, we had the opening up here at the previous day's profile value low and immediately made an aggressive move down. And that is, of course, another indication that tells me from a profiling standpoint that it's a truly outstanding idea to enter this trade there after the market ran up and then immediately back down. Furthermore, for those looking at this from a longer-term perspective, we come back to the question: why might this trade potentially trade through an entire balance? We re-entered the previous week's range from the exact moment the market moved up here with real sustained momentum, as clearly seen in the single print. And then, with the VPOC shifting down and the corresponding lack of liquidity above, we are left with a very clear picture. This setup provides us with a nice additional trading idea that we can confidently look to execute. This means that several points were present for me there. The first thing that was very important to me was that the stocks that caused the market to be significantly stronger than other index futures hit a barrier. Secondly, the technical side showed me that there is actual selling happening. Before that, you shouldn't just look for a short somewhere at the top. And thirdly, through the concepts of market profile, volume profile, acceptance of balance zones, and the corresponding market open, I have even more evidence that my idea is now, well, conducive to the market actually falling, even though we are at an all-time high and many market participants are very heavily positioned there. But let's take another calm look at the entire trade together. So for this swing trading idea, we have great route planning here, and of course you have to follow through with it, and the market must reach the target. Of course, we never know that beforehand. And so let's look at how it played out, which is always quite exciting. The market has successfully formed a fresh zone of liquidity down here, while the previous older liquidity was clearly positioned up here. So effectively, this specific area acted as the critical dividing line, clearly separating the liquidity that was resting below from the liquidity that was sitting above. And then I decided to trail the stop loss at some point. Why? Well, look, here was the highest liquidity, here was a lack of liquidity, and if the market had run back up here, there would have been a high probability that the market simply wouldn't continue to build that downward liquidity for me, and that would be bad. And up here, it would have hit my stops accordingly, and that just wouldn't make any sense. That was the reason why I said that you can now trail a stop loss here accordingly. And when you look at the whole thing for yourself in the end, I want to show you the liquidity again. Yes, the market just kept looking for a way down, and in the end, it really traded through this entire range. That was to be expected if it continues to stay in acceptance. And everything up here, where I also said that the risk had to be taken initially after this B was here. Here was the second acceptance of liquidity. It's always nice when it offers you a great price range here where you can say the probability that it'll play the balance game again is high. For me, these are trades where I say you can step away from high-frequency day trading and just let a trade run and watch the market reach a larger target. And once it has reached that, then there are 2 possibilities. One possibility is that you take your profit and say at the bottom, yes, target reached, done. The second option would be to trail a stop loss accordingly, especially when you think the market still has a journey ahead of it. And everyone can do that for themselves, however it feels right for them. And, um, um, I also think it's quite nice sometimes to make partial sales and let part of the position keep running and accept the rest accordingly. In any case, from an approach standpoint, this was a trade that was a bit special, and I just wanted to share this Uniqueness and the logic behind it with you. I hope you enjoyed that. I hope this also helps you a bit to locate such trades for yourself outside the box, and I'll say see you very soon. Have fun with it.