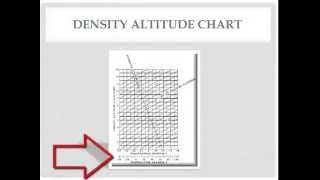
Kenny Keller walks through reading a density altitude chart with two examples. At 2,000 feet pressure altitude and 20°C, density altitude is about 2,500 feet. At the same altitude but 38°C, it jumps to 5,000 feet. Higher temperature means higher density altitude.
Questions this video answers
May 2, 2013
2,000 ft
20°C (≈68°F)
About 2,500 ft
≈38°C (≈100°F)
Chapters
Density altitude chart. Don't forget down here at the bottom, quick reference to convert from Celsius to Fahrenheit. So don't forget that's there. You may want to referencing that at some point in time during all these performance things you're going to be doing. So let's dissect this chart a little bit. This is how you figure density altitude. So we're going to work a problem, find the density altitude. So you have to know your pressure altitude. For this we're going to use 2000ft pressure altitude and we're going to use 20 degrees Celsius around 68 Fahrenheit. So let's draw a line up from 20 degrees Celsius. We're going to draw a line up until we meet that 2000ft pressure altitude. Then we're going to draw a line off to the left and that's going to show us the density altitude about 2,500ft. This isn't to an exact. This is just close. I'm just trying to kind of show you how to interpret this chart. So let's do another one with a higher temperature. Let's go 100 degrees Fahrenheit, which would be about 38 or so Celsius. And we'll just start at the bottom 38, go up to 2,000ft pressure altitude again. And when we come across to the left, that's going to show us about 5000ft density altitude. What I'm showing you is as that temperature goes up, the density altitude goes up.