Episode 7 of The First Home Buyers Show - Where and What to Buy
This content was created by Let's Chat. This content was uploaded by Let's Chat. This is a YouTube video titled "Episode 7 of The First Home Buyers Show - Where and What to Buy" created on June 12, 2020, discussing topics related to purchasing a first home, including location and property type considerations.
Chapters
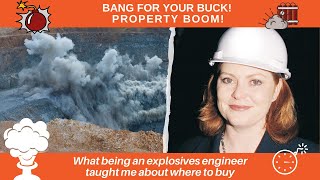
Engineer and every single day I would turn up to work and pretty much blow something up, which is a great stress release. However, I used all of those skills and knowledge that I learned as an explosives engineer to build a multimillion dollar property portfolio. And I can't wait to share with you how. But first of all, let's get those credits underway. It's the first Home Buyers show where first home buyers go to watch their wealth grow. And here's your host, Jane Slack Smith. Yes, it is me. And I would like to share with you and those of you who are first home buyers and those of you who are just curious on how to protect the downside of any property investment, how I went about doing it. Now when I started I only had $45,000, $25,000, even though I was a first time buyer, went straight to the Victorian government as stamp duty. So I had a 5% deposit. So I knew to make that money work, I really needed to do everything I possibly could to make it work for me. Now I developed a system called the Trident Strategy and I'm going to take you through that today because I think all the information about where do I buy, what do I buy, how do I make sure that there's going to be someone there to buy, buy the property if I want to sell or rent it out when I'm ready to rent it are great questions. And I know having talked to so many first home buyers that there are questions and worries that a lot of people have. So I'm going to take you step by step how I came up with my Trident Strategy, three ways to make money so there's no downside. And also I'm going to go through websites that you can use that are completely free. I'm going to show you some paid ones as well, but completely free that allows you to get the intelligence and the information to protect the downside because that is what's so important. So let me introduce you to the Trident Strategy. So the Trident Strategy is my three prong way of making money. And the way that I do that is that I make sure that you actually are looking at the big picture. So first of all, we're looking at the long term money making opportunity and that is capital growth. In the long term, capital growth is going to be the thing that turns your $500,000 property into a million dollar and you have $500,000 at least of equity that you can put to your bottom line and use how you want to use it, when you want to use it. That is capital growth. It is absolutely the most important prong of my three prong approach and one of the prongs that I would just definitely not go without. So how do you understand what capital growth is and how your suburb that you select could have good capital growth? Well, that's a great question. Now there's things like the ripple effect that you may have heard of. So this just means when someone can't afford to buy in a certain suburb, they move to the next suburb and when they can't afford to buy in that suburb, they move to the next suburb. Now I've got a methodology on how I work out the ripple effect. And across the country I've had thousands of people do my magic dot map, which is a technique that I borrowed from Nadine Simmons and that gets all the information regarding the last 10 years worth of capital growth, making a little legend, putting on some maps and actually working out exactly what that capital growth opportunity is and where that ripple effect is. Now capital growth is driven by so many things. Population growth, income growth, that affordability factor. So there's so many things that affect capital growth. But we can look to the past to help us understand the future. The other thing that we look at and what I've always approached, and if you know my five step framework, then you know that I also have a supersizer which is a optional extra step and supersize it is around renovating. So creating equity upfront and getting in there and making money so that the property goes up in value and you can charge a higher rent. It's the exact strategy that I use when I bought my first property. I bought my first property for $425,000. And as I told you, I used all my money up in buying the property. But then I borrowed $50,000, I did a renovation and nine months later that property was worth $700,000. I created equity out of thin air. I bought well, I bought in an area that was going up in value. I renovated strategically, I understood the comparables between the difference of renovated property sale prices and unrenovated property sales prices. I didn't over capitalize. And then, you know, I was able to take the equity out and go and buy my next property and my next. And that's what I want for you to build up, you know, a base of fundamentals of having your financial security set for you. And this three prong approach makes sure that if you get one wrong, at least you've got the other two to fall back on. Now my other part of the problem comes down to the actual property itself. And that's when you're negotiating, getting in under market value or at market value if it's a really fast moving market, but actually being able to negotiate. Now I have all these techniques on negotiation and we've had many interesting talks with Scott Agnett from hello House. He is in that first house buyers group in Facebook. Go in and ask him questions. Professional negotiator who's standing by to assist you with your negotiations. And you know, buying under market is way that you can instantly put money in your pocket. If you're buying 30 grand under market, you can wait one or two years for that much growth, but you could get it instantly. So that's my three ways of making money using the try not strategy. So you might say, okay, so I've got a suburb and I'm really interested in this suburb. I want to understand more about the suburb. So this is my next technique to actually making sure that you've got the typical property. Now as I said, I was an explosives engineer. Every single day I used to blow stuff up. But one of my most important jobs was blowing it up safely, understanding the risks involved. So making sure that I understand what the likelihood of something going wrong is and then understanding what the consequences were. Now if I could reduce the likelihood or I could reduce the consequences, that risk became acceptable. So I decided to use those skills when I started buying property. So what are the kind of risks that you might have? You might be buying a one bedroom unit in a regional town full of three bedroom houses. It is not the typical property. It might be a unique property, but it's not a property that the majority of the market wants to rent or the majority of the market wants to be able to own. Another risk might be that Hell's Angels, you know, start changing their oil in the motorbikes in the middle of your lounge room, destroying your carpet. So that is a risk. What's the likelihood? Yeah, not so likely consequences. Pretty expensive. So whenever I had investment property, I had landlords insurance, it cost me 3, $500 a year. And I just had that peace of mind that if anything went wrong, I had that covered. So that's how I approach risk. And that's how explosive engineering allowed me to address some of the risks in property buying. So you might be saying, okay, I've got a suburb here, but how do I find out all of the typical information? Well, I'm glad you asked, so I want to share with you now. I guess some of the techniques That I do to find out a little bit more about a suburb. And now I'm going to show you some free techniques and free websites that you can go to. So the first one that I want to share with you is one of the main real estate sites you've probably seen a thousand times. And this is realestate.com now you can go in here and you can put in your suburb that you're interested in. But I have to tell you with these Internet sites they change all the time and I'm always looking for ways to not just get more information but be able to find information for free and pass it on to everyone. So I have found over the years that realestate.com au has this sub page called Invest and if I go in there it throws me over to this neighborhoods page. Now as you can see, Neighborhoods and Invest does not appear here at all. But I know from using this for the last 20 years that if I put in Invest it will turn up. Now I can't promise it's always going to turn up, but what you're going to be looking for is the suburb analysis. And I'll show you another way that you might find that in Domain. So let's just choose a suburb in Queensland. Brisbane. So I've chosen the suburb of Zulmia in Queensland. Now this gives me a lot of information about the area. I now have a median price 460, which is conveniently below the cap that the first home loan deposit scheme has set for Brisbane. I can see here that the three bedroom houses median prices is 460. I can see a four bedroom is 512. Now you know that may mean that there's opportunity if you could convert an extra lounge room or living room into a extra bedroom that you could get more value. But I want to make sure that I've got the typical property. So this is how I find out a little bit more about this suburb. I find out that there's not that many elderly people. I can see here that independent youths. This is the kind of lifestyle and people that are living in the area. I can see the typical properties and if I can't quite afford Zulmia I can actually come down here and I can have a look at other suburbs that are in a similar price point as well. So you can see here that you can go through this which is really very clever. So I'm getting a little bit of information about Zilmia. I'm getting an indication about the rent. So this would tell me if I Could maybe put up an extra wall and convert a living space. It might be worth more, but more importantly, it might cost me $5,000 to do that, but I could potentially make an extra $70 a week in rent. Interesting. If you come to the time when you want to rent out that property. Okay, so remember, as first home buyers, we want to be thinking as investors. So we're looking at this property to be able to use as an investment property in the future. Now for the first time loan deposit scheme people, that just means that you have to live in the property until you have enough equity that you can release that guarantee. Now, if we're in a good growth area and that's what we're really aiming for here, then you're looking maybe a couple of years to be able to do that, grow the growth in that property before you move out. For the other first time buyers who have the stamp duty concessions, you might be looking in these areas with a 5, 10, 15, 20% deposit and looking at going through our first home financial freedom framework and actually using that to help you buy the property, live in it so that you can get the stamp duty concessions, et cetera and then convert it into an investment property quicker than if you're on the first home loan deposit scheme. So let's just jump across to another free website. So Domain. Now this is where it gets a little bit harder and you're going to have to go and search for these reports. So here I am in zilma. If I come over here, or sometimes you have to actually go into a property, if I come over here and actually click on the suburb report, you're also going to see some of the information. It gives us an idea of the average ages, what the percentage of renters and owners are. You know, you're going to get some distance to what would seem to be the train, which is great, how long it's going to take you to walk to the train. And once again we're going to start getting some information about price points. Now the really important information here that you need to see is all information comes from different sources and the reality of that is that it's not always going to look the same. So you need to record where you're getting the information from. So, so in this case you're at Domain. If you're over at real estate, remember that we had the four bedroom house here was similar in price. So it may just be that the data source is exactly the same for this gives us an idea about the schools and the catchment zone. So if there's potentially a private school or a secondary school or primary school that's in the catchment zone, you want to be able to be aware of, that gives us some ideas about properties at the moment as well. So. So once again, a little bit of information. Now where I get a lot of my information from. Now this is a paid resource. You might want to go and buy a magazine. So this is 9.95, your investment property magazine. And I have to say I spent a lot of time hanging out in the library and they're in the library as well. So feel free to go and get it for free there and borrow it. Now what you're going to find here is a couple of things I want to draw your attention to. In the back of the magazine there's this huge section called the Data Watch and there's this extraordinary amount of information in the Data Data Watch section. Now I've just highlighted this. If you have bad eyes like me, you're probably going to have to put your glasses on. But you can see here, there's all this information here and I actually have Zoomia there and it has been highlighted as well. So, so you can find this information for those people who are looking for the 10 year growth information. It is always listed in here as the average annual growth. So I can see here, over the last 10 years, Zilmi has done around about 2.8%. Now I want to know where this information is coming from. So what I do is I look over here under price guide and it says, hey, this information is from, from CoreLogic RP data. CoreLogic. So now I know the source of the information. However, you might notice here that the magazine is a December magazine, it came out in November. But the data source for RP data is September. So they get September information. So they can, so they can prepare the publication in October. So you get it in November, but they call it December. So just be aware of how old some of this data is. So once again, a couple of free resources. So realestate.com and we also looked@domain.com to get a feel for the suburb and now we have your Investment property magazine as well. But what if I actually want to know what exactly is the typical property? Well, I'm glad you asked because there's a free source of data for that too. So let me take you over and share with you the information from Sensors. So all I want you to do here is just, just go into abs.govau and go into the census information. Now this information came out in 2016. Oh my goodness. I really wish that it was updated in 2020 already because I'm dying to get this information. But we're talking about zillmia here, so let's go in and choose zilmia. Now this is going to give you all the information that you need to know about the typical property. Now once again we're getting a feel for how many people live in the area. Bit of demographics, so the average age is 33. We can actually see, wow, look, you know there's 25 and to 34 year olds compared to the rest of the state. There's quite a large amount of younger people here within that age group. So it's actually quite a young dynamic. 33. We see how many people married. You can go through and see what education people have, what country they're from, all this information. Some of the really cool information that I like to look at as well is just get a feel for how many people drive to work or how many people get the train. This gives me a feel for how important the public transport is and being close to the public transport. And we can come down here as well. And this is where I start getting all the information that tells me what the typical property is. So you can probably see here the separate house. 57% of people live in a house. So I now know that the house is the most typical property. And then I've got Semi detached townhouse, 15% so not so popular. And a flat or unit really interesting here, 26%. So it makes me aware that this area has a lot of houses, but also a large proportion of units as well that I need to be prepared or be aware of. And then if I come down here, I can see here that the two bedroom and three bedroom are the most popular properties. So when I saw all of that information on domain over here and real estate on the number of four bedroom properties, the price of the four bedroom properties, there isn't actually that many of them on the market that are available to actually rent or buy at any time. So there's only 423 of them. So the typical number of bedrooms definitely the three bedroom. So now I know that the three bedroom house is the most typical property. Now the other number here that I want to see is how many are rented. Now I have a number of filters that I apply to any suburb and some of them are about reducing risk, such as I want to make sure that I can actually rent my property out when it comes time to rent or sell it. And the others come down to just, you know, how easy is it to do business in the suburb. So one of my filters is the percentage of renters. Typically there's about 30% of all Australians are renters. So typically I would use the number of 30. I want to have over 30%. Now I'm okay if it's down to 28, but 30% is the number of renters that I'm looking at as a minimum in the suburbs. This is great. So is there a maximum? I hear you say, well there might as well be a maximum and that could be 70 because I don't want to have a whole suburb of renters. So just tell me, you know, and I'm interested in your thoughts here if you had ever thought about the percentage of renters being a number that you could actually find or a number that you have actually looked for in census before and something you're aware of. Because I think when people come to buy properties and they put that investor hat on going, I actually want my home or my investment to be worth a lot more in the future. But I also want to make it attractive to the largest proportion of the market when it comes time to rent or come time to sell. Is percentage renters something that you've ever considered before? So let me know. I hope you're getting a lot of value of this because this is some insider tricks and what I do when I'm looking for properties. So you might then say, well okay, so now I know that there's a lot of renters in the area. I know that three bedroom houses are very popular. So what else do you need to know? Well, I'm glad you asked. I would jump over in that respect to another free website. Now this is SQM research and I spend tens of thousands of dollars a year buying their data to put into my suburb selector software for my students. So you know, the reason that I really like this data, there's a lot of the information here is free and available to you. They're the number one resource. You know, it's where all the magazines and everyone gets their data for vacancy rates and vacancy rates is another measure that I use. So let's just go in here and have a look at some of the free property data that they've got available. And they have this one called Total Sold Records. Now the reason that I like this and I kind of manipulated to use it for my own purposes is that it gives us an idea of the price per square metre that the properties are going for in a suburb so we're looking once again in a suburb. So let's go down here and say Zilmere so we keep everything consistent. An affordable suburb within Brisbane. Now what this does is creates a best fit. But I love this graph because it gives me an idea of what the typical property is selling for. Now this is in the last 12 months. I can see the actual address of the properties that have been selling and it gives me an idea when I look at these little ones down here, 15, 22 5, 356 that there's a lot of subdivision that's also going on. So people are able to see subdivide to a 150 to 200 square meter block. But it also gives me an idea that this area here where all the dots are is where the most sales are. So somewhere between 500 square meters and 800 square meters. So 500 to 800 square meters. I'll write that down in case I forget it. 500 to 800 square meters is my typical type of property. So you can see how we're building up this reserve of information here. We've chosen a suburb that's in our price point, Zilmere. We're going in and we're saying, oh, let's learn a little bit about it. We know it's a younger profile, people 33. We know that most people drive to work. We also know that three bedroom house is the most typical house. And now within minutes we also know that the most typical block is 5 to 800 square meters. So as you can see here, we're building up the information, we're building up the knowledge of that suburb. Now we can take this to a whole different level with paid resources. And I'm just going to demonstrate with you quickly, this is my suburb selector software that I have here. And as I said, you know, going around and getting all this information can take a while. But let's just say you're buying in Brisbane. This $475,000 is your maximum price. You're happy to go below it and you're happy to go, I don't know, 45Ks. I don't know, let's make it 20Ks out from the CBD. And so what this very quickly does is it comes up with all of the suburbs that are actually, you know, within that area. So we can go in and have a look at the map. We can see where Zilmia is. It's just up here north of the city. And let me just choose that. I can see it's 12ks in the CBD, $450,000 is the median price. Now, one of the extra things that I'm looking at, and we talked about this a little bit earlier, is I'm looking for some pricing pressure. So I'm actually looking for the fact that I've got suburbs that are closer to the CBD are actually worth a bit of. Well, have had higher growth in the last 10 years than suburbs that are further away from the CBD now. So as I'm looking here, I can see that the suburbs that are closer, like gbar, is more expensive. I can see asple more expensive. So this gives me an idea, and I'm just going to complicated things a little bit. This is a digital dot map that I've done and I've taken all of the data out of that spreadsheet and I've put it in here, and it gives me an idea of what is happening in the area. So I can see that the capital growth over the last 10 years, that is happening in Zilmi. So Zilmi has had, you know, 1.5% to 1.9% capital growth in the last 10 years, according to SQM Research. But I can see here that there's been suburbs closer to the CBD, like this one, Z1, 3.5 to 3.9% growth. So arguably, what this means is as these suburbs, this has had 2.5. This is another 3. As these suburbs are more expensive and had better growth associated with that, they're going to start pounding, pushing in this area. So you'll see these, these suburbs starting to go up in price, and that's the ripple effect. So we jump back over here with Zilmia. I want to show you a couple of those other filters that I use. As I said, I'm always looking at percentage of renters. So this is good. I want to just make it convenient for me. So I'm usually looking for a minimum of, say, 60 sales a year. Now, in a slower market, as we had in the last few years, I'm happy to go with 59 in this case, but it just gives me an indication of, you know, what have sales been. And am I going to waste my time in a suburb that maybe had 24 sales in the year, two per month coming onto the market? And if I'm up against, you know, 70% of the market are going to be owner occupiers rather than investors, then, you know, there's going to be some emotional bidding out there. So often I'm just going to get rid of those suburbs that have very low sales because I want to have the best chance of getting a property within the time frame that I have for my pre approval that usually lasts three months. So you can see here, you know, the data comes up. I try to grab all the information as quick as possible. I pull all the information from the census data. Three bedroom houses. I now know the median age. I know that a lot of people who do catch public transport would be getting the train. I know how far it takes because I looked at domain to see how long it takes to walk to the train station. I get a feel for mum dad with kids is very similar to mum dad without kids. So being really observant of the primary schools or the schools there is not that important. I can see here that there's a large amount of houses. I've already made sure that I can verify what the percentage of dwellings are. Now this is interesting. 30% public housing, that's actually quite high. So I would just put in my notes in this suburb, be aware of where the public housing is. And then I have 56% of renters and I have a rate, vacancy rate of 1.9%. And this is the other thing that I'm looking at now. When I'm looking at vacancy rate, it's really important for me to understand what vacancy rate is. If the number is 3%, it means there's equilibrium in the market. So there's as many people looking to rent as there is landlords trying to rent their property out. Now if it's 1.9% then 1.9% means there's a lot more people looking than there are landlords trying to rent their property out. So once again I'm protecting the downside. So just as let me know that you're getting this, so just put, put a hashtag nugget up there if you've got a nugget that you understand vacancy rates and you understand the typical type of property, you understand where to get the average size or median size property from and what the typical property is. So these are all really important things and as I said, these are free resources where you can get this information. Now I want to show you one other thing that I think is really, really cool and I know this is taking it all to a whole different level, but I think this is. This took me, oh wow. About three months after the census data came out to work with census and working out how to get this information and teach it to my students. So I'm giving you a Little bit of a bonus that only my students usually get and that is working out how to actually use the census data to work out what streets the within the suburb the renters want to live in. I know, amazing. Can you believe it? So once again I'm going to head over here to census and I'm going to go up to census here and I'm going to come down to table builder. Now this is a really super quick scenario on how you can get this information. You need to sign up. If you use the guest, it won't work. So get in here, sign up to table builder, accept the terms. Okay, let's just see if I can find in five minutes or less where all the renters are. I want to go to the 2016 census data, I want to look at the table builder basics and I'm looking at dwelling characteristics and I'm going to create a table. Now first and foremost I need to know where we're looking. So let's go in and have a look at the geographical areas. Now I come all the way down the bottom to here because I'm looking at the SA1s or the smallest geographical areas that I possibly can because I want to find the streets within the suburb that the people live in. Now I'm going to just go into the top one here. I'm going to go to Queensland. I'm going to go Brisbane North. I believe Zombie is somewhere where. Here we go. Zoom is here near Sandgate. So all I do here is I clicked on this and I say click on all of the S way 1 levels. Now every single one of these represents 200 houses. So I've got down to the smallest level possible. I head up here, click it onto columns. So now I have all of those 200 property blocks up here. But that's not all. I actually want to know a bit about who's living there. So I come down here to dwelling structure. Now I want to know about the houses, I want to know about the semi detached. I want to know about the one to two story flats, the three story flats, the four and above. I don't care about flats attached to houses, I don't care about caravans. So these are the types of properties I'm after and I'm going to add those to the row. But wait, I'm looking for properties that are rented. So let's go down here to tenure type. I owned outright, owned with a mortgage. I don't really care about shared equity schemes and rented and let's add those to the Rows as well. Now it is as simple as hitting a retrieve data and I've got all the numbers of the people who live in for instance, a separate house owned outright in this little block of streets. But that doesn't make a lot of difference to me. I actually want to know what percentages they are. So I'm doing the percentages by column. So now I know what the percentages are. This is all kind of confusing. Let's go over and check out the map. Now the thing I love about this is in what, less than three minutes I've been able to work out where in this suburb the renters want to live. So I come over here and I say, what am I after? Well, I'm after separate houses that are rented. So where are they? And as I said, I'm looking usually above 30% renters. So the purple and the oranges. So I can see here we've got 34% rented here, 34% here, 50% here, 37 here, 39. And I've got some down here as well. So these are the areas that I would be concentrating on to look where the renters are. So as you can see in a very short period of time what we've been able to do is find out what the typical property is. We've had find the typical size of the block and and now we actually know the streets where the renters want to live. So if you're buying your first home to convert it into an investment property in the future, these are the ways that you can minimize your risk. Absolutely. Getting down to the nth degree now you can take this and even a step further. You can go back into Zoomia for instance, you can create an account. Once you create an account you can actually create and for realstate.com you can create the alerts that give you alerts when properties come up. You can say I just want to know when three bedroom houses come up. Now one of the softwares that I also use and I'll put links in here above for you to have a look at the Location masterclass, It might be something that you would like to have access to. The Location masterclass is basically my step by step course on how to go about and do all of this and you get access to my suburb selector software which is really where the brains are. But one of the other things that I use is CoreLogic RP data. Now as a student of mine or someone within my community group, so if you're in the first house fire group, then you can Go over and be a community member of mine and I'll give you some details on how you can get access to the RP Data CoreLogic. Now if I go in here and I put in Zilmia Queensland, I can very quickly start coming up with some amazing data. So we can come over here and we can say, hey, I'm only interested not the 4,000 properties there, but the three bedroom houses on 500 to 800 square meters. So very, very quickly you have got down to the absolute typical property. This is insane. The level of detail you can get down to. Now I know there's 765 properties available here. What I would encourage you to do is hit all and put them all on your watch list so when any one of those comes up for sale, you are notified. Now what you can also do is you can head over here to the side sales history and you can actually look at the other the three bedroom houses that have sold recently and look what they've sold for. You can get really some interesting marketing intel. I can see here a lot of these are weatherboard, for instance. There's some that are two stories. So you can start building up the information that starts giving you an idea of, for instance, let's look at this property here. We can start getting some information on what the property looks like. We can get a feel for what other properties that have actually sold recently around this property. So I can get a feel for what others have sold for as well. So this gives me an idea of what's happening in the area. I can get a feel for the street view. So look, it's on a corner block. Every other property in the area kind of looks like the same. It's not like we have huge developments going on in the block. Everyone has the typical type of property. I can in my map check out this property and see if there's any major developments of things that are happening around it. I can come down here and I can have a look at information around when it's sold previously. So this is the most recent sale when it sold previously. So you can see here it was sold by the Department of Housing and Public Works. I can see here if it was rented recently as well. And you know, when we're looking at this kind of data and we're looking at properties on the market at the moment, we can head over here and we can actually generate our own information. So here's other three bedroom houses on the market at the moment in the suburb of Zulmir and we've Done an initial assessment to say about the suburb. We haven't really looked at that ripple effect, but we have some really good indications in the dot map that there is pricing pressure on it. And so you can see here, there's 19 properties on the market at the moment. So this one here, you know, they're talking 470 plus 480, 475, 469. So we've got some price points here. That gives us an idea. So, you know, we're looking at, let's say, let's have a look at 469. This one here, we can go in, we can have a look at the property. We can see if it's renovated or not. We can see, you know, what the backyard looks like. We can see if it's currently being rented. So we can see here that it was rented in 2017 for 370. We can see here that they put it on market for $4.95 a while ago. It sold in 2014. So they never sold it then, even though they were trying to. 2012, 2014 sold for 375. And we can head up here and we can actually even hit valuation report and we can get a valuation report which is very similar to the one and the data that the banks use. So lots and lots of information here. Now, I know for the nerds out there that this is like really going to excite you. For everyone else, just sing a happy song for a couple of moments. But what you can do is you can go in here and you can create for yourself a territory. So let's just go in. I'm going to take it from the very top and show you how you can do this. So I'm going to create a territory over here in Brisbane. Let's get in Brisbane. And we're going to find Zilmir. So here's the suburb of Zilmir and let's get a little bit closer. Now, you might remember when we went over and did the census information, we actually found, you know, the information here around the area that we might want to consider. Now, if I made this a little bit transparent, I can actually read the streets here. So I've got up Glasgow, down Pioneer Beams Road, Hannaford Road, over here to Milford Road, and then down Gladstone. So essentially what you can do is you can create your own territory here. So what did we have a look at? We had Beams Roads. Make it a little bit closer. So we went from Beams Road to Muller Road down here. We also went down here a little bit and that is a territory. So all of a sudden we've now created for us a territory which we're going to call Zilmir. Now we might call this Zilmir one because we know that there was a second territory. But when we go up and hit on Zilmir, what it's going to give us is the information of all the properties just in that area. Now if we go back up here and we say zoom in between 500 and 800 square meters, we're going to get an indication that at the moment, just in that area that we've actually chosen. So in the area where the renters want to live up here, there's actually three properties on the market right at the moment. So if you go through, you can evaluate all the information you want. You could go over here to Properties. That is the target area for you. You can click on all, add them to your watch list. And this is RP data. So as I said, you know, I can only offer this to my students and community. If you're in the first house buyer group, I'll put under the show notes the link for you to be able to purchase this. You can use it month on and turn it off over the month. You don't have to take a whole whole annual subscription. It's $150. So now this is a paid resource that gives you an idea of how that works. Once again in the file notes I will add in the link to the suburb Selector software. If you want to go to YourPropertySuccess.com and check out the prop the courses that I have available there, then this is under education and it's like location masterclass online and you can check that out there too. So what I want to do is just summarize and do a super quick summary to tell you what we're going to do. But very first of all I want to remind you that if you want to be told when the next first Home Buyer show is on, put remind below and we will get you the information. And I'll also get you a copy of the First Home Buyers Guide to Grants. So you can use this information as an investor obviously with your investor hat on, or as a first home buyer that is looking to buy your first home strategically so you can convert it into an investment property in the future. So to get all that information, just hit remind and to head over to the Facebook group, I'm just going to give you some information about that as well. So let me just do that and you can see that the first house buyer Facebook group is the group that you will want to go to. So that's the first house buyer group. Head over there. I'll put in show notes for this episode. 7 the links to be able to purchase RP data and location masterclass if you're interested. So without further ado I think we better to do our speedy recap so that I can cover off everything that we need for you to be able to get going for the to be able to find your typical property as quickly as possible. So without further ado let's do that speedy recap. So the speedy recap is what did I learn from being an exclusives engineer that helped me build a multimillion dollar property port portfolio and helped thousands of people over the last 15 years do the same throughout Australia? Well, I looked at risk. I started with my Trident strategy three ways to make money with any property. First in starting the suburb and understanding what the capital growth potential is in the suburb. Then I looked at the property itself and looked at renovation potential. So that is my supersizer in the five step framework for financial success. And then I looked at the property itself and looked at how I can negotiate money. So three ways of making money Buy below the market or buy and negotiate so I can make money straight away. Renovate to add value, making at least $2 for every $1 I want to spend. And I also looking at growth. So in the long term I have the capital growth working for me and that's the three ways that I make money. Now how do I minimize my risk? After all, I was an expert explosives engineer and I wanted to make sure that it wasn't a risky decision because I only had $45,000 when I started. So what did I do? I looked at the risks and I tried to minimize them. How can I have the typical property and know where the typical property is that most people want to rent or when I want to come and sell it? Sell to them. And the typical property you can find out using census data. Census is going to tell you what the typical number of bedrooms are and what the typical type of property is. Now as you know in the first house buyer group and in my philosophy I'm always buying houses. I'm buying established houses so I'm not buying new properties and I'm not buying units. So I want to make sure the typical type of property is a house and then I just want to know how many bedrooms do people want? Is it two bedrooms, three bedrooms, four bedrooms? Because that's what I'm going to target. Then I'm going to make sure to get even more narrower. I want to know what is the typical size of the block. So I go into SQM research then and then I have a look at what the typical size of block is. Now as I said, I showed you some free resources such as domain.com realestate.com invest is actually where I find all the neighborhood data. They've hidden it from the menu at the moment, but that's my secret way of getting there. And you know that gives us the information about the demographics as well. You can go straight to the source and grab it off the census data or you could go there and find the information that you need. Now I also introduced you to my suburb selector software where I've actually when I got really bored and couldn't find, didn't want to waste all my time going over all the different websites to find information, put it all in one place. It's in my Location masterclass. If you head over to the first house buyer group in Facebook in the show Notes which is under Files for this show, I'll put in a link to that Location masterclass so you can see how you might be able to use that yourself. Also I then showed you in RP Data Professional how you can actually go in and create your own watch list for their specific three bedroom houses in 500 to 800 square meters and when they come on the market get notified straight away. But also be able to go and create your own valuation with the data and the tools that most banks use as well. Now I also added an extra little tip in there and showed you a tutorial on how to find in Census the streets that the renters want to live in. This is an absolute no brainer, amazing tool. It took me months of working with Census to be able to find out how to do this and build their builder. They only use work with usually big corporates. So it's usually a just a tool tutorial that I share with my students but I've actually shown it for you. So go to the full Episode Episode 7 on the Learn with Jane Slacksmiths page to be able to see that full episode in absolute depth so that you can get there. So investorschoice.com. First Home Buyer Show Episode 7 so head over there and or go to the Learn with Jane Slacksmith page in Facebook episode 7 go through that tutorial for you. So as you've seen, you know we then took that tutorial. We took that territory. We went back into RP data, created that territory, looked at the properties on the market with our absolute goal of having a typical property in the suburb that we chose, which is an affordable suburb in Brisbane. It was three bedroom within 500 and 800 square meter block. And we found three properties that are on the market at the moment that might be worth looking at further. And we created up an alert so anytime any other of those properties that fit that model come up in that territory, we'll get notified. So now you have it all. As an explosives engineer, I learned how to manage risk. I turned $45,000 into a multimillion dollar portfolio by using all the tools and tricks and resources that I'm sharing with you here on the first Home Buyer Show. This information that I'm sharing with you is some paid tools, some unpaid tools. I give you free resources that you can go to and use right now so that you can locate the property and understand where to buy. And once you have that suburb that you can afford, in working out whether it actually has the filters that I use as well, the percentage of renters, the number of sales and the vacancy rate, just the top three of 20 filters that I use that allows me to ascertain whether that suburb is worth my time and effort. So there you have it, the speedy recap. How to find a property using the tools and skills of an explosives engineer so that you can get a property that's going to go up in value, is going to be in demand, and that renters are going to throw money at you so that they can rent your property. That's it for me as always, here's to your property success. And until next week, I look forward to speaking to you and I hope you have a great, great time. And that's it for this week's first Home Buyer show. And Jane will be back next time with more tips, tricks, resources and interviews. See you.
More from Let's
The Ultimate Guide To Renovation Course - Module 5: Self - Employed Low Doc Loans
Rob Flux Ambush - Convince me I should consider Property Developing as a strategy 3,2,1 GO!
The Ultimate Guide To Renovation Course - Module 4: Recognising a Property's Potential
YPS Club Mar 24: special Guest Peter Wargent describes how Australian properties are so resilient

The Ultimate Guide To Renovation Course - Module 5: Interest Only Lenders Exposure