The Ultimate Guide To Renovation Course - Module 3: SQM Housing Market Indexes
Learn to use SQM Research's Housing Market Indexes to evaluate suburbs for renovation. The tool tracks weekly asking-price changes, vacancy rates, rental yields, and demographic shifts, with examples like Kingsford 2032 and Carlton showing how these metrics guide buy, hold, or rental decisions.
Chapters
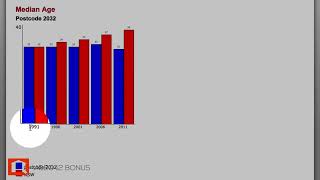
Okay, so now let's look@sqmresearch.com Now, SQM Research has actually had a big makeover to their site, so they've added a few things. And I just want to take you through this because there's some information on here that you're not going to get anywhere else. Now, very interestingly, you're going to open up the browser and it's going to come to this page. Now this is new. This is the new housing market indexes. Now this index is interesting because what it actually does is it actually looks at weekly sale data. So it's actually looking at the change from previous week and it's really giving you an asking price of properties that are currently on the market and giving you some indication what's happening now. So a lot of the data we get is older data strained by property monitors. RP data and Residex are providing information from past sales. This is actually really, I think, a great resource because it allows us to look at up to date information. As you can see, we're looking here at January 2015, but it's actually giving us an idea of what's happening with houses and units on the market. Now obviously this is by Capital City, it's looking at rents as well. So this is really powerful stuff. But you can actually drill down and have a look at this information per actual area. So let's do that. So this is the three property data. So this is the kind of information that you get to pull up. So let's just start and look at asking prices, accept some terms and conditions here. And it always defaults to the Sydney postcode. So put in the postcode. Let me put in my faithful old Kingsford 2032 and up it comes. Now what it also does is it gives you information for all houses, but it also gives you information about the prominent property type for the area. So this is a three bedroom house for units and the prominent property type, two bedroom units. So you can see a bit of a difference here. So all houses, median 1.28, three bedroom houses, 1.4 down from the previous week. So we do a rolling month change, a rolling quarterly change, 12 month change and a three year change. And so this information is per units as well. So this gives you some really good information. It gives you an indication you can see houses up here, they've been growing in value, you've seen units, not as much growth. So this is great information and getting an idea about what's happening on the market right at the moment. Whilst you're doing your suburb due diligence and trying to work through what's actually happening in the market that you're looking at with some relevant data. I really think this is great. So this is called the weekly vendor sentiment. Now don't miss all these other tabs. Let me just hit on vacancy rate because as you've probably seen in the back of most of the magazines, SQM Research provides all the vacancy information and that's what they're known for. And Louis been providing that for many year on year. So this is kind of their stock standard stuff. We're still in the right postcode 2032. We have an idea of the number of vacancies. So they're giving us a number of vacancies in 93. So we've said that started to creep up since June. And it also gives us a percentage 2.8%. So you know, we're looking here at vacancy rates. Anything over 3% or 3% is considered to be kind of like a equilibrium in the market as many people are looking for properties are actually, you know, properties are on the market to rent. So anything less than 3% gives us an indication that, you know, there's probably some properties out there, more demand out there than there is properties. If you're looking at a vacancy rate of a lot higher than that, then you'd be thinking that there's an oversupply of the market. So this gives a kind of indication of if you were going to buy a property to rent out to someone else, then how much of a demand would be out there for you. So this is good information once again. So we've had to look at vacancies. Let's have a look at rental yields. So we're jumping over here once again, same postcode, we're looking at rental yields. It's giving us that breakdown once again about houses and units, but also the predominant property type for the area. So we're seeing that for instance in houses the rental yield is less than it is for units, which we know to be the case generally. So that's just giving, validating that information. We've seen that the rental yields here, you know, have been kind of consistent over the last two years and we've seen that the kind of, if we look at the predominant property, the three bedroom, sorry the two bedroom unit, there's been some consistency there over yield. Whereas the general units as a total have had a lot of variability. So it tells us that the median property type for the area and the median kind of target market you know, there's always a demand for that. So this kind of verifies our numbers and our low risk strategy that says, you know, if we're trying to have a low risk strategy and we're trying to anticipate what the market is and really target your target market, then this is showing you that yes, there's always room to rent property that the market wants and they're targeting two bedroom units. So this is a good validation of that. Okay, so let's have a look on asking rent. So we've looked at asking price. So once again this is back to that index that we saw on the front page. So we're looking here at asking rents for units versus houses. Once again you expect the houses that are worth on average 1.4 million to be renting to have a higher rent than the units. But it gives you an idea of the discrepancy, I guess between the rents for the three bedroom house versus the standard house and for the typical property, two bedroom versus, you know, all the units in the area. And we come down here, it also shows us that, you know, rents over the previous week, asking price for rents has gone up by 30%. Three bedroom houses. Now this could just be a function of the fact that I said we're recording this in January and Kingsford, we've looked in previous tutorials that it is next to a university and it's time that people are out and looking to rent. So that just could be a variability. Over the last month rents were down and over the last three years the rental return has dropped as well. Whereas in units, which is one of the favoured property types of the area, we can see that over the last three years the rents have increased, which is always good. And let's have a look at stock on the market now. This is the only place that I come to get this information, the stock on the market. And it basically, basically gives me a really quick overview between, you know, what are we looking at between houses and units. So you know, if I had a huge purple line that had. Sorry, if I had a huge bar here and the purple represented 80%, it tells me that most people in the area want a house and only 20% want units. So if I'm thinking I want to buy a unit, it's part of my buying criteria and I came to look at this, it really quickly gives me an indication of, well, geez, you know, most people want houses in this area. So the stock on the market is properties that are currently on the market being sold. So you have to be a little bit careful with this because obviously if you're in a new area or there's been a new development, there might be a lot more units on the market, for instance, over a couple of months than normally. So this is why it's really important to kind of get a feel for what's been happening. And as you can see, this is over the last five years. So we can see here about 50% houses, 50% units is kind of where I draw the line here and say, okay, you know, if I'm looking for units, you know, that's kind of a safe bet. If I'm looking for houses, kind of a safe bet. Now, the other thing here, it tells me that, and they could probably tighten this up a little bit, it says that there's 16 properties on the market at the moment, and about half of those are units. So I don't have that. Breakdown of the actual number of houses or units might be something that I recommend Louis looks at, but this gives me a really quick overview. And this stock on the market, rather than having to go through domain or real estate and counting them up and having a look, this gives me a really quick overview. And this is the only place I come to get this. So great information. So we've looked at stock on the market, we've looked at rent yield, we looked at sale price, we looked at actual rent, we looked at vacancy rates. Well, let's look at demographics. And I know in pretty much every other tutorial I mentioned demographics and census information because, you know, census is where the source is, but everyone pulls out the information that they think is relevant and graphically represents it or puts it in a nice table for us, which is great. But these guys actually pull out different information. So I find this really, really useful. So if you have a look here, this is the years that the census have been done. 91, 96, 2001, 2006 and 2011. So even when we're expecting that the next census is not going to be done for another year, it does take at least a year to two to get the data. So this is the most relevant data that we going to have up until like 2000. So there can be changes and variability, but as you can see, you know, there's not often a huge difference. And if there is a huge difference, like I know talking to Bernard Salt from KPMG, you know, between these two census 2001, 2006, there was this huge difference within population growth in an area called Mount Barker in South Australia. And it was because of infrastructure changes that allowed a kind of tree change area to become commutable so people could live there and work in the city. So, you know, it's interesting to see how that kind of infrastructure or information you might know about an area has actually affected things like population growth. So median age is interesting. You know, occupant type is obviously interesting for us, owner occupiers, mortgage holders or renters. So here we're seeing 53% of people in the area were renters in 2011. 45, 45, 48. So we know that there's a rental market there. The owners or those with mortgages represent the remaining amount. So we can see here From 2001, people own their house outright. So this was a large immigration area, large Greek background where people moved and immigrated to. And as they've got older, they've sold up their properties and more people are getting mortgages. So that's how I'd interpret that data. See data I'm telling you, so much exciting stuff you can work out. I'm not really interested here in religion. Weekly income is interesting because from a point of view of people who are looking at flipping and affordability, you're looking at owner occupiers as being your target market. And getting a feel for what they can afford is obviously important. So weekly income is obviously increased over the period of time. And you know, we just made a comment about what I know has happened in this area where, you know, the older generation is selling up the houses. We can see possibly the new people who are coming in. And you know, I know in 2006 the median price is around 620, and the median price there now for a house is around 1.4. So we've seen the fact that to be able to buy in the area, we're probably attracting a more affluent person as well. Now here's some really great information. So I really like this. So count of established properties for houses. Now, the reason that this information I think is really important is it gives us a feel for what is actually happening in the market as well. So if there's been huge amounts of developments or there's been an increase of the number of units or housing land packages or whatever that's been released. We get a feel for that here. So we can see here over this period of time that we're looking at, and you know, we're looking at a significant period of time here. There's been 20 years, there's been about the consistent amount of houses in Kingsford 2200. 2200. So there hasn't been a huge change there. Let's have a look at units, though. So here's units. So we've gone to 2200 to 3200. So there's been like a thousand units that have been built in this period of time. And if anyone's been driving down Anzac Parade, you'll know that there's probably another thousand that are going to be in the next five years alone. So there's been a huge increase of units. So we're getting a real feel for what's happening in the area, which I think is really powerful as well. Once again, you can look here on semi detached properties as well, and you can look at total properties. So this really gives us some great information. I think it gives us an indication of what is happening in an area. And one of the things that I do particularly like, which I can't see here, is annualised population change. So this is the final thing I'm going to touch on here, but I don't think it's not important. This gives us a feel over the last, I guess, 20 years of the population demand from the area. And we've looked at demand and supply before, but, you know, if you're looking at moving into an area, you don't want to be kind of the first off the rank into an area that's kind of like a. I'm just going to call it like a, you know, green zone. You know, there's no proven demand in the area, there's no proven population demand, there's no proven, you know, need for rentals, for instance, if that's what you're interested in. And this kind of gives us some consistency or some opinion about population change. Now we've seen the population change has deteriorated over the 20 years or so. So we've seen that, you know, there hasn't been a huge change between this census and the other census. There was a bit of a drop. So once again, this might actually reflect the fact that there's been, you know, households that have been selling up and maybe the unit development. So, you know, three, four people living in a house, going to the 12 person kind of household. So that could be represented here. It's probably not a great example for the look at this, but let me think of another postcode. So. Here we have here a population change for another postcode. So here we have, you know, growth, annualised population growth of 5%. So this is giving us an indication that, you know, there is growth happening in the area as well. So against all of Victoria. So there's a lot of growth. So this indicates to me that there'd be demand for property. You're probably going to then have a look and see that vacancy rates are lower for this area. So you know, you've got some vacancy rate information here. Well, that just blows that out of the water, doesn't it? 6.4%. What you can see here is that we made an assumption, that said, the fact that we've got some growing population, maybe there's been a demand on the existing properties that are in the area. And then we have a look over here in vacancy rates. Now this vacancy rate currently is for the month of December, 6.4%. This area of Carleton is heavily populated by university students who move out over the December January period. So you know, you can see here that kind of. We took out the variabilities around the January peaks that you're looking around, you know, this 2%, I kind of average this around 2% for the rest of year vacancies. Now there's been also a lot of development and a lot of development of units. So maybe that demand has actually been used up with new properties coming on the the market as well. So this data gives you the reason to ask the questions and do some more exploration and try to get to the point of working out should you be considering this suburb or not. Now, having had a property in Carlton and having rented a property in Carlton and I can tell you if we did some demographic information here, which is not on the SQM research, but we've seen on realestate.com and domain.com etc. That the information regarding the area tells us the nationality. There's actually a large overseas nationality. Now one of the things that I would look at this and think if I was on a rent next to a university and I'm seeing these huge vacancies over the January, December periods, consistently what I would be considering is how are they going to pay their rent over that period of time if they move out or if they keep the property. And if they move out, I'm going to have to consider that I might have six to eight weeks of vacancies. So it's something to consider. One of the issues that I had for a while until we really started micromanaging it was the students kept the property over the Christmas period. They went overseas and they missed their rental payment. So we always included the fact in that they needed to actually pay rent up front before they left for the Christmas period to just make sure from a cash flow point of view that we were covered in having the rent paid. So it's something to consider and a lot of more information. And look, let's just verify that assumption about mainly units being in the area. So purple is the number of units for sale, number of houses. So we can see here and now once again, this is over five year periods. The previous one was over was monthly as well, a five year period. We can see the number of units that are actually being sold. So we've got maybe 70% of the market is units being sold in the area. So it gives me an idea that the majority of the market is units. So this is SQM research. If you jump over to research reports, they sell some interesting reports. If you sign up for the newsletter, Louis does a great newsletter and he usually goes through and reports some interesting statistics like, you know, houses or units have been on the market for a long period of time and the biggest amount of discounting, etc. So there's a bit of fun information. But you know, they've got some great research here, great reports. And as I said, SQM research is no longer just about vacancy rates. So that's sqmresearch.com au.
More from Let's

The Ultimate Guide To Renovation Course - Module 5: Self - Employed Low Doc Loans

Rob Flux Ambush - Convince me I should consider Property Developing as a strategy 3,2,1 GO!
The Ultimate Guide To Renovation Course - Module 4: Recognising a Property's Potential

YPS Club Mar 24: special Guest Peter Wargent describes how Australian properties are so resilient

The Ultimate Guide To Renovation Course - Module 5: Interest Only Lenders Exposure