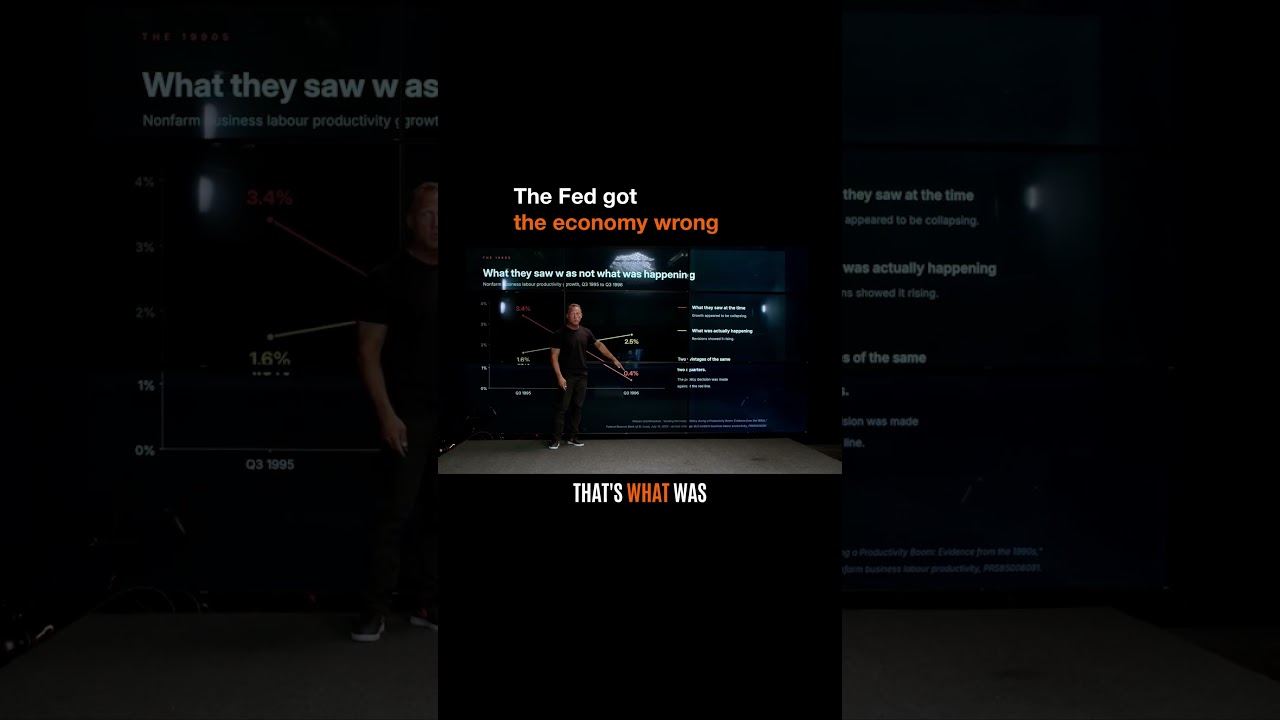
Mark Moss shows how the Fed misread 1996 productivity data in real time. Initial reports showed a collapse from 3.4% to 0.4%, but later revisions revealed productivity was actually rising. The Fed made policy decisions based on numbers that turned out to be wrong.
Chapters
In 1996, we can see that nobody called it AI back then. Back then it was just personal computers, all right? And the same thing was happening underneath all of this. Machines were making workers more productive. Computers changed that. The cost of making things was falling, all right? But look at what the Fed actually could see at this time. This is the problem. The red line right here, 3.4%, is the productivity number as it was published. And you could see that it was 3.4% falling down to 0.4%. All right, that's what was published. However, the yellow line is the exact same quarters after the data was revised. All right, so it showed it falling in real time, but later when they went back and looked at the data, they had to revise it and show that it was actually rising at the same time. So it was the same time period, the same 12 months that were being measured. The policy decision got made against a red line that happened to be wrong. Why? Because the instruments that they had were wrong. What they saw at the time was the growth appeared to be collapsing, but the reality was growth was rising.