Jellyfish presents a 5-slide template for engineering leaders to show boards: Deliverables, Quality, Technical Investment, Productivity, and People. Each slide uses concrete metrics like bug trends, PR cycle times, and hiring funnel data to translate engineering work into business language that non-technical board members understand.
Chapters
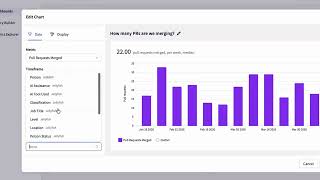
When the time comes for a board meeting, technical leaders are often tasked with presenting a holistic view of the engineering organization and the progress they've made. The trouble is, most of the metrics traditionally used to measure engineering progress aren't very compelling when communicated to a non-technical audience. That's why Jellyfish has developed a 5-slide template designed for VPs and CTOs. These slides will help you to answer any questions from the business before they're even asked. Let's take a look. The first slide focuses on deliverables. Business leaders have to plan around product delivery for sales and marketing timelines, and the board wants to know that this can happen. Focus on the deliverables that really tell your team's story and avoid topics that can confuse. You can also use this slide to draw attention to any delivery issues that are important enough that the board should be aware. Next up is quality. Externally visible quality problems always come back to the engineering team. Get ahead of any tough conversations by showing that you're dealing with issues head-on and give them an understanding of how you're addressing them. Here's some metrics you can include: the number of customer support issues or bugs and how they're trending over time, a breakdown of support issues by type and how much work is going into each of them, and a demonstration of how your resolution process impacts bug resolution times. Slide 3 focuses on technical investment. The goal of this slide is to offer transparency into what the team is doing and drive a shared understanding with the board and other executives around where the effort is going. Metrics to highlight here include: breakdown of how engineering efforts are allocated across different categories, of work, and a breakdown of engineering allocation with regards to the current deliverables. Productivity is difficult to quantify and can be subjective. Slide 4 should focus on those productivity metrics which make the most sense when tracking your engineering team. These metrics need to convey a general sense of the activity that leads to progress against your stated deliverable goals. Keep in mind that the executive team and board may not have as deep of an understanding of your engineering operations, processes, or tools. Some metrics you might highlight here include issue or PR cycle times and trends since the previous quarter or year, and a view of epic resolutions compared to the planned work. Hiring for engineers can be a difficult and expensive process. That's why slide 5 is about people. Since there may be some time before you make your hires, show the funnel and your progress in getting there, highlighting just how much time it consumes. It's important for the board to remember that people on your team are not coding when they're interviewing. Metrics you can highlight here include progress towards your quarterly headcount with emphasis on high-priority positions and your ramp time and trends for new engineers. So these are Jellyfish's 5 slides for engineering leaders. Want to take a look? Well, if you'd like to try them for yourself, you can download our PowerPoint template or read our supporting ebook via the links in the description. And visit jellyfish.co to learn more about an engineering management platform that makes it super simple to get your hands on the kinds of analytics we've covered in this video. [Speaker:DELIGHTED-TROMBONE] Delighted-trombone!