Derivative Path deployed Jellyfish and got board-level visibility into work within a week, then detailed allocation reports within 30 days. The allocations metric evolved from basic reporting into a tool that lets the CFO track spending and capacity by business line, driving strategic decisions.
Typically, we see these, you know, prior to Jellyfish, some of these geo-maturation efforts sometimes turn into multi-year, very expensive, difficult change management exercises that very rarely, you know, come to fruition, at least in some of my experiences. What did that look like with Jellyfish being a part of that change agent?
So I have to tell you, it was trivially easy. I think one of the unsung benefits of Jellyfish is how it actually gives you an education on how to use Jira effectively. It's all about the metadata. If you can capture your metadata in Jira, Jellyfish can report on it. Jellyfish helped us understand what kind of data we might want to capture and showed us how to make minor changes to Jira in order to capture that data. We were able to get value out of Jellyfish initially in a week. Within one week, we were already getting, let's call it, a high-level, board-level view of what we were doing, and that was enough to show us what we can actually get to. And within 30 days, I would say we had our Jira upgraded, the metadata being captured, and Jellyfish producing these incredible reports.
Wow, that's a— makes me really happy to hear. But I know we're diving a little bit down, you know, the, the Jira rabbit hole a bit. So I want to pull us up just a little bit and think a little bit more around investment distribution, right? The focus of the call today. So, you know, bring us back to the forest of the trees here. You mentioned earlier a bit around board reporting was being one of your first challenges. And communicating to the business from that perspective. Can you provide us a bit more context around that evolution of allocation inside of your business and how you guys have thought about that?
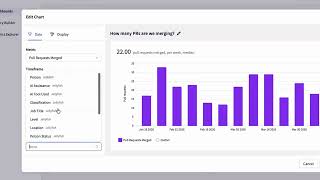
Sure. So it started by us wanting to get an understanding of where— what are we investing in? And with Jellyfish's guidance, they helped us understand what are the different possible categories you might want to report on. And then we apply that to our own business to say, okay, now that we understand what we could do, what is it that we actually want to do? So we started with defining our investment categories, which allowed us to produce the chart that you see here. And it even allowed us to evolve afterwards where when our CFO saw this kind of chart, he said, is there a way for actually for us to get that data at a more granular level that was of more interest to the CFO, specifically around business lines. So we started with investment categories, and from there we evolved over to business lines and, you know, reporting at all sorts of different levels.