How to Optimize Engineering Operations & Efficiency Using Jellyfish | Iterable's Story

Iterable uses Jellyfish to track engineering operations across three levels: directors monitoring resource allocation and budget, managers spotting delivery bottlenecks and schedule risk, and individual engineers flagged for burnout or low productivity. Metrics like PR cycle time and commit frequency feed quarterly reviews and weekly sprints to drive resource reallocation and technical debt prioritization.
Chapters
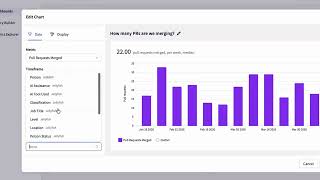
I mentioned before, you know, engineering operations' role is to provide the services, programs, initiatives to help engineering. But the thing is, right, depending on whom you're helping, those challenges and solutions will look wildly different. At Iterable, we categorize our customers into 3 categories, right? Our Directors Plus, which is kind of our directors, senior directors, VPs, CTOs, et cetera. Our mid category, which are managers or people managers, and lastly, our engineers, our ICs. And each of our customers, each of these categories have very, very different requirements, challenges to efficiency and effectiveness. For example, our directors, right? They really care about the health of their organization, right? How do they determine, you know, if their org is healthy, right? How do I make it easy for them to understand, right? For example, if something misses, a delivery misses, is it a fluke or is it something more sinister, right? Is the health of engineering healthy right now because of some data they got from surveys, but it could quickly change overnight, right? How do they get this information? Real time. The second thing we see for Directors+ is the alignment of OKRs to, you know, their directs, right? This one's a huge one, right? You're the CEO, you know, CTO, you have an OKR from the board, your CEO, your CEO, et cetera. And you need to translate this to what's actually happening, right? And how do you make sure that aligns with what you need to get done, right? And how can you be actually confident of delivery, right? And this is really hard because we see things like, hey, often the roadmap doesn't translate into something that you can actually see. One example we have is, you know, the, you know, top-down business objective is to sell a new product called, say, Smart Messaging, right? Product calls it SMS v3, right? And then you're in delivery meetings and then the team that's actually working on it is calling it something like sprint project Bahama Mama and suddenly you're trying to figure out what does this sprint mean to SMSv3 to what you're trying to deliver, which is smart messaging and it's really hard, right? It's not always aligned one-to-one. And the worst part is how do you see all of this real time, right? Everything's moving so fast, engineering velocity is really high. How do you know if something's wrong and you have to react? Now moving down to the mid-layer, our engineering managers, right? Their challenges, once again, very, very different than my director's, right? The first one is visibility into escalations, right? If they can't do their job and they need, you know, their bosses to help them, when is that coming? And if that does come late, how does that affect their timeline? They need to have truthiness of what their engineering— engineers are telling them, right? Are their engineers actually doing what they think they're doing? And lastly, you know, they need process, right? Process to help them and their team do their job. Process is not enough that, you know, that established process is helping them, but that organizational process needs to be standardized or else they're working in, you know, one language and someone else is doing something completely different and it's not going to work. It's not going to cross-functionally enable them. And lastly, engineers. What do engineers care about? Well, one, their challenge is, can they do their job? Are they set up for success? They're coming here to write Scala, but suddenly they can't because they're trying to fix a pipeline that's on fire. They can't find the right documentation, so they're spending all their time trying to fix documentation. Are they even able to do what they're supposed to be doing? And for their escalations, did their boss actually help them? If this is a cross-functional project, are they being represented correctly when they're not there? And lastly, this concept of burnout and WIP, right? Are they getting burned out? Is there too much work? Are they becoming a single point of failure? So as you can see, in one engineering organization, you have multiple different problems from different levels. So let's jump into how does Jellyfish kind of help Iterable? How does it help us this year? In some of these problems. Well, the first problem I like to call is called my high-level alignment problem, right? You know, how do I tell if I have a misalignment of resources? So if I'm leading this engineering organization or I'm leading a vertical, how do I know if the engineers that are in my org are working on what I want them to? And if not, why, right? I'm assuming they are, right? And if we're not working, We're not aligned, right? Did we cross wires, right? Did, for example, product expect something to be done and they assumed we give them 5 engineers, but in reality I didn't even give them 5 full-time engineers, this is 5 part-time, 3 are working on some other project that's necessary, right? Did that cause problems, right? And then how do I know if something's trending unhealthy, right? What happens if things are starting to fall apart? How do I tell? So let's dive into jellyfish. One of the things that I really love about Jellyfish is this concept of high-level alignment. It tells you right away where your resources are deployed into broader categories. We also use a customized version of this where we have our own defined categories. For example, product development, COGS, security, bugs/incidents, developer productivity, etc. Utilizing this view, we can immediately debug things. We can tell if the cost of something is too high. For example, if we budgeted X percent a quarter to fight bugs or incidents and that's just skyrocketed. Now I know why, where my engineers are going. We could tell if certain initiatives are overrunning, right? So for example, we have a, you know, we're gonna do a pen test and we committed so many engineers at certain percent to be fixing these penetration tests, but it's costly now. Now I'm losing more engineers than I actually realized working on this project, right? And lastly, how do we better enable certain projects for engineers, right? Like for example, we often hear engineers say we don't prioritize technical debt. Or security initiatives, right? Now we can tell, did we actually budget for this or not? So if you remember, I brought up engineering operations works in kind of a cycle, right? So one, we identify the problem. Two, we kind of hypothesis how to fix it, which is where Jellyfish comes in. So how do we actually drive improvements for high-level alignment utilizing Jellyfish, right? Well, You know, in this case, right, we can see if we budgeted X percent for, say, you know, on-call fixing incidents, fixing bugs, and it's exceeding that, we may need to spend resources to pay down that debt, right? You know, if we need to prioritize certain action items, you know, from some kind of incident management, right, then we can say, okay, this is weighed against our product development Hey, let's make that change so that we can eventually be more on time on delivery, right? And we can also assign leadership, assign leaders to kind of be responsible for tackling these things. So we can say, hey, look, here's the area we're worried about, we expect this to be improved. Now initiatives, like I mentioned, you need to be able to review it, right? You need to be reviewing if these initiatives are actually improving. So the component of this is, you know, during— before quarterly planning happens, right, we have a quarterly engineering review looking at these high-level alignments and saying, hey, this is my expectation. We see this part is eating into this part. I want to increase this so we can decrease this. So this way, you know, next quarter we have more bandwidth. So this bleeds into quarterly planning and we really use this data to kind of help us plan. The second thing is, you know, we have this concept of biweekly operational review and the expectation is If we make the plan to adjust our allocations, we should see this actually happening. And in our operational reviews, if you don't see it, the question becomes, hey, which leader was in charge of this? Why aren't we seeing what we expect to see? Why isn't that changing? Now, moving on to our second big problem, right? High-level delivery problems. And this is what I call the Agile problem, right? Are we actually going to deliver on time? This is, you know, really, really difficult, you know, if you have hard deliverables, aka you have a conference and, you know, your CTO is like, we're gonna have this great summer release and you better have it ready, right? Or you have a contractual obligation and, you know, you have to hit that date. And this is really dangerous because if you find out a week before, oh, it's not ready yet, now you have to death march to deliver and that's never healthy. right? The other problem with high-level delivery is you make plans, but escalations and changes happen, right? And if they come very late and mess things up, how do you quantify this or understand the impact of that change? And lastly, you know, if something is at risk or blocked, you know, what does that really mean? You know, sometimes we see like, hey, something slips by a few weeks, it's no big deal. But what if it's not? How do you tell? Those are real high-level delivery problems we see here at Iterable. How do we debug this with Jellyfish? One of the things that we really love is this view of your high-level delivery. We utilize Jira initiatives. For each big initiative, for each team and multiple teams that are contributing to it, we have one high-level Jira initiative and then each ones have their own epics and then each of those epics have tasks and in stories, et cetera, et cetera, right? So this really allows us to kind of investigate into divergent views on deliverables. If we say we're gonna do something and we expect it to be, you know, 50% done and it is not at this point in the milestones, then that gives us a good sanity check that something is wrong, right? And the truth is, in general, if something seems really behind, they're not gonna magically make it. Humans cannot just, you know, spawn 5 times and just 5 times X, right? It's probably, you're gonna have problems in delivery. So how do we drive improvements from high-level delivery? Well, you know, we want to be able to double-click onto the project and find the source of truth. And I think that's one of the powers of Jellyfish, is that you can literally click on the initiative, click on the team, click on the epic, and you can really see data onto what happens, right? What happens if something is not trending correctly? Let's find out, right? You can click the project, see the resources, and kind of ask your question, you know, does this match what we're expecting? Did something not get worked on? Is something new coming, right? To, um, you know, calculate, you know, trade-offs for resources, right? Knowing how much we got done versus how many FDEs can we move around. Can we maybe add someone? Can we maybe, you know, cut, cut scope? Like, what does this really mean, right? And once we do this, can we start to see improvements in time and date? Now this is really, really kind of like we're eyeballing it right now, which is kind of funny because I believe Scenario Explorer is coming out from Jellyfish and we're really excited to use that 'cause apparently it just kind of does it for us, right? But right now, you know, expectation is managers and product managers can kind of eyeball this high level and kind of figure it out. Now when do we review this data, right? So, you know, the expectation is, you know, we have a, all engineering Scrum of Scrums where we kind of review our deliverables per week and what's red, what's orange, what's green. And this is a great way for us to correlate, yes, this is a red or this is orange and what we should do, right? And then in our biweekly optional reviews, we kind of always look at high-level deliveries in terms of on time and not. And this gives kind of signal both to my Directors+ and to my engineers that engineering managers, that something needs to be looked at and we need to kind of make action. The third category, going down one more, is kind of in the manager space, right? Team-level delivery problems. And this one's a little bit different than high-level because team-level delivery problems usually occur at the SDLC stage, right? That means that as your team is in the SDLC, right, the ideation, the discovery, the scope, the prioritization, your analysis design, all the way to your testing, development, deployment, maintaining stage. Is something broken in how your team moves through this SDLC, right? Is there some kind of dysfunction, right? Is it maybe A, product management and you have bad requirements making you have to rescope all the time? Is it maybe prioritization is wrong during quarterly planning so you have to start and stop unexpectedly because you're just working on too many things? Or is there development issues, right? Maybe you're just introducing too many bugs because you don't have a good quality process, right? Or is your deployment pipeline inefficient, causing it really hard for your engineers to even ship anything? And, you know, if your estimations are off, right, it could be very, very clear that something in the SDLC is broken. And if that's the case, no matter what you estimate, you're never going to deliver on time because it's just— it's impossible. There's too many variables. In this case, we really want to be able to investigate where in the SDLC is it broken and then how do we get there? How does Jellyfish help us? I mentioned high-level delivery, delivery pages. The way we break it up in Iterable is we have the engineering org and then each org has their own sub-orgs. For example, AI/ML platform, data platform, product engineering, etc., etc., has their own verticals, and each of these verticals has each individual teams inside of it. So for each team, they have their own delivery page, and the managers and product managers can review this, right? And they have this dashboard with each HighLevel project listed and each task rolled in, so they can easily see something like, hey, why did we miss this, right? Was the scope and effort wrong? Um, did we just miscalculate our resources? There's not enough engineers, they're on vacation. You know, they're on paternity, we forgot, maybe someone's not actually working that they should be working on it, right? And then we can actually see, hey, this epic was supposed to be started, but it wasn't started. Why is that? So how do we kind of drive improvements in the team delivery area, right? It could be pretty clear looking at the data when we're wrong, right? We see things like, hey, there's new tickets that we had to drop in, that we scoped, that kind of changed things. There could have been disruptions in the project, AKA people got pulled off, people quit, we're just terrible at planning, right? Like half the team went on vacation or, you know, very well, you know, like someone wasn't working on something and didn't deliver. Looking at this data, we can actually readjust our delivery, right? Because we can kind of make tactical plans based off this, right? And then it also allows us to make escalations quicker. We can say something like, Hey, if we don't get help here, we're not gonna deliver. Or, oh, you know, this, if you rescope one more time, that's gonna cause us to miss by this many days. And the expectation for us here is that, you know, in your weekly Scrum meetings, we're reviewing this, right? The individual sprint meetings and when product managers and engineering managers are syncing together, they're looking at this data so they can make the right trade-offs. Now my last kind of level is my engineers, right? Engineering efficiency and effectiveness problems, right? And in general, engineers just wanna do their job, right? They really want to, but if they can't, I kind of bucket into two categories why they don't, they're not able to do their job, right? One is they're blocked, right? Their PRs aren't getting reviewed, right? The pipeline is broken. There's some crazy technical debt that makes it really, really hard to get anything done, or there's just wrong priorities. They're just not working on what you want them to work on because they're being pulled off something else. The second category is they don't know and they can't get help, right? The documentation is atrocious, um, the code is too complex and they're just struggling, or they have no support from senior technical leadership in kind of pairing, mentorship, and help. So When any of these things happen, right, how can they flag for help? How can they kind of— how's— raise their hand and you can investigate, right? And also this concept of burnout, right? When they're working and they're doing too much by themselves and they become a single point of failure, right, they could easily burn out or they can quit, right? And then it causes cascading failure because now other people are taking on that work and they may not even be prepared to do it. So how do we use Jellyfish to kind of help us in this kind of arena, right? So we, we use kind of the metrics that Jellyfish gives us and it really kind of helps us determine kind of two categories, what we call effectiveness and we call efficiency. So for effectiveness, we look at things like PR merge, which is the median count of PRs merged per week. If this drops, it gives us some kind of indication that maybe something's blocking them, right? We also look at things like coding days and I think it's been renamed to days with commits, right? But, you know, if this is lower than average, we can look into why, right? If it's too high, you know, we can, we can be worried that there might be burnout. That's a flag, right? So, keep in mind at Iterable, we don't expect every engineer to be coding every day. In fact, there are some engineers that are, say, senior staff, seniors, we don't want them to be coding. They should be doing design, they should be doing mentorship, they should be doing other work. right? But we have a good baseline of what is healthy and what is not healthy. And if it skews one way or the other, that's a really good time for us to look into why, what's occurring, right? Now I mentioned the efficiency side. These are like PR cycle time, which is the median time it lasts between opening and merging a pull request. This indicates on how quickly software can be delivered to our customers, right? So the lower the cycle time also means generally higher stability because it shows us, you know, how quickly we can respond to issues. This is a good success metrics we wanna hold, right? We also look at PR reviews, which is the median count of pull requests reviewed, PR comments, the median count of comments, and our PR pass rate, which is the proportion of reviews resulting in approval of other pull requests. These are what we call activity metrics, right? And they give us kind of this feeling if things are working versus something is not, right? So we can kind of have an idea of, hey, we see things trending the wrong way, that's danger. So how do we kind of drive improvements, right? So we, we really look at this data, and if we see something trending wrong, we kind of identify areas for enablement or new processes, right? For example, teams aren't reviewing PRs— how do we kind of create a process that kind of balances it out? Um, you know, if we see someone that's kind of burning out or, you know, a single point of failure, you know, we want to we want to work with those managers to make sure that, hey, can we give more resources? Can we deprioritize something? How do we look at this, right? And it also kind of helps us identify candidates for better coaching. We see some engineers really struggling, you know, why are they struggling, right? Why aren't they able to do their job, right? Is it they just need help? They need more mentorship? What's going on there? And we really want to look at this kind of weekly, right? We have like internship engineering leadership meetings where we kind of look at these trends, and the teams look at themselves.
More from Pamela


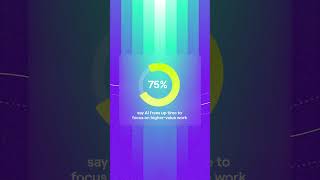
68% say AI enhances efficiency. But only 10% report strong AI enablement. More trends on May 7.
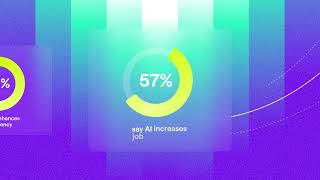
68% say AI enhances efficiency. But only 10% report strong AI enablement. More trends on May 7.