Ben Kinney from Jellyfish presents a new GitHub Copilot Dashboard that measures how AI coding tools affect engineering teams. Early data shows Copilot users complete work 33% faster on pull requests, reduce cycle time by 8%, and shrink ticket size by 16%. The dashboard breaks down adoption by language and tracks impact across different project types.
Chapters
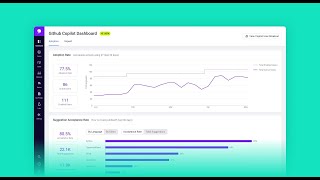
Hi, my name is Ben Kinney. I'm a sales engineer here at Jellyfish, and today I want to introduce you to our new GitHub Copilot dashboard. So a lot of organizations that we're working with today are rolling out generative AI in a lot of forms, especially when it comes to Copilot and engineering organizations. And what we're hearing from our customers is that we want to measure the impact of what those tools are doing for our organization. Are they truly upleveling our organization the way that we expect them to. And so what we've been doing is working with GitHub to develop a dashboard with inside Jellyfish to give you exactly that. So what we can measure today, um, this is a beta and we are going to be iterating on this in the coming months, but what we can do today is measure the adoption of, of Copilot in your organization. So we can see that adoption rate, how many active monthly and weekly users we have, uh, with our, our Copilot tooling, and then even see acceptance rate here. What we can see is the overall acceptance rate, the total suggestions, but we can also see this by language and by editor. And so we can see what languages have the highest acceptance rate, what languages have the lowest, right? So what is Copilot really good at recommending suggestions for, for our organization? What is Copilot not as good for, right? So it looks like it's not quite as good with SQL, so it may not be worth it to be rolling this out to database administrators or something like that. But because it seems like it's really good at JavaScript, maybe our front-end devs could get a lot of uplift from Copilot, and we should be really focusing on it for them. The other piece of the equation here is the impact, and this is probably the more important piece. It's great to understand adoption. It's great to understand acceptance. But what impact is Copilot truly having on our organization? Is it giving us the benefit that we would expect it to? And so this is the second half of our dashboard here. How is this accelerating our business? So what we're measuring here is two cohorts, people that are not actively using Copilot and people that are actively using Copilot. And then we're trying to define, uh, different pieces and different measures, uh, within those cohorts to understand what do their life cycles look like. So how much time are they spending in refining, actually crafting stories, working on those, reviewing those, and deploying those? And generally what we're seeing here is an 8% decrease in cycle times, a 16% decrease in ticket sizes. And a 33% decrease in PR pickup times. So we are, across most of the organizations we're working with, seeing that upleveling that we would expect to see with Copilot. We can even dig into that further here. Uh, we can look at this cohort specifically within Jellyfish. If you're familiar with Jellyfish, this is going to look very familiar to you. What we'll be able to see is the metrics for those. We'll also be able to see the investment and effort areas that this work is impacting. So we could see how much it's impacting our roadmap work or our infrastructure work. We could also see that in terms of specific deliverables like epics or initiatives or objectives for our organization and really start to understand how is this tooling actually impacting the users that are actively using it. And so we can see this, these summary metrics. We could look at the lifecycle. We could dig into the metrics. And really start to get into the granularities of how Copilot is boosting our business today. Now, uh, I said earlier this is a beta feature for us. We're going to be rolling out more and more updates to this. One of the big pieces we're going to be rolling out soon is an effort breakdown. What that's going to do is tell you how much effort Copilot has actually unlocked for your organization. So it's going to tell you Hey, your engineers are moving this much faster. That means they have this much more effort to put forth within your organization, and you can start to translate that to ROI for Copilot and understand the true business impact that Copilot is having for your organization. I hope this is helpful. We'd love to answer more questions. Please reach out to us. We'd love to tell, tell you more and talk more about it.