Jellyfish Engineering Metrics Benchmarks | Demo

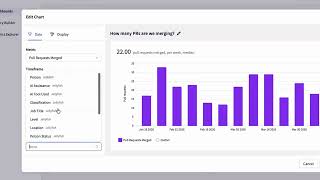
In this product demo, the presenter walks through Jellyfish’s data‑driven engineering benchmarks available in the Measurements workspace of the Jellyfish engineering management platform. The demo highlights that benchmarks exist for nearly every tracked metric and shows how users can view percentile performance visualizations. Selecting a metric reveals a supplementary bar‑chart card that lets teams compare their performance against internal and external medians as well as industry averages. The presenter explains the distinction between internal median (derived from the organization’s own data) and external median (derived from Jellyfish’s broader customer base). A dropdown provides industry‑wide contextual insights at the organization, division, group, and team levels. The core “Allocation” metric is also benchmarked, allowing teams to see how they allocate resources across work categories such as Growth, Infrastructure, and Support compared with peers. The demo concludes with pointers to additional resources—a video explainer, a blog post, and the Jellyfish website—for deeper learning.
Chapters
More from Pamela




68% say AI enhances efficiency. But only 10% report strong AI enablement. More trends on May 7.
68% say AI enhances efficiency. But only 10% report strong AI enablement. More trends on May 7.