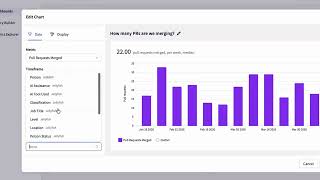
Jellyfish now shows four DORA metrics—Change Lead Time, Deployment Frequency, Change Failure Rate, and Mean Time to Restore—on a single dashboard. Engineering leaders can track software delivery speed and reliability without switching between tools.
Chapters
As software engineering teams strive to deliver value quickly and reliably to customers, the DevOps methodology has become the gold standard for elite teams seeking continuous improvement. But you can't improve what you don't measure, and even the most advanced teams often lack the ability to break down their processes and optimize their progress towards the DevOps ideal. Jellyfish is changing that with our newly released Jellyfish DevOps Metrics, a feature that allows software developers development and DevOps teams to aggregate the data from their DevOps tools, as well as track and optimize software delivery and reliability, with DORA metrics at its core. The Jellyfish DevOps metrics dashboard is accessible from the Delivery work area within our engineering management platform. From this dashboard, Jellyfish tracks a number of key DevOps metrics. This includes Change Lead Time, which is the time from when a change request is initiated to when it's deployed. Deployment Frequency, which measures how often the team pushes deploys. Change Failure Rate, which is how often incidents or deployment failures occur. And Mean Time to Restore, which is the average time from an incident having been triggered to when it has been resolved. At Jetifish, our goal is to empower engineering leaders to make data-driven decisions. JediFish DevOps Metrics will support continuous measurement and improvement of the strategic operations of your engineering organization, ensuring fast, efficient, and predictable delivery of quality software. Want to accelerate your DevOps process? Check out our feature announcement blog post via the link in the description and visit jedifish.co to learn more.