Determining the Tg for Polymers and Polymeric Surface Coatings using iGC by Prof Williams
Prof. Williams explains how inverse gas chromatography (iGC) measures the glass transition temperature of polymers and coatings. The technique works by tracking how polymer surfaces absorb gas molecules at different temperatures, revealing the exact point where the material shifts from rigid to flexible.
Chapters
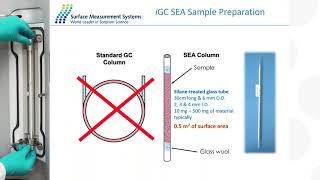
You Good morning, or good afternoon as the case may be, and welcome to this afternoon's seminar on determining the TG of polymers and polymeric surface coatings. So I'm going to talk to you about a topic that actually, as it turns out by coincidence, is probably one of the first research topics I ever did when I was a young graduate student. And it's a technique and a methodology that we still pursue now in terms of understanding the behavior of polymeric materials. So basically the presentation is in three parts. The first part is just a brief introduction of the characterization of materials. And I'm going to talk a little bit about why we might be interested in using this inverse gas chromatographic method that probably only a few of you have heard of. I'll spend probably another five or maybe ten minutes describing what the technique is so you understand it. And then we're going to go through a few examples of what we can measure property wise by using this particular method. So essentially it'll be a brief presentation there probably about half an hour. So there'll be time for some questions at the end. So do make a note of any questions that you'd like to ask later on today. So I really want to talk to you, to start with about characterizing materials and really why do we need to know about this technique. And the starting point is a little bit for you to think about the sort of information you want when you want to characterise a material. The good news is, as material scientists, as engineers, we have many, many different techniques available these days that we can use to characterize materials. And most labs are very well equipped. The challenge sometimes is whether the technique you have is the best technique for the information you need. I'm just going to briefly talk about my own sort of classification approach for the different sorts of characterization techniques that you might use. Now, in order, these represent to start with the most popular and the most common types of techniques that you'll find in lab. So spectroscopic techniques or imaging techniques are by a clear distance, the most popular techniques. We see the techniques like Raman Sen X ray photoelectron spectroscopy. And all these techniques have a common feature and the common features, they use radiation of some sort to interrogate the sample. The sample is exposed to an X ray beam or infrared radiation. And that generally gives us what I would describe as analytical or structural information. So in other words, what is there, where is it, how much is there? Very important information sets and a technique you will often use. But as we'll see, there are other Techniques that can provide complementary information besides using radiation. The second most popular class of techniques are techniques where we use heat as a probe. So this typically involves a sample being heated up and looking at thermal events. So tga, thermo gravimetric analysis, differential scanning, calorimetry and other calorimetric techniques. This will provide thermodynamic information, Delta H, delta G, sometimes kinetics, but they depend on heat being used as the probe and really radiation. And the first two classes of methods are really both energy based approaches. You're changing the energy of the system and you're getting some information. But the techniques I'm particularly interested in are techniques where we do not use radiation or heat to probe the material, but we can use a molecule. That is, we're going to take chemical molecules, we're going to expose the sample to those molecules, and by exposing the sample to the molecules, we're going to learn some information. And in many cases, information is not always easy to obtain using heat or radiation. The two techniques I'm going to talk about today, today will be focused on inverse gas chromatography, which I'll discuss in some detail, but also techniques such as dynamic vaporsorption, wettability. There's a range of techniques where essentially we use a molecule to get some information about the material. In terms of the sort of information you can get by using a molecule, thermodynamic information, kinetics, chemical and structural physiochemical information. And of course, the fundamental difference is we're using matter to interrogate the material rather than energy. And for example, if we're into understanding, for example, the solubility of a molecule and solvent, the dispersibility, how a molecule actually dissolves in a solvent, those phenomena are dependent on molecular interactions. So actually, if you're interested in those sorts of physiochemical properties, dissolution, adhesion, aggregation, then actually using a molecule as a probe is actually the naturally relevant probe to use. And indeed, there are many examples where molecules provide superior data sets. In some cases the only data set for understanding phenomena. So we're going to encourage the use of molecules as a way of probing materials. Just to talk a bit more about what I mean by a molecule as a probe. So here we have a sample. This is a solid. It could be a powder, it could be a fiber, it could be a gel. But either a solid state material or a semi solid material, we're going to expose that particular material to some vapor molecules. Vapor molecules generally want to interact with solids. They're strong adhesive forces available, strong intermolecular potential. So molecules will, some of them will adsorb on the surface, as you can see here. Some may dissolve inside, we call those absorption. And in due course they will also leave the system. So essentially there are experiments that we can design which allow us to look at the way in which molecules interact with the solids. And those molecular interactions tell us something quite intimate and innate about the chemistry of that material. So we can see things, a phenomena that isn't always possible to see spectroscopically or using thermal techniques. So the first thing we'll introduce to you today is the technique inverse gas chromatography. Now, many of you will be familiar with traditional analytical gas chromatography. And that's shown in the carton at the top. And let me explain what goes on in inverse. In normal chromatography, in case you've possibly forgotten. So in normal chromatography we're going to have a column that's normally packed with a known material. So you buy a column from your manufacturer, it has a standard packing in it, and we're going to allude to that packing. As you can see here, some red and also some blue molecules. And we have a known column where we're passing through it, unknown molecules. And the result of that is that the actual system will actually separate the red from the red from the blue molecules. And we'll actually, on our chromatic chromatographic instrument, see two different peaks, one which tells you the quantity of molecule red and the other tells you the quantity of molecule blue. So we can find out, we can quantify composition. Now, in inverse gas chronography, it's quite different. In inverse gas chronography, the big difference are the following in the column that we see here, and I'll just highlight the column for use in this experiment. This column down here has your solid, the material you want to characterize it goes in the column. So in this methodology, we will prepare a packed column with your solid material. And rather than inject an unknown vapor phase into our gas chromatography instrument, we will inject a known molecule. So basically we are reversing the roles between the actual known phase and the unknown phase. In inverse gas chromatography, we have an unknown solid. That's your material. In this case, almost certainly going to be a polymer, but that's today's presentation about polymer. And we're going to pass through the column and using a helium type carrier gas, some known vapor phase molecules. The ones we'll see today are typically hydrocarbons, but they could be octane, ethanol, could be any vapor phase molecule you like. So essentially in the top experiment, the analytical method, I get you some composition information. How much red molecule, how much blue molecule? In the second experiment, in the inverse gas chromatography experiment, it's something different. I'm going to measure very accurately the retention time, which is shown in the graph here. And from the retention time and the flow rate, I'm going to measure a fundamental property. It's called the partitioning coefficient, and it's a measure of how strong the blue molecules in this diagram interact with my unknown material, if you like the polymers. The example I'm showing is for microcrystalline cellulose, but the model is the same whether it's a polymer or a solar step two or like cellulose. So just describing a little bit more detail how the instrument set up and we'll start with the important thing, which is a column packing. So, as I said, you're going to pack your own columns. It turns out to be very easy. So over here is a col, and we're going to pack our powders or our fibers or our films in there, and we're actually going to pass through this system like in any normal gas chromatograph. We'll use a helium or a nitrogen carrier gas. It will pass through the column and we're going to inject different gas phase species. These could be hydrocarbons like octane or decane. There could be alcohols like methanol or ethanol, or there could be more acidic samples such as acetic acid or basic like amines. So we're going to elute those through the column. And from the instrument we've got a detector at the end, a flame ionization detector, as in many normal analytical GCs. And we're going to measure the time of flight, how long it takes for the molecules to pass through the column. And that's a measure of how strongly the molecules in the gas phase that we've chosen interact with our unknown material. So we're going to get some chromatographic data, as you can see here, and from an isotherm will come from that. And then we'll get some physiochemical property. And the one today we're interested in is the tg, the glass transition temperature. That's today's objective. As I said, packing columns is relatively easy. It's not that difficult. We have straight columns. They're typically about, typically about a foot long. We will put in there between ten and a couple hundred milligrams of material, and they can be packed literally in five minutes. So the packing of the column some people are worried about actually turns out to be one of the easiest things to do in the world. And that column will then go inside our machine. And we're going to pass helium gas through that material, that column, and we're going to introduce different molecules. So let me just describe what goes on here. So we're going to inject a single pulse of a probe molecule. We're going to inject it, and you can see here some. Some sort of mock experimental data. So first experiment I do is I inject some methane. Now, methane, of course, as you know, is a gas phase molecule. And basically, it does not adsorb on the surface. It wants to be a gas molecule. So pass through the column very, very quickly. That gives me essentially a dead time, which corresponds to a dead volume. So basically, it tells me how much empty space there is in my system. And of course, now I inject other molecules that are going to interact, for example, and you can see some octane. Octane is a larger molecule, much stronger forces. So, not surprisingly, it takes much longer time to pass through the column. And the difference between the octane adsorption time and. And the methane time of flight gives me the tn, the retention time. If I know the flow rate of my carrier grass, which of course is known and fixed with maybe 10 cc's from TN, I multiply the flow rate and I be coming out with vn, the retention volume. Now, if I put different molecules through and they're smaller molecules, they will absorb for a shorter period of time. They're less strongly attached. They have lower adhesive forces when they've got lower surface tensions. But in the experiments I'm going to describe today, we're typically going to use just one of those molecules such as octane or hexane. And we're going to look at the retention behavior as a function, the retention behavior as a function of temperature. And in today's experiments, as TG is what we're interested in, TG will be looked at by looking at the retention time versus the actual temperature. So essentially, we're going to be measuring what's called a solute partitioning property. So if you like, it's technically the solute partitioning coefficient, we're going to measure the retention volume. And the retention volume is simply the time it takes for the molecule to pass through the column. Time times flow rate and gives us a volume typically in ccs. And we'll normalize that to ccs per gram of sample in the column and what we'll do in the experiments I'm going to describe today because retention volume is basically an equilibrium constant. So RT log of the retention volume essentially gives me a delta G type property. So I'm going to plot, in our plots you'll see later on Delta G versus 1 over T. So the typical plot that you might see from your first year physical chemistry type experiments. So basically that's the background for the experiments we're going to be doing today. So let me describe what's going to happen when I pass a molecule over my amorphous solids. So we're talking about glass transition temperatures. So we're talking about amorphous solids. So these are solids that have some molecular mobility, but only above a certain temperature known as the glass resentment temperature. So below tg the materials are glassy. And that's what I was showing you on the left here. When the materials are elevated in temperature, they become rubbery. So in other words, their molecular properties change. And in fact when that happens it means that molecules can now diffuse inside the solid. So on the left hand image over here, let me just get my tool here. So on the left here you see a glassy solid and here are my molecules absorbing and they absorb on the surface and they diffuse just a little bit into the solid. But when I'm at a higher temperature and I'm above the tg, the materials rubbery. And now the diffusion constant is much higher. So now I get much greater progression of molecules into the material. So this is the amorphous where it's glassy and amorphous where it's rubbery. Of course if I have a crystalline material, I will just get surface adsorption. But today we're looking at tg. And if you have a tg, you must have some amorphous materials. Let me also make a comment about the use of the IGC technique because there are many techniques you out there for measuring TG and most popular would be dsc. Now one of the reasons why IGC turns out to be quite useful is when you've got a material that has a very low component of an amorphous material. Now for example, if you've got a material is only got say 1% amorphous content in it, it's very hard to spot the TG in a DSC experiment. In DSE experiment it's all around heat capacity. And if you've got a hundred molecules that are crystalline and in one molecule that's actually got a tg, then you are going to basically mask the TG by the crystalline material that's left. The benefit for IGC is that the partitioning behavior is very different between the crystallite and the amorphous phase. So even if I've got only got a small amount of amorphous material, I will get very strong partitioning. So in other words, the heat capacity between the crystalline material and amorphous material is very similar. The partitioning coefficient between an amorphous solid and a crystalline solid might vary by a factor of 100. So I have a lot more differentiation possible by using IGC if I've got a low amorphous content. So I now want to talk to you about what happens conceptually when I'm doing my IGC experiment. So, as I said before, we've got three scenarios. We've got a glassy material and a glassy material occurs at the lowest temperatures. I have a material which is intermediate, intermediate temperature, where the material is glassy and rubbery. It's in transition, if you like. And I have high temperatures where the material is rubbery only. So what I'm plotting here is what I expect to see and what we've seen in many examples in literature over the last 40 years between a plot of log retention volume divided by T versus 1 over T and what we'll see if we start on the right, because most experiments we start at low temperatures. This is a reciprocal temperature plot. So low temperatures is the right hand side of my graph. So basically if I look over here on the right hand side of my graph, the material is glassy. So in that case, when I do absorption, essentially my molecules are just going to be on the surface. So the first part of my experiment, this straight line I see here, is all about adsorption on the surface. And in fact I get a straight line here. But what will happen is as the molecules start to dissolve into the bulk, I will see a loss of linearity in that plot. So in fact that loss of linearity coincides with the glass transition temperature. So in other words, when I go from surface absorption to surface absorption and some bulk absorption, I'm going to get this change in slope. It gets more complicated because there's some non equilibrium effects that occur. But essentially I go from a linear slope here, I end up with linear slope at the end. But as I transition here, that first onset, that first change deviation, linearity is a very accurate measure of rtg. And that's what we're going to see in the next couple of examples. So this shows you the same sort of thing, slightly more detail. What I'm showing you here is the surface absorption on the right hand side of my plot. And you can see here that it's very linear. When the material is glassy, then at a certain temperature, and that temperature is the tg. I see this departure from linearity and that is typically associated with the TG of the material. And the tg, of course, is the second order phase transition, as you all know. And it's an important property to measure for amorphous solids, including amorphous polymers, but also for pharmaceuticals. So there's some data from an experiment for a material and I'll show you some examples, one or two examples from literature, then some examples of my own. So here are some examples for polystyrene. And these polystyrene are being probed with hexadecane. Okay, so the probe molecule has been injected into a column which has got polystyrene. And on the right hand side here, let me just get my indicator on. So here you can see again the linear plot. And even at different compositions we still get linear plot. What you can see there that this is a very low loading. This is 0.1% polymer. It's quite tricky to see the TG there. But what you can see, even with 0.3% of amorphous polymer, you can see the TG. And I would say to you that if you had a polymer at point 3% and you did a DSC experiment and look for the TG, I think you would be very lucky to see it. So what you can see, even at 20% polymer, the TG is quite clear. So those lines are linear. In fact, the slope of those is the heat of absorption. And actually the line here, that the fluctuation wave linearity relates to the TG. And that line there actually corresponds to 98 degrees Celsius, which is pretty close to the accepted TG for polystyrene of about 100 degrees. So this data is consistent with what you'd expect in the literature. So that's polystyrene, which is sort of your standard reference material for these sorts of studies. So here's a more complicated material. This is a liquid crystalline polymer. And again, we're starting from the right and we're going to the left. Are we increasing in temperature? We're increasing in. We're increasing in temperature in this direction here. And what you can see for this very complex pollen, which has got more than one phase transition, this will actually have three or four transitions that, as we go different temperature, we can see a range of different events and you actually can see one, two, three different events occurring. So not only can you see the TG of a single component material, but, for example, if you had a polymer or had more than one polymer, you may well see evidence for more than one tg. In this case, we're seeing evidence for more than one transition event as we go through different liquid crystal polymer phases. So again, in this case, the probe molecule was xylene and you can see that we have some pinching events. So again, that's another complementary way of looking at transition events besides just using your traditional dsc. So let me move on to another important class of polymers. These are amorphous Teflons. Of course, Teflon is generally a polymeric material, but Teflon af, that some of you may be familiar with, is an amorphous polymer. And it's basically a different copolymer of Teflon. And the side chains mean it's unlike it's. It's more difficult for it to actually have relaxations. So essentially it doesn't crystallize so easily. So we can see two examples here, and this is adsorption using some alkane C13 to 17 on amorphous Teflon. And again, it's the same plot, it's reverse temperature. And you can see here quite clear some transition events which are the tgs for this material. So you can see here we've got some change in slope in this particular case at about 130 degrees, which corresponds to TG. And also another polymer here, which is AF242100 is a different Teflon AF. And you see quite different significant differences in the TG for these two different Teflon copolymers. And the references for these works are provided further down. So let me move on to some examples of my own now. And the first molecule, the molecule I did my first IGC work on, which is so long ago I have to. I'm embarrassed to say it was 1989, but there you go, was Kevlar. And Kevlar is an aramid fiber. It's very nylon like, has varying surface properties and is actually commonly used as a reinforcing material in composites. And we did a study many years ago looking at two different phenomenas. Firstly, looking at the cleanliness of fibres, because we're going to put our fibers in epoxies and bond them to make composites. And. And it's quite important that the fibers were clean. And if you might say to say, well, why are the fibres not clean? Well, the fibers, which are 10 micron fibres, which are woven into yarn, which is then woven into fabrics, have to go through very complex processing operations. And to do that, they have all sorts of lubricating agents and size and chemicals placed on them. So when they come off the production line, although they've been cleaned, they're not that clean. They have a lot of contaminants. So we started by doing a study of cleanliness. And the first bit of work I'm going to say right now is simply a range of different Kevlar fibres. They're packed into IGC columns and essentially we looked at the cleanliness. So here we're looking at a series of alkanes at different temperatures for a particular dried sample of Kevlar. And the linear plots that you see here indicate for all these probe molecules that there is no TG in this temperature range. It's quite a small temperature range. It's only from about, I think, 20 to 50. We're only looking in a small range here, but what you can see in this range is that we are able to measure the heat absorption, but there's no TG in this measurement range at all. And we actually looked at a range of clean fibres. And you can see here that for the four different fabrics we did, essentially some of them were dried, some were cleaned. In this temperature range, the materials didn't show any tg, so that was useful for the clean materials. But as well as these clean Kevlar 49 materials, we also had a range of less clean materials. We actually had a range of Kevlar 29 fabrics. And these materials were being used to make composites and we had some suspicions that they might have been contaminated. And in fact, we did do some work on the materials I'm about to describe. And we found a range of different sorts of chemicals present. So glycols, aliphatic esters, a range of different sorts of polymers and polymeric materials were present. And. And we determine these using GC mass spec. But let's look at the actual fibers themselves. So here are the materials. There are a range of different. This is one of our fabrics. This is a type 755 fabric. And what you can see here over on the right hand side. So essentially, although we have some linear data there, you can see we have some changes in linearity during the experiment. So this non linearity here means that the polymer Coating or the coating on the polymer, we're talking about less than 1% size. In fact, I think was less than half a percent. So even though there's only half percent of the polymeric sizes were present, they gave a clear evidence of TGS. And these TGS I think were down at about 10 degrees, 20 degrees. So essentially this non linearities here mean there was a TG in the material. And this we did try, I recall to look at this with dsc, although I didn't think it's reported in the paper. And we could not see a TG in dsc, but there certainly was evidence of a TG based on the IGC experiment. And that's because the IGC was very sensitive to the amorphous surface layer. The crystalline substrate, which is the Kevlar fiber itself, was there, but it doesn't have a tg, so we don't see it. We're very sensitive to partitioning of our organic molecules into this particular unknown, really size sizing commercial proprietary chemicals. We were working with the pipe, they certainly weren't going to tell us what their commercial size are. So we knew there were sizes were there. We did succeed in removing those later on, but this just proved that there were materials there and they had a tg, which was something we need to be concerned about. So in the final example I'll give today, it's not a polymer, it's actually a biomolecule, It's a maltose, so it's a sugar molecule. One of the things we also know about molecules such as maltose, but also hydrophilic polymers such as PvP or PVA, is that they have a TG that depends on their moisture content. So although we've been talking so far about tgs in terms of temperature, and of course temperature is important, it also turns out that the moisture content in the material also affects tg. So what you can see here is some IGC data which has been taken. And what we've done is we've taken a material which was dry to start with, and we measured the tg. So what you can see here, the first data point on the left here, is for 0% moisture. So if I take maltose at 0% moisture, which is also correspond to 0% humidity, the TG is about 362 degrees, so it's about 90 Celsius. But as I expose a sample to humidity and the moisture content goes up, the TG drops dramatically. And even by exposing a sample to something like 15% humidity, the TG is actually Going to drop really over about 40 degrees. In other words, as even quite a low moisture content, which corresponds to a low relative humidity, can actually give you a substantial change in the TG as affected by humidity. So not only can IGC measure the TG of thin films and base polymers, it also can measure the TG of material, which is when it's influenced by the humidity. So whether it's pva, pvc, if you've got a material that absorbs water and the TG is affected, that can also be measured using igc. So that's also another useful application for more hydrophilic materials. So there's my conclusions. Probing material properties using vapor phase species are complementary to using radiation and thermal techniques such as DSC or Raman. The retention behavior of gas phase solid species depends upon the molecular process associated with partitioning. So whether it's dissolving on the surface or the bulk, whether it's some sort of reaction, we can look at the partitioning process as a way of understanding the chemistry between our solid molecules and our morphous substrates. The TG of polymers, as well as other phase transitions can be seen in the retention behavior data versus temperature from igc. Also, IGC can be used to look at the impact of humidity on Tg. As the solute retention processes are very surface sensitive. The presence of polymer coatings can be quite easily detected by igc. So I thank you for your time and your attention and I'll be happy to answer any questions you might have that looks like about.
Answer questions from the people attending. We do have one question. Can inverse gas chromatography determine the radius of solubility, of insolubility parameters of a given polymer?
Okay, so IGC can be used to determine solubility parameters. It is a difficult experiment to do and you have to be quite careful how you do it. But there is some scope for measuring solubility parameters and there are some papers in literature to do that. But it's not a trivial experiment. But it is possible to do.
Another person replied. Thank you, Darrell. How do you choose the probe molecules? How many need to be used and do they give the same results?
Yep. So in broad terms, in most cases, when you're measuring tg, it doesn't matter very much which probe molecule you use, although it's fair to say that some molecules are more sensitive to others. And what do I mean by that? We are talking about molecules that are dissolving in the polymer when the material is above its tg. So if you choose a molecule that's got a very good soy built in your polymer, you will get enhanced sensitivity. So if I was studying polystyrene, which is a fairly hydrophobic polymer, I'd probably choose a fairly hydrophobic probe molecule. And if I was using a fairly hydrophilic polymer, again I would choose a probe molecule that had some degree of hydrophilicity. So that just gives you optimum performance. But truth is most molecules will say the same, will show you the same sort of behavior in terms of number of molecules. Typically I would only use one, maybe two molecules at most because you should get same, basically the same sort of results.
What about the second moment of the curve? There's no information there.
Yeah, let me just, let me just go back to that slide just to pick up the question and let me tell you what, what is in the data right in the data sets here. So essentially we've got two curves here. So from this slope here we would measure the heat of adsorption. So we'd measure basically the, sorry, the free energy of adsorption, delta G for the process. So we'll get delta G. From that we'll also get the TG as well. Now over here we're a little bit non equilibrium but on the far side where you might potentially get also a delta G for bulk sorption as well. So we'll get, we'll get some information around the free energy of adsorption for the material and we'll get tg. So that's, that's, that's probably the best we can get from these experiments at the moment.
Are there any other questions? You feel free to speed up, speak up as well.
Yep. So I see got a question here about use TG to measure lower TGS below 20. I guess the question really is how low is the TG that you've got. And obviously there is a limitation in terms of temperature range the IGC will operate to. So at the moment you can only measure TG in the measurement range for the instrument. So essentially if it's very, if, if the TG was minus 5, you would, we would struggle to do that.
Dear professor, thank you for the presentation. Would material loss be a concern with the, with the turn when it turns to rotary flows?
Yes, thank you for that. Thank you for that question. Now even once you're above the tg, the material is still very high modular. So it's not going to do anything. So even though we're above the tge, the material will still not misbehave. It will come out of the column when you want it to. So our experience is that even going about the TG has a. Has quite a minimal impact on the reality of the flow. It's quite a subtle change. So you're not gonna have. No, you're not gonna see any impact from a flow perspective. That's not a problem. In short.
Okay, well, I appreciate you doing the presentation, and thank you all for attending. If you want any more information on anything in the future, please feel free to go to www.surfacemeasurementsystems.com or if you have any further questions that are more detailed that you want to answer right away, feel free to contact your local sales rep, and they'd be happy to help you with any questions that you have.
And we will be sharing the presentation after the event, so you look at a copy of the slides.
Okay. And hold on. We got one more question.
Okay.
I can help with solubility parameters. Adam, vocal. Okay.
Yeah, yeah, that's. Adam's been working for many years, and as I said, he's probably a lot more knowledgeable and solubility parameters. So if you wanted to explore solubility parameters in more detail, email me, and I'll connect you with Adam for sure.
Okay, thanks.
Thanks, Adam. You're an expert as I'm not.
That concludes today's meeting, and again, I thank you all for attending this webinar, and hopefully you have a good day. Take care.
Thank you. Thanks, everybody, for coming along. Thank you.
More from Prof.

Webinar: Advances in Measuring Gas and Vapor Permeation Through Membranes and Barrier Polymers

Webinar: Determining Solubility Parameters of Bacterial Cellouse Through Energy of Adsorption

Online Webinar: Recent Technological Advances in Adsorption Based Direct Air Capture

Online Webinar: Surface Area of Pharmaceutical Ingredients at Real World Conditions by IGC



Hybrid Workshop: Measuring Material Vapour Pressure Properties Using Advanced Sorption Technique

PCL Hybrid Workshop: Recent Advances in the Characterisation of Pharmaceutical Powders


Using Advanced Techniques to Test the Performance of Recycled Bathroom Tissue | A video summary
