Dynamic Vapor Sorption and in situ Raman application for the study of Hydrate and Solvate formation
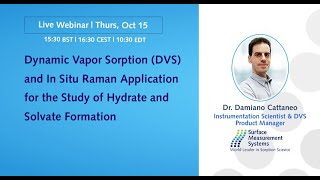
A technical webinar on Dynamic Vapor Sorption and how combining it with in situ Raman microscopy reveals how drugs form hydrates and solvates. Examples include carbamazepine with water and acetone, showing how humidity triggers phase transitions and recrystallization.
Chapters
Okay, so in today's presentation, I'm going to go over a quick introduction related to the technology that we are using and describe it today. So, dbs, then we are going to do an overview of an analysis process of high radiant solvate formation in dbs. So from a point of view of gravimetric technique, we are going to have a look at phase transition TP code that we analyze with dbs. So we're going to look at a couple of drying curves and a few glass transition phenomena. And lastly we are going to have a look at a case study specifically using Raman to analyze hydrate and solvent formation. So let's start from our overview of the technique and the way we collect data using dbs. The main methodology is based on measuring the capacity of a sample to interact with molecules of a gas or of a solvent. The interaction can happen on the surface of the sample or on the bulk of the sample. So if we take for example molecular water, they will absorb on the surface of the sample or they will penetrate through the bulk of the material going to absorb. Now this process can be reversible or irreversible depending on the energy and the kinetic involved with the process. So when we reduce the relative humidity or partial pressure around the sample, then the amount of molecule present in the sample can reduce. Consequentially, the mass of the sample can potentially reduce. So having a look at the two terminology that we just described, we are going to define absorption and we're going to define absorption. Starting from absorption, we can define two potential phenomena which are physisorption and chemisorption. So physisorption, that's a weaker interaction. So a non covalent bonding between the molecule of solvent that we are introducing and the surface of the sample, it's usually represented by a reversible process because the energy involved with the interaction is very weak. However, this gives us a lot of information in regard to the structure, specifically the surface structure of the material. Surface area, pore size, surface roughness can be analyzed using solvent that interact only with the surface of the material. A more specific type of interaction that happens on the surface is chemisuction. This is usually a strong interaction and is represented by a covalent bonding between the molecule of solvent that we introduce and the surface of the sample. This specific type of interaction are typical of material that are designed to interact with the solvent that we're using. So titrate, acid, base, catalyst, dispersion are usually the material that we are analyzing when we are interacting. Looking at this type of interaction. Our presentation of today will be mainly focused on the other part of the interaction, so the absorption. So when the molecules not only pile up on the surface but also penetrate through the bulk, the desorption process is usually limited specifically by a phenomenon of diffusion. So the molecules, they don't only dissolve, so they move away from the surface of the sample, but they also have to migrate from the core of the sample to the outside. So that requires more time and require more shifts the equilibrium condition. Now the information that we can get from this type of interaction are class transition daily question point the but also phenomenon of diffusion and permeability which we can calculate using dbs. The last type of interaction which is the main focus of this presentation is a structural change indicated by the hydrate or solvate formation. Now we start from a molecule that is usually anhydrous form and then we expose it to a specific solvent and then it can generate the formation of a hydrate or a solvent. Now there are two main concepts of a hydrate and solve a formation and we're going to have a look into those and the way we can identify those. So the first one is stoichiometric or non stoichiometric. So a stoichiometric hydrate for example, is defined by the fact that we can define exactly how many molecules are becoming part of the structure of our final product. So you can say it's a monohydrate, the D hydrate is an exchydrate, A non stoichiometric hydrate for example, have a structure in which we cannot exactly define the number of molecules that end up in the structure of the final product. The other process that we have to remember is reversibility. Is the hydrate reversible or irreversible? So can we go back to the ionate reform or if we can't, in that case is irreversible. So we're going to have a look into more detail into these specifically in the application section. So this is the type of data that we can obtain. Now we're going to look at the way we obtain this type of data. We're going to look at the historical way where this data was collected and then we're going to look at the way the same data are collected in a dbs. So let's have a look at the historical method. Historical method that is reported in pharmacopoeia. Historical usually defined as a jar method. So you will have in a lab a series of desiccator that contain at the bottom of each desiccator a saturated solution of salt. So one desiccator will contain lithium chloride, one will be potassium nitrate, one would be sodium chloride, and so on and so forth. Each saturated solution will generate a specific level of relative humidity or partial pressure that will basically create a conditioning inside the desiccator. So what you will do is record an initial mass of the sample, put the sample inside the desiccator, wait a couple of days, remove the sample, read the mass of the sample, put it back in, repeat the process until the mass recorded by each desiccator basically is constant. In that way, the sample have reached equilibrium at each stage. And I can consider each dot, each part of the absorption as one of the desiccator conditions. The same methodology in COMSET is used by a dbs. We generate different level of relative humidity and we constantly measure the mass of the sample using a micro balance. That's basically the same idea. The process is done in continuous rather than being done staggered throughout the series of desiccators. And there are significant differences in the way the experiment is performed and the amount of sample required to perform the sample. The experiment. So if we look at the jar method, we require a few grams of sample. The higher is the mass of the sample, the more accurate will be the measurement because we are handling the sample throughout the entire experiment. So we need a higher mass to make the process repeatable. In a DBS, we can use milligrams of sample because we have a microbalance that constantly reads the mass of sample. So we can make it fairly accurate by making it repeatable. The dynamic process. Sorry. The equilibrium condition is established in a jam by diffusion, which is a static process. So the molecule migrates only pushed by static condition from the chamber, from the inside of the desiccator to the sample itself In a dynamic vapor absorption, as the name says, dynamic indicates the fact that the molecule of solvent that we're using are pushed on the surface of the sample by a carrier gas by a constant flow. And in this case we are using nitrogen or air in a flow that is usually 200 milliliters per minute at 25 degrees Celsius. So the equilibrium conditions are pushed forward not only by the diffusion process, but also by the constant flow carrier gas on top of the sample itself. This obviously makes a significant difference in the amount of time required for the sample to reach equilibrium. But there is also another factor that we have to consider. The jar method require the user to remove the sample and to put it on a balance and put it back in into the desiccator that can expose the sample to different condition of temperature and relative humidity, different position of the lab and it also introduce an extra variable which is the time required to remove the sample from the desiccator and put it back in. In a dvs, the entire experiment is performed in a control environment. We load the sample and and we do not interfere with the measurement until the experiment is completed. So there is no issue of cross contamination. There is no issue of timing of exposure to different level of condition of temperature or relative humidity. And that allows us to perform the experiment in a much more repeatable way, but also in a much shorter time. Here is for example the difference between the same experiment performed on the left on a jar method and the right on a standard DBS. Exactly the same sample requires about 300 days. On a jar method, it's about 4.3 days in a DBS. Moreover, you can see over here that in a jaromethod we are only increasing the mass, we are only measuring the absorption, while in DBS we can actually measure the absorption and desorption which allows us to plot then the isotherm in this case for a generator is only of the absorption cycle. But for standard DBS experiment we can plot absorption and desorption and also calculate the hysteresis which is the gap between the absorption and desertion. So how do we perform an experiment, how the instrumentation actually work to perform this specific type of experiment? So this is a very simple process. So looking at the bottom right hand side, I'm going to describe how we perform a generation in this case of water. For this specific schematic picture, the water and dry bowl here as two separate reservoirs. The water reservoir will be the head space or a reservoir containing water. And the dry reservoir will be a cylinder of nitrogen or air. For a schematic reason, we usually refer to the reservoir containing a solvent as wet and the reservoir containing the carrier gas as dry. So let's say we are doing drying stage. We are starting to drying the sample at the beginning of the experiment. In that case, the two valves that control the reservoir, the mass flow control that you see over here will regulate the flow in a way that the wet side, the water side will be 100% closed while the dry side will be 100% open. If we are doing a stage for example that is 20% relative humidity, then the two master controller will regulate in a way to generate 20%. So the wet side will be 20% open and the dry side will be 80% open. The two gas will then meet and we will read the generation using a sensor. In this case a humidity sensor for water. And the molecule then push throughout the carrier gas into two chambers, a sample and a reference chamber where we have two identical puns. The two puns are connected by an end and wire to a microbalance. And you can picture this microbalance as an old pharmacist balance with two plates on the left side for the sample side and on the right side for the Rembrandt site. Now, this system that you see over here is actually designed to be symmetrical. The reason is we are measuring absorption on the surface of the sample. But we are doing it in a very simple way. We are just pushing molecule into chambers. Now, molecule of water will absorb independently in multiple places. We will absorb on the endom wire, we will absorb on the sample panel. So there are multiple conditions in which the sample can and in which the molecule can interact with different parts of the structure. However, the only thing that we want to really measure is the mass of the sample. And the sample must change related to a change in relative humidity. We are not interested in measuring mass change related to absorption of water on the metal pan or the chamber or the end of wire. So that's the reason why we designed the system symmetrical. Everything that is on the left side is on the right side. The only difference between the two sides is the sample itself. That means that basically if we introduce water and we forget to put the sample in, the mass does not change. So the mass reading from the balance will be pure noise and no data from the instrument at all. So this is how the instrumentation work. A standard experiment would be probably designed in a very simple stage way. So we will have an initial drying stage and then we will generate a constant level of relative humidity. As a first step, let's say 20% or 30% or 40% increase the relative humidity and we will check the mass automatically. The software does it for you. It will read the mass output from the balance, wait for the sample to reach the equilibrium, then automatically move to the next stage. That will allow us to build up the data of the absorption and desorption. Now, we can then take each equilibrium stage against each relative humidity stage and plot it as percentage mass change of weight over relative humidity. And that will give us the plot of the isotope that we see over here. So what would the data look like? Here is an example of a standard experiment on food material, in this case rice. And this is a two cycle experiment of absorption and desorption. So what are we looking at here? So we have a kinetic data. So it's a plot of time on the x axis over a percentage mass change which is highlighted in red. We can see the mass going up, reaching equilibrium and going down, reaching equilibrium stage over relative humidity, which is the blue line which goes up and back down. So what type of experiment are we performing and what type of information do we get from these exact set of data? So we have an initial drawing curve right here. We have a cycle of absorption desorption repeated twice. The information that we get from this initial plot of data to tells us basically that this material has a high uptake of water over 20%. Mass change is quite a lot of water for a standard sample. Moreover, the sample is actually perfectly reversible. You can see here that the mast goes up and then down and then up and then down. But it recovers, it always goes back to the initial condition. This means that the material is not went through any particular structural change or transition. It means that this process of wetting and drying the sample is perfectly repeatable. We don't damage the sample, the sample doesn't go through any specific transition. Now we're going to take each equilibrium condition and plot it against the relative humidity to get the isotype plot. And this is the data that we obtain from this plot. So it's a plot of target relative humidity over perfect percentage must change. And here is the cycle of absorption and desorption with a nice gap of hysteresis in between. So what information do we get from this specific set of data? So what you see over here is basically that the material has a very high uptake of water over 20%. Mass change is perfectly reversible. It goes back to the initial mass already and it has a nice gap of hysteresis between the absorption and desorption. The interesting factor that we are highlighting over here is the fact that the desorption cycle is higher than the absorption cycle. So you see this line over here is over this line over here, which means that we have bulk absorption and the molecule not only absorbs on the surface, but penetrates through the bulk of the material. Which means that to come out from the sample they need to diffuse out of the sample. So if you think from a mechanical point of view, if you look at the data of the absorption, to get to the same mass level during the desorption cycle compared to the absorption, you have to go to a much lower level of relative unity, which means that the molecule prefer to be inside the structure of the sample rather than being outside. Now this is obviously dependent on kinetic and thermodynamic process. This experiment specifically run at 25 degrees Celsius, which means that if we increase the temperature of the sample, for example, if we repeat it in zetter this experiment at 30 or 35 degrees Celsius, what we will observe probably is the fact that this gap of hysteresis will reduce progressively because we are providing more energy to the molecule of water, consequentially also drying the sample much quicker. So let's start looking at actual application and in this case we are going to start looking at hydrating solvent for. So we started from a standard sample. This is not an hydrate or a solvent. This is just microcrystalline cellulose. And what we are doing here is analyzing what a normal sample will look like. And then we're going to look at the data provided by a hydrate or a solvent. Because the difference in data provided by a hydrate or solvent are very significant and very striking. So the first section that we are going to look at here is the fact that we have a cycle of absorption and desorption. We have a nice gap of hysteresis in between. So we have bile absorption. The other factor that is highlighted in these specific plot is basically the fact that we can get as many data as possible if we want to focus specifically on critical condition of the sample. So high region or low region of the study can be studying a DBS by actually focusing on that section and having more point of isotechn index section that stretches the time required for the experiment to complete. But that's just time required for the experiment. It's not related to the quality of the data. So this is a standard sample with bulk sorption. How would we compare with for example hydrates or a solvent? So one of the things that is particular about hydrates and solvate is the jump the that you will see for example related to the formation of the hydrate of the solvent. The sample that I'm looking at over here is not a hydrate, but can pass as a hydrate from a point of view of a hydrotherm. We're going to look at the hyzother specifically of a hydrate in the next slide. So what we are looking over here is a mesoporous material. What I mean by mesoporous material is a porous material that have very large pore that can contain multiple molecules of water. So what you are looking at here is the fact that think about this Sample as a giant cage. And what we are looking at here is more of a honeycomb shape type of structure. There is a lot of empty space. The structure of the sample is mainly empty. So there is a lot of empty space. And what you're looking at as a solid part of the structure is only the corner of the structure of this honeycomb shape. When you are introducing water on the surface of this sample, what you're doing is piling molecules only on the corner of this cage. The corner of the cage has a very, very small area, surface area. So what you're seeing over here is the fact that the molecule are not actually going into the structure. They're only piling up on the corner of this honeycomb shape. At some point you are introducing so many molecules around the sample that what you are forming is droplet. Once the droplets are formed, they are able to go through the honeycomb shape structure. So they immediately permeate through the honeycomb shaped structure. Obviously the formation of the droplet which is causing capillary condensation, cause an automatic giant mass jump that you can see over here. And this is describing the formation of the capillary condensation and also describing factor that allows us to understand the size of the pore of these mesopotamous material. Now when we drop the partial pressure, obviously we are reducing the molecule inside the pore. At some point those molecules are completely removed, so the condensation disappear. And then we only add the molecules that are left around the corner of the structure itself. So why am I showing this data? These data are very similar to what you would look like when we have, for example, the formation of a solvent or a hydrate. Most of the time you will have a structure that doesn't absorb a lot of water or organic solvent until we get to a critical value of target partial pressure or target relative humidity. Once we get to that critical value, then we jump up, we have a snap up on the mass reading and then it stabilizes to that value. It's a very critical level and is very identifiable specifically in the formation of the hydrocuton dissolve. So there is similarity between a mesoporous material and a hydrate formation. So let's have a look at the reversible hydrate in this case. So this is a reversible hydrate. What I mean by reversible hydrate is that I can expose it to water, it can form the hydrate and then I can dry back down and regenerate the aneroid form of my material. So what you See over here is that in my kinetic data I draw my sample, then I start introducing water. But my mass uptake doesn't change. I have to go to a critical level of relative humidity at which then the jump happen. Then there is a massive increase in my mass and then it stabilizes over this level and it's stable over a period of time over the desorption volume. Once we get to a critical value during the desorption, then it destabilizes and it goes back to the anitrous form. And here I can show you that it is reversible. So I can do it again with without particular structural change in the sample. So if we plot, that's my transition step, that's the critical transition condition that causes the formation of the hydrate. So if we plot the isotherm, you can see over here, that's basically the data that I was looking for and that's basically the similarity that I was trying to trace with a piece of porous material you see here. During the first absorption cycle, basically the material does not take any water until it gets to a critical level of relative humidity, which in this case is 30%. So after 30% it jumps right back up, it forms the hydrate. Once the hydrate is formed, there is not a lot of space left for water. So that's all that is left is surface oxygen. Right Here again when we try to dry the sample, we have again a critical condition. Now the interesting thing is that, and this is particular for hydrate and solvase, the data that you see over here is the fact that the critical relative humidity for the drying process to go back to the anodex form is different compared to the absorption cycle. So in the absorption cycle my critical value is at 30%. The desorption cycle is around 20%. So what we are looking at here is a stoichiometric reversible hydrate and that's my exact transformation step during the formation of the hydrate itself. Now here is something slightly different. Here is a stoichiometric hydrate, but in this case it's irreversible. So let's have a look throughout this data. So this is a two cycle experiment. I'm doing an absorption and desorption, absorption and desorption. The absorption line here is in the first cycle of absorption is in red. And as you can see here is my critical value is 80%. So that allows me to form the hydrate right there. Then when I dry up the sample it goes back to 40% and then it cycles down to the Android form. Now the second cycle you can see over here, it goes back up down, but it doesn't have the same shape as the first one. Specifically it doesn't have an identifiable critical value of relative humidity that allows me to form the hydrant back again. So this is highlighting the fact that this material is not stable in the condition of formation. So I can see here that if I want to form, if I want to maintain a hazardous form of this material, I will have to store the material below 70% relative humidity. If I go over 70% relative humidity, then it goes to the, the hydrate form, I can dry it back. But then whenever I put any more water into the structure, then the sample goes back up. It doesn't have that nice basically surface ocean that I had. When the material is fresh and as prepared, it lost the stability that it used to have in the initial cycle. So that's something that is very important for the study of stability storage condition of this type of material. So another example of hydrate formation in this case is this example. In this case we have a material that has a non stoichiometric reversible hydrate. And what I mean by that is the fact that as you can see here, I don't have any specific critical value of relative humidity that allows me to identify a step change between the anodrous form and the hydrate. As soon as I put some water into it, the sample starts picking up mass and it's constant and is a constant absorption and then it's a constant dissoption. So that tells me basically that I cannot identify a jump and I cannot identify a specific amount of molecule that will form the hydrates. In this specific case, however, is reversible. If you see here I have my red cycle, my first cycle of absorption, then I might have my cycle of desorption and I go back up with my cycle of absorption. They are perfectly overlapping, which means that I can do this cycle of absorption and desorption probably as many times as I want and I will obtain the same type of material. The only problem with this type of hydrate obviously is the fact that I don't have a, let's say ideal storage condition to maintain the anatrous form. As soon as I expose it to water, it's going to start picking up mass and it's going to start moving slowly to the hydrate form. One of the last example that I want to show you for specific type of structure, this is a little bit more peculiar. Let's put it in this way. So a little bit more to identify. This is a channel hydrate. So I introduced the concept of a mesoporous material at the beginning of the presentation. Showing you an example of a material that has a honeycomb shape style structure and in which the molecule will not absorb immediately into the pore of the honeycomb structure, but it will absorb only on the corner. Then once it has a capillary condensation, it will jump into the pore. This is slightly different. Picture the fact that the honeycomb shaped structure have hydrate structuring inside the cone itself. That means that basically as soon as I expose water, rather than water staying outside the cage and piling up on the corner of the cage, it will be attracted to the inside of the structure of the cage itself. It's a particular type of structure, but it can be found. So a channel hydrate will have a structure in which basically the molecule will tend to absorb immediately into the chloride strength. And you can see over here, as soon as we introduce water, the mass of the sample scales up immediately and it tries to absorb water as much as possible. Once it's saturated, then it has almost only surface option. So it, if I look at the isotope plot of these data, you can see it has a very different shape from the one that I was showing you before. It doesn't have a massive gap of hysteresis because the hydrate allows the formation almost immediately, because it's attracting water into the pore itself almost immediately. So this is the idea of what type of different type of interaction you can have and what type of study you can do with the hydrate formation. This is just from a pure DBS perspective. I'm going to show you an example. Other last example for a hydrate formation that is a little bit more common in this case is lactose. We start from anitrous lactose and we end up with a hydrate form of the lactose structure. We are starting from the anitrous form over here. We are exposing it to water. It absorbs quite a bit of water, but it's very, very slow in the uptake. But one of the things that you see over here is the fact that we don't go back to the initial mass of the sample. The mass of the sample stays up at the end of the structure. So if I plot the isotope plot of this, you can see something like this. Start from the anhydrous form. Once it exports to water, then it has a monohydrate formation that does not dehydrate at the Temperature in which I'm doing the experiment, that change in the temperature could help with drying up the sample. But in the current situation at 25 degrees Celsius, just using nitrogen or air as a drying agent is not allowed to go back to the initial condition. So the other section I want to dedicate in this presentation is regard to phase transition and specific change in structure. So one of the parameters that we have analyzed so far are experiments in which we progressively increase or decrease the relative humidity and we wait for the sample to reach equilibrium. In this case, we are looking for a sample to absorb and dissolve. But we always give the sample enough time to reach equilibrium at each stage. That's what we call a step method. The data that I'm showing you right now here is slightly different. It's a method in which we ramp the relative humidity constantly, and we want to see what happened to the mass of the sample during the ramping process. So in blue, you add the ramp rate of my relative humidity. And in red, you have the percentage mass change in, in this case, of the mass of lactose. Now picture a sample that has no structural changes, A sample that is very stable, and a sample, for example, of silica gel, okay? It will absorb water as soon as it's exposed to water as much as it can. So if you have a material like that that doesn't have any structural changes, if you introduce water, what will happen is that the mass of the sample will increase in a parallel line. So I have my humidity going up and I will have my mass constantly growing up as a parallel line. Very, very simple. Any deviation from the parallel line indicates that the sample is two changing in structure, and the mass uptake is responding to the change in structure of the sample. And that's what we are highlighting over here. This material goes through two different phase change. It goes through glass transition and it goes through recrystallization. So what is happening over here? So this is a phenomenon. Obviously they happen as we're talking about as a bulk sorption. So the materials start from a pure surface option. So when we introduce molecules, they just pile up on the surface. At a certain level of relativity, there are enough molecules that the surface of the sample, which is obviously glassy at the beginning, moves to a rubbery condition because the solvent that we are adding is acting as a plastifier. Once the sample surface has moved to the rubbery condition, then molecule can not only absorb on the surface, but also penetrate through the bulk. Once the molecule reach the bulk, we have our bulk sorption obviously, because we have bulk sorption now, we are able to absorb much more molecules. So it's faster. Right here. Sorry, right here is faster than it was before. The material that we started from is amorphous. It's amorphous structure of lactose. Once the molecule reaches the core of the sample, what happens is that water acts not only as a plastifier, but it also triggers the crystallization process of the molecule. What it means is the fact that the molecule comes from amorphous phase to a crystalline phase. If you picture an amorphous sample, the structure of the molecule is very disordered, which means that there is a lot of space for molecular water to pile into the structure. When you move to a crystalline phase, the molecule reorder, repack to a crystalline form. And what that causes is that the water molecule cannot occupy the same space. They need to be released from the structure. And that's what happens here. The material is restructuring from an amorphous to crystalline and is releasing the molecule water, so it's constantly losing mass. One of the things that we can do, apart from defining a recrystallization stage and measuring the crystallization process, is also defined in a glass transition condition, which could be interesting to define the property of the material. Now, the glass transition in this case is a value of relative humidity at a constant temperature, rather than being a value of temperature like it would be in a dsc. Now, one of the things to be careful here is the fact that obviously we have this relative humidity value, let's say 30% for this specific test. But this value depends specifically on the ramp rate that we are using for this experiment, the speed at which we ramp up relative humidity. So what we can do is repeat this experiment by changing the ramp rate and maintaining the same temperature, same condition of the sample, and see whether the glass transition happened. So what you see here is the plot of the glass transition, humidity, glass transition at different ramp rate. Now, the interesting thing of this data is that it's a line, which means that we can find the intercept of this line right here, where the value is zero. So at this value, the run rate is zero. So that value, which is around 30%, is the critical level of relative humidity at which the glass transition happened for this sample. So this is a slightly more advanced study, a more simple study that we can do is a pure drying kinetic curve. This is from a hydrate point of view. We want to know the stability of the hydrate, the reversibility of the hydrate, and how long does it take for the hydrate to go back to the anitrous form. So this is a very, very basic experiment, very, very simple. We are not doing a full isotone plot. We start from the dry sample, we load it in a DBS, we leave it overnight at 90% relative humidity, we saturate the sample, we form the hydrate, and then we drop back to zero. And we want to know how quickly does it go back to the initial form and if it goes back to the initial form. Now, that's a very, very simple experiment, but obviously we can change the temperature at which we perform this experiment, and then we can measure the fractional formation or dehydration of the sample. So the formation of the anitrous form back to the initial part. Now, obviously this is an interesting factor for a driving curve, but for a drying curve. But obviously it doesn't represent what we would do with a sample. Right? Nobody takes up an alidroot sample and leaves it at 90% relative humidity overnight. If it can't avoid. If it can't avoid it, more often than not, what we do is we have our sample in a container, and what we do is we have the sample isolated, we open it up just to take enough material to do specific impairments, and then we seal it back down to keep the batch as fresh as possible. So those represent burst exposure to high level of relative humidity rather than constant exposure overnight. And this is an experiment that we can simulate in our DBs. As you can see over here, we have a condition which we have a very low content of relative humidity, but then we have a significant jump only for a few seconds, only for a few minutes, in this case, of a higher level of relativity, and go back down. And what we want to see here is at different temperature, how does it affect the water content of the sample? This experiment obviously can be done using different amount of time. So by increasing the time from 5 to 30 to 60 minutes, which we expose to the burst level of humidity, we, we will have different resulting amount of water becoming part of the sample itself. But it's also important to look at the cycling of the sample between high and low, high and low. So one of the experiments that we can do over here is by cycling the humidity up and down, which is the blue line, we want to see how the sample behave from a point of view of mass of tape, which is the red line over here. And what you see over here is that the sample goes up and down in mass as we expect, but it cycles constantly towards a higher level. Now, for this specific sample that we are looking over here, if we plot the isotherm of this set of data, what you see is that we start from a sample that is a free flowing power, very dry, very malleable and we move to a very, very high level of water content at the end of the cycling process. If we look at the morphology of the sample, we can also see that the sample start from very, very thin powder and we end up with a cake material that doesn't have the same flowability and the same mechanical properties. So a cycling process of exposure to humidity can affect the property of our sample. The last part of my presentation will be dedicated to an application with Cameron Brown specifically. And I want to introduce how we perform this experiment on the Cameron Raman. I'm going to show you a brief example of a study of hydrate and solvate formation. So here is a DVS chamber. Here we see this. What you see over here is a glass pan. And what we use is a camera that is positioned at the bottom of the chamber and a Raman which is this pistol type pro probe that you see at the top of the chamber. So what we are doing here is taking screenshots of the sample from the bottom and collecting Raman spectra from the sample at the top. And what we can do is have this system automatically collect Raman spectra and automatically collect camera shot of the sample over time. So we can follow morphological change and we can follow structural change both with DVs and also with camera and RAM. So give you an idea of what camera shots will look like. Here is a sample of Maltodextrate. We start from a perfectly dry sample and here we are doing the exposure to high level of relative humidity. So what we do is we bump up the relative humidity to 95% and we take screenshot over time. So this is at zero that you see over here. This is the amount of Dexterin after 30 minutes that you can see starting to get wetter and wetter and and then it goes through pure deliquescent point which we are basically a puddle of water that is covering the entire sample. A more dedicated study in which we are following, for example, this is very similar to the experiment that I will describe with the ramp we are constantly increasing the relative humidity and we want to see how the sample goes through phase transition. So we start from a dry sample. Here we go through glass transition as the initial stage. And you can see here how the surface area has changed, then the crystallization and you can see the reordering of the structure of the sample from this form to this form. And at the end, the daily question point, where we have a pure puddle of water that is basically coating the entire sample is completely as a solution. So how about the ramp? How we run an experiment very basic with the Rama. So here is an example of a full material. We are doing a cycle of absorption and desorption. We are doing 0 to 95, 10% step, and we start from the storage condition of the sample, which is 50% relative humidity. And we want to do a cycle of absorption and research. We can take spectra at the end of each stage and see the difference between the sample and at each condition. So for this specific sample of material, what we notice, for example, is the fact that whenever we look at the spectra of the material that contains water over 40%, the Raman data are perfectly overlapping, just covering exactly the same point, same intensity, same position of the peak. However, when we look at the data and at the end of the drying stage of the sample, what we see is that the Rama data highlights immediately that there are different position of the peaks, new peak formation and shift in the position of the original peak. Now, this is particularly interesting for the customer that we performed this experiment for, because the customer can immediately understand if the sample is perfectly dry or it contains any residue of water. It can run around for about 30 seconds and know exactly if the spectra looks like the wet version of the sample or the dry version of the sample, and immediately understand if the knee is more dry or is it the driest condition. So this is the basic experiment we can do. The more advanced study that I want to show you today is the formation of a hydrate and a solvate, specifically of carbamazepine. And we are doing a study on water absorption for carbamazetine and then with acetone absorption. And we're going to do a study first just water, then just acetone, and then we are going to try to generate dehydrate. Sorry, we are going to try to generate the solvate with acetone and see what happens when we start pushing in water. If the stability of the solvent is much more stable on the hydrate or it moves back back to the initial form. So let's start from the first section. We are going to start with the water example. So here is the water absorption of the experimental data from carbamazepine. As you can see over here, the data has small hiccups that you can see over here highlighted in the mass reading. The mass drops over time and that's usually Indicating that this experiment was run with Raman. What is happening over here is the fact that we expose the sample to the Raman light and what it does is locally momentarily dries the sample causing the mass loss. So you can see here where the Raman was collected. So how does the Raman look like? Oh sorry for one second. This is the hydrate formation. It's perfectly reversible. It has basically a non perfect formation of the hydrate. It's not as heavy as the solvent that we're going to have a look at. Second. But how would the Raman look like? So we start from a dry sample. This is our initial condition, this is our dry material. And what we are going to do is overlap data showing what happened when we introduce more and more water on the sample. The data that we collected for water specifically does not show a significant change in the position of the peak or in the intensity of the peak. If I zoom in in this section of the data, what you can see is just a small shift in the position of the intensity of the peak. But there is no change in the actual peak's presence or there is no change, no formation of extra peak. So from a point of view of the hydrate, the Raman did not give us information from that point of view. It just gave us a more intense spectra of when we add more water. But no extra peak formation or no shift in the peak formation. That's our first experiment. The second section we are going to look at acetone. So this is the same exact sample. Starting from dry we introduce acetone. And as you can see here, the mass change is much more significant. We have a massive jump in the mass uptake specifically when we go to higher level of partial pressure. If we plot the isotherm of this data, you can see that the critical value of partial pressure that caused the formation of the solvate is over 80%. So it's basically no uptake until we get to 80. A jump up when we get to 80. And once it's formed the solvate is very stable. We have to go below 10% acetone to to get back to the initial form of the sample which is reversible. So how does the Raman data look like? So we start from our dry sample and Remember up to 70% there is no change over 70%. The change starts according to the DVS data. So does the Raman data. Agrees. So you can see here up to 70%, absolutely no change in the Raman spectra, just changing the intensity of the peak, but no actual Change in the position of the peak or formation of Q peak. If we move to 80, 90% partial pressure, you can see that there is a significant change not only in the position of the peak, but also in the formation of the peak itself. We can zoom in in the two section where we have the most interesting data and you can see that we can follow which peaks correspond to the 0 to 70% relative humidity and and sorry, partial pressure and which peak are actually new due to the formation of the solvent. So Raman is very clear here to highlight which one of the two actually contain acetone in the structure of the sample. And we can also zoom in in the higher range of the Raman spectra. And you can see here the 0 to 70 and in comparison the 80, 90%. So we can easily follow the acetone formation. It's a little bit harder to follow the water formation. So that's basically what we are highlighting here, up to 70%, no change over 80%. Perfect change in the Raman spectra corresponding exactly with the DBS data. So the last experiment that we are doing here is we are going to form the acetone, we are going to form the solvent with acetone and then we are going to push in water and see with the DVS and the RAM data if we go back to the initial form or if it's stable, if it stays there. So the first section of the experiment is again the formation of the solvent. And we know from the first experiment that we have to go over 80% relative humidity, sorry, partial pressure to get to that formation. So here is the generation of the solvate up to 80, it jumps up over 80. So that's where we end up in the first stage of the experiment. And we can obviously follow the formation of the solvate with the Raman in the same way we did in the first set of data. The second section is right here. So the sample was not removed, but it was left in that condition and we started disposing it to progressively higher amount of water while we reduced the concentration of acetone. And what you can see over here is that the mass is significantly dropped. And we know for a fact from the data before that the hydrate is actually a much lower mass uptake compared to the solvent. So the devious data are highlighting the fact that this sample is probably losing the structure of the solvent. It's probably potentially going back to the initial condition or potentially forming the hydrate. Now if we plot the data over here, there is a small increase in the mass at the end, potentially highlighting the Formation of the hydrate. But it's hard to follow because the mass uptake is significantly smaller compared to the presence of acetone. So if we look at the DBS data, it's basically telling us, okay, the hydrate is pushing in, the solvent is coming basically back out. So the acetone is less stable compared to the water. If we follow the same stage with the Raman, you can actually see that as soon as we start pushing water in and we start reducing the concentration of acetone, the this system goes back to the initial form. It's going back to the peaks of the initial sample, the dry form that we recorded at the beginning. And we can obviously follow the fact that this is the condition at the beginning, the first stage, and this is the condition in the second stage. It moves away from the acetone form, it moves closer to the water dry form. So this is highlighting basically that the introduction of water is destabilizing destruction of the acetone form form for carbamaxepine. Both suggest, both DBS and Raman data suggest obviously that the water is more stable than the acid. It's a little bit harder to define exactly that the acid, the hydrate is actually forming at the end of the experiment. That's a little bit more complicated to identify. It will be easier if the hydrate was giving a different spectra compared to the dry form. But unfortunately for this sample, it doesn't. So that concludes basically the data that I wanted to show you today. All the data that I called, I showed you today were collected in one of these three instrumentation, which are fairly similar in the structure we define as Adventure, Resolution and Endeavor. The difference in the instrumentation is related to the difference in capacity of what the system can do. So a DBS Adventure can run experiment only in water. A DBS Resolution can run experiment in water and or organic solvents. So the latest set of data was run on a resolution and an Endeavor is basically similar to a resolution in performance capacity. So it can run water and or organic solvent, but it's a multi sample sensor. It can run five samples at the same time, same experiment, five times the two system on the left side. So the DVS Adventure resolution are single balanced systems. So they run one sample at a time. So with that I would like to conclude the presentation and thank you very much for your attention and I will be happy to take any question that you have in regard to my presentation.
Thank you Damiano and I'm sure everyone else will also join me in thanking you for a great presentation. We have a really active Board here from the questions. So I know we've overrun a bit, but I think everyone would really enjoy getting a few responses from you.
Sure.
So from Zayd Asaf, he has asked how do you know that the flow is symmetrical between the sample and reference chambers? Any small obstruction for the downstream flow would reroute all flow to the other chamber. This is common in VTI systems.
Sure. So the. The way we design our instrumentation is basically related to the fact that the flow can go. I'm going to show you the schematic just to identify right here. So the flow is divided symmetrically throughout the entire system. We check the flow at the beginning from the master controller and we check the flow at the end. We guarantee that the system has no leak performance in between the entire flow and the generation is pushed perfectly symmetrically on the left side and on the right side. So we set up the instrument in a way that it does not have any form of obstruction. The volume and the size of the tubing from each side is identical and is perfectly symmetrical. Same length, same diameter, same temperature, same orientation. In that way we guarantee that the flow at is push towards both sides at the same time in the same level generation. Moreover, we can. Our system is so symmetrical that you can actually calibrate the balance on both sides and run the experiment on both sides if you want to. One of the main thing that. One of the main feature, for example, is the fact that I showed you an example here of a picture of a DBS right here. So you see we usually assign a site to a sample and assign to a reference. So this is the sample side, this is the reference side. So here, this is the sample side, this is the reference side. Nothing stops you from calibrating the balance on the reference side and then using that side for your experiment. And you can run sort validation, which is the way you check that the generation is consistent on both sides. You can run sort validation on both sample and reference side. And we guarantee you that you get in within the specification the same result of both sides.
Thank you. A question from Neil Schweitzer. Can the DVS advantage handle reactive gases? I'm specifically wondering about oxygen, hydrogen and hydrocarbons. Now I'm not sure if he means a DVS adventure, but maybe you can provide some insight there, Damiano.
Sure. So the system that we have shown right here runs from a flow procedure perspective. So they run using a carrier gas as a constant flow to push molecule of usually solvent as a vapor phase on top of the sample. We are doing some Preliminary testing to run on gases on these specific setups, specifically CO2. At the moment we are not able to provide a stock system, let's say an adventure resolution. There will to run this type of active gases. However, we have in our family of product a different type of DVs which is called DBS vacuum. The DVs vacuum is specifically designed to rather than measuring a concentration of a gas, sorry a concentration of a solvent into a gas to measure absolute pressure of gases or solvent. And that system is specifically designed to run experiment after active gases. So it can run CO2, it can run oxygen, it can run nitrogen if you want to. So that system is probably more indicated for that type of experiment. So rather than having a system in which a carrier gas pushes molecule on top of the sample constantly, in a DVS vacuum, you pour vacuum using a pump. You reach 10 to the minus 7 torr as an initial condition of drying. And then you have master controller pushing in molecule of oxygen for example. And you measure the absorption of the sample over time by controlling the pressure inside the chamber rather than controlling the concentration.
Great, thank you. A question here from Lasheng Kang. If it is irreversible, shouldn't the change in mass still be positive at the end of the desorption phase of the first cycle?
I imagine he is referring to this sample. I imagine he is referring to this slide. So these irreversibility, so these reversibility is actually related to the fact that the second cycle does not cover the same type of plot as the first cycle is not related to the fact that it doesn't go back to the initial mass. So there are two different types of irreversibility. An irreversibility that is related to the fact that it doesn't recover the initial mass that you could see, for example, in a sample like this that's irreversible, but because it has an amount of water that is trapped inside the sample at the end, this is more of a change in the structure of the sample that makes it irreversible, which means that it can dry back to the initial condition, but the structural property of the sample has changed enough that now the isotope plot is completely different. This is what is referring to. So you can have two different phenomena of irreversibility. You can have a reversibility that is related to the mass at the end of the experiment, or you can have a reversibility on the fact that the shape of the isotherm is different in every cycle that you make.
Okay, thank you. Again, a question here from Patel. Is the. So does the final Raman have any background subtraction for alum for the aluminium pan of DVs?
So the Raman are collected on a quartz fan. So you see over here we don't use metal pan to run the Raman itself. We actually use a quartz pan to run all the experiments. So all the experiments that you see over here now you can remove the background noise in the Raman collection. That's not a problem. But for these specific experiments, all the data that I show you today were collected using a coarse pound rather than a method. So we don't have the issue.
Okay, next we have another question from Zayd Asif. How can we explain the hysteresis in the water uptake in the sample from a thermodynamic perspective? If the sample is allowed to reach true equilibrium, the the uptake should only depend on the sate function RH percentage.
Right. So one of the things that is peculiar about samples and humidity exposure is the fact that, for example, let's take this example, the sample has a difference water content depending if I'm going up in humidity or going down in humidity. What I mean by that when I'm asking, for example, this is a sample of cellulose. Okay, so let's say what is the water content of cellulose at 50% relative humidity? You can see over here that I technically have two type of mass reading. I could tell you it is this mass if I were. If I'm starting from a sample that is at 40% relative humidity or dry, and I move up in relative humidity. But if I start from a sample that is wet, let's say a 90% humidity, and I drive back to 50, the water content on the sample will be different. And this is not dependent on equilibrium condition. It's dependent on the way the sample behaves. Due to the structural requirement of the sample to have a certain amount of water in it, the sample is technically a memory of what's the previous condition. Let's put it in that way. It has a certain amount of water that will stay in the structure if it's wet, and it will require more energy to move in if it's dry. From a thermodynamic point of view, every step that you do require a certain amount of energy to move in or to move out. And the process of moving water in and out require energy that is independent from the how long do you wait for it to reach equilibrium? It's more related to how thermodynamically active are the molecules Trapped inside the sample. So if the sample already have molecules inside it, it will require more energy to get them out. If a sample has no molecule inside it, you will require more energy to move them in. So depending on the way you are going up or down, it will have a different effect. Now that's not all to say that all the behavior are the same. This is specifically related to bulk absorption. So when the molecules are going through the bulk, if you look at condition for example on surface absorption. So right here this data, the first section is pure surface objection. And in this case there is no bulk solution. There is no interaction of molecules through the bulk. So thermodynamically the molecule have no energy required to move in or out. In that case there is no gap of hysteresis. And if I say what's the water content of this molecule at 30% it doesn't matter if I'm coming from the top or if I'm coming from the bottom, it will have the same number. But if I go to a different condition at a higher condition that it makes a difference related to the energy required for the molecule to move in and out. Thank you.
A question here from Tiantian Yin. They ask what kind of information could we find by running a sample two times.
So one of the main important factors that I highlighted during the presentation is reversibility and stability. So we are looking at here for example here this sample is perfectly reversible. I do two cycle and I can see that I get exactly the same set of data in the first set and the second set. And I can see over here that my isotem flow right here is perfectly overlapping. That means that my sample is stable and I don't have to worry. If I get the sample wet, I can always drive back to the initial condition. So I don't have to worry for example about storage condition or about preconditioning of the sample. Because whenever I want to, I can re dry back the sample to the initial form. If I look at something like this, for example, this sample changes over time which means that if I want a sample that is perfectly dry and if I want this anhydrous form, I need to be careful to never expose the sample over 80% relative humidity. Otherwise the transition clicks over and I go to a situation that is irreversible. How do I know this is only because I did two cycles? If I only did one cycle, I can assume that the second cycle is the same. But I don't know it here. By doing it as two cycle, I Can see the difference between what was the sample before there was exposure and what's happened to the sample after the sample, the water exposure.
Great. Do you have time for one last question, Damiano?
Sure.
Perfect. This one has come in from Subramanya Surima. How long do we have to wait in each step for material to attain equilibrium?
Right. So the way our instrumentation work is the fact that we usually run experiment not as a fixed time, but we leave the instrumentation to control the equilibrium condition on its own. So what I mean by that, you see this data and you see the equilibrium stage for each step. Some stages have longer steps, like this one is very long. Some stages have shorter steps. This is because the sample require more time to reach equilibrium in some stages compared to other. Now what we do basically in those stages is use a criteria of equilibrium rather than using a time. So we can, if we want to say run this stage for, I don't know, four hours or six hours. However, the best way to run the experiment is rather than selecting a time, selecting a delta mass over delta time criteria. The criteria allows us to set value of equilibrium that we call, let's say equilibrium condition of the mass. And what the system does is it will run the experiment to that stage, to the relative immediate condition until the mass reading of the balance is below the criteria that we set. Once it's below that criteria, it considers the sample equilibrium stage and then it moves automatically to the next stage. So what it does is basically adapt the length of each stage to the equilibrium criteria required by the sample itself. So in that way we don't have to know exactly how much time it requires for each stage to this equilibrium is done automatically by the software.
Great. Thank you, Damian. I'm afraid that is all the time we have for today, people. I'm afraid we've just run out of time. Thank you to all of you for attending and for really being so engaged in the presentation and asking so many questions. Any of you, we haven't been able to get round to and address your queries today. We will endeavor to get round to you after today's session. I would like to remind anyone if they do have any direct questions for us, you can email myself directly@marketingurfacemeasurementsystems.com and I'll be able to pass your queries on to Damiano or anyone else at our team. I hope you will join me again in thanking Damiano Cataneya for taking part and giving a very insightful and very informative presentation today. Damiano would you have any final words for the audience.
That's all for today. Thank you very much for your attention, and thank you very much for all the questions that you have for me. Thank you.
Thank you, everyone, and we'll see you next time.
More from Prof.

Webinar: Advances in Measuring Gas and Vapor Permeation Through Membranes and Barrier Polymers

Webinar: Determining Solubility Parameters of Bacterial Cellouse Through Energy of Adsorption

Online Webinar: Recent Technological Advances in Adsorption Based Direct Air Capture

Online Webinar: Surface Area of Pharmaceutical Ingredients at Real World Conditions by IGC



Hybrid Workshop: Measuring Material Vapour Pressure Properties Using Advanced Sorption Technique

PCL Hybrid Workshop: Recent Advances in the Characterisation of Pharmaceutical Powders


Using Advanced Techniques to Test the Performance of Recycled Bathroom Tissue | A video summary
