Impact of Freeze Drying Conditions on Stability of Food and Pharmaceutical Materials
Mei Xiang Guo shows how dynamic vapor sorption measures moisture stability in freeze-dried foods and drugs. The method maps when materials crystallize and become unstable, and can detect tiny amounts of amorphous content using an acetone trigger. Practical setup details and real data from protein-sugar formulations included.
Questions this video answers
5% relative humidity per hour.
About 88°C (consistent with reported literature 87–92°C).
Acetone; crystallization observed at ≈60% relative concentration (reported as ~60% RH for acetone exposure).
Approximately 4.8% amorphous content for the example sample.
About 0.2 (stated as 0.2 amorphous content—context indicates ~0.2%).
Chapters
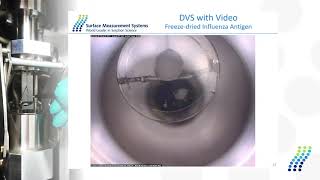
Thank you for joining our webinar. I'm Mei Xiang Guo. Today we will focus on the impact of freeze drying conditions, on the stability of food and farmer materials with the application of dynamic vapor sorption. So first I will introduce some theoretical background about the sorption process, followed by a brief introduction about DBS technique. And then we will go through some applications in the stability stories, including the vapor induced phase transition and the amorphous quantum determination. So for the characterization of the solid material, we will generally just use energy as a probe, like the spectroscopy method, where we can get some analytical and structural information, or we can also use the heat as a probe to get some thermodynamic information. And with the dbs we are using the molecules as the probe and its absorption technique. And by marrying the sorption and desorption isotherm, we can get all the information related to the chemistry structure as well as the thermodynamics. So the ray molecules interact with the solid will be either on the surface or it will go to the bulk of the material. And the speed they trap into the material and the speed come out of the material will all give us the information about the property of this solid sample. So in this case we can predict some behaviors of this solid material like the shelf life or the stability of this material at different temperature and humidities. So when we talk about the absorption on the surface, it will be either a physics option which is a weak interaction and it's usually a reversible process. So in this case all the properties we measure is mostly related on the surface, like the surface area, the surface energy, surface roughness as well as the heat absorption. And for the another absorption is the chemist option which is the most strong interaction. And it's usually an irreversible process. So this time the probe molecules will form some covalent bonds on this surface. And the chemist option is usually for some special design material to have a particular interaction with some probe molecules. And here some of the property could be measured like the active surface area, the catalyst dispersion. And in terms of absorption it will be either the box option where the probe molecules will penetrate the surface and then go to the bulk of the material. In this case, the desorption step is usually a diffusion limited precise. And the kinetics of this box option is usually much slower compared to the physics option. And property could be measured like the vapor induced phase transition, which we will go in detail later. And some other properties like the total suction capacity or the solubility parameters. The Diffusion coefficient for the thin film sample or the membrane samples. And the last interaction is the absorption into the lactus structure. Which means the material will change the structure in in presence of water or organic vapor. And this will lead to the formation of hydrate or solute. So in this case we can study the structure of this hydrate as well as the kinetics information. And all those different interactions between the solid and the probe molecule will give a different type of sorption desorption, isotherm. And from the DBS result we can calculate all those physical chemical properties of the solid materials. DBS dynamic vapor sorption technique basically is a gravity measure method to measure the mass change of the sample at a different concentration of moisture or organic vapor. It has the ultra balanced in the system with a very high sensitivity. So very small amount of sample is needed for the measurement. Euler is just less than 10 milligram and compared to the static method. DBS has a continuous flow of the probe molecules to the sample. So a much faster equilibrium could reach. And the experiments were done at real condition, a real world condition just at ambient temperature and pressure. Which keeps the original look of the sample for the measurements without any changes. And this one is very important for some of the sensitive material like the freeze drying material as well as some pharmaceutical material with the hydration waters. We don't dry out this water during the measurement. So here's an example, the schematic example of a DBS resolution. It's a system can mirror both sorption of water and organic vapor as well as the competitive absorption of two different components. So in this system we have a macro balance in the middle with a resolution of 0.1 microgram. It's connecting to both the reference pan and the sample pan. And the dry air or the nitrogen will be used as the carrier gas. And it will mix with 100% saturated vapor in ratio to get a certain relative humidity. And this mixture will go to the chamber for the moisture uptake. And the mass will be recorded continuously with very high sensitivity. So the whole stand of this one will be set into a temperature control incubator with a very good stability. And we use the electronic probe for the water and speed of sound sensor for the organic vapor to ensure the actual generation is matching with the target pressure pressure. And the system can also be equipped with a preheater in the bottom of the sample pan to allow the precondition of the sample at a higher temperature in situ before the experiment. Or we can also add a camera at the same position. To take some sample image during the experiment to record any change in color or any change the form during at different conditions. And here's an example with the circle sample from the ramping experiment from 0 to 98% that the sucrose will change the form from the crystallized state. Like go through the glass transition the crystallization as well as changing into the liquid form at the end. And another example with freeze drying material that the sample at a certain humidity will shrink and then collapse and then go to a liquid form in the end. And so here shows the video function is a very powerful tool to get some change in nature along with the DBS data. And another example is DBS can also be integrated with the Raman or the IR spectroscopy to take the spectra at the end of each relative humidity step. Giving more information about the sample. Like the changing from the amorphous state to the crystalline state at different relative humidity. And those are all the information we can get from DBS data during the experiment. And then we can go through some applications. And we will focus on the discussion about different vapor induced stability as well as the disorder of the pharmaceutical material. So the first example is a typical DBS data with the right starch sample. The blue line is the target partial pressure at different stage. In this case it's a typical water substance experiment from 0 to 90% RH with 10% intervals. And the red line is the mass change of the sample. So at each relative humidity the sample will pick up the moisture and then reach an equilibrium. And then it will jump to the next stage automatically. And it's a two cycle experiment with sorption and desorption process. And the first stage here is just a drying stage. Just the continuous flow of the carrier gas to the sample to reach an initial mass of the sample. And for the calculation. So here is the mass plot for the sample between the change of mass raised time and if we get the change of mass at the end of each stage and plotted against the relative humidity, then we will get the isoscerm plot for this sample. And this is sorption desorption isotherm. And the desorption is going back to zero, which means it's a reversible pore size. And the uptake at 90% RH is quite high above 20% which indicates this is a box option dominating mechanism. And the gap between stoption desorption cycle is the hysteresis gap. This gap also tells information about the diffusion is like the desorption is a diffusion limited precise. So this all the information we can get from a set of DBS experiments. And then we can go to the second study about the vapor induced phase change. The water could act as a plasticizer to reduce the TG value of the solid material. And from the DBS data we could see a very clear transformation between different phases. And here's an example of the ramping experiment. It's very similar to the temperature ramp in the DSC method. So in case of DBS we ramp the humidity from 0 to 90% RH at a constant rate. So it's very clear in the result here that the water soption is beginning with the surface option first and then after a certain humidity the vapor uptake will increase dramatically as the box option is dominated here. And the transition between the surface option and the box option comes for the glass transition. And from the slope we could easily calculate the glass transition humidity of this sample at a certain temperature. And as the humidity keeps increasing, you will see the sample will also went through the crystallization step that the water uptake will decrease dramatically which is due to the crystalline state, it has less surface area as well as the sample will have less sorption behavior compared to the amorphous state. So according to professor from UCC Ireland, he also reported the decrease in TG value of the water activity using the DSC method. And the difference between the two method is that in the DSC method if we would like to measure the TG at a different Rh, then we need to put the sample in a jar of certain RH to reach the water activity level. And then we seal the sample inside the DSC plan for the temperature ramping. So in this case the humidity during the measurement is not recorded. Well, for the DBS method we have a continuous control of humidity during the experiment. So the glass transition method, the glass transition humidity got by the DBS method is more accurate in this case compared to the traditional method. And here's an example for the Melto sample for the dependence of TG value with the changing rh. So with the presence of moisture as the plasticizer, the glass transition temperature will have a significant decrease with the increasing of humidity. And the TG value for the maltose at dry condition here is about 88 degree is just highly consistent with the reported value in the literature between 87° and 92°. So this means the DBS data is compatible with other traditional method as well. And if we do a series of ramping methods at a different temperature and then we will get a 2D mapping of the metastable material. And and this plot could be used to predict the impact of different conditions on the stability of the material. The blue line here is for the blast transition and the red line here is for the crystallization. So if we have a certain conditions like a certain combination of temperature and relative humidity, then we can say which the point will locate in which region to predict the sample is a crystalline state or a stable amorphous state, or the sample is just unstable, will change the structure anytime during the application. So the case study for this application is the impact of protein concentration on the phase transition of protein and sugar formulations. So in the development of the solid state material we water has a very important role on the long term stability. The activity as well as the drug carry interactions to prove the instability of the protein samples. They are always mixed with some amorphous sugar by different methods like the freeze drying or the spray drying. And it's very important to study the soption behavior of this protein sugar mixture to understand the interaction between different components and as well as to improve the formulation development for the final products. So in this study we would like to investigate the BSA concentration on the moisture absorption behavior for both maltose and sugar sample. So we have the freeze dried protein and sugar mixture at different ratios and then we do a ramping method as we mentioned previously. And the experiment was done at 25 degrees. And here's the result for the maltose and BSA protein mixture. So it's very clear that the black line is for the pure BSA protein and the red line is for the pure maltose. And the other lines are for the protein sugar mixture. And here for the glass transition it happened at lower rh. And the sample containing maltose has a glass transition humidity around 26% RH which is consistent with the reported value in the literature that is 30% RH at 25 degree. And this kind of glass transition humidity doesn't change very much with the increasing BSA concentration. The lines are just overlapping here, which means the protein concentration has very little effect on the TG of this freeze dry mixture. And a crystallization event is observed over 40% RH for all the maltose continuum samples. And this crystallization point is also shifting to higher level with the increasing of BSA loading. So this is probably due to the protein sugar interactions. Well in a delayed sugar crystal nucleation that will result in the inhibited crystallization. So in this case we can conclude that the BSA protein will act as a stabilizer that make the Amorphous maltose more stable with the protein sugar interactions. And a very similar result is done for the sucrose sample. So here the three stages for the transition is very clear with the ramping of humidity that the glass transition is happened at lower RH and the protein concentration has very little effect on this glass transition as the lines are just overlapping and the crystallization happened above 50% RH here and this one is affected significantly by the protein concentration. The BSA content and the crystallization point is also shifting to a higher rhea, indicating that the protein sugar interaction will also stabilize this freeze drain mixture as well. And at the end of the RH above 87%, all the samples containing sucrose will become in a liquid form. And this result is just one of the formulation between the sucrose and protein sample. And we also have another study comparing between different formulations caused by different free strain conditions. And here's the comparison plot. The dashed line Here is for FD1 is the formulation we introduced just now. And the solid line is another formulation got by the another freeze drying condition. And the two freeze drying conditions didn't affect much for the glass transition had happen at very low concentration of Rh, which means the conditioning has very little effect on the glass transition of the sucrose. The lines are just overlapping here. However it's more obvious for the crystallization of the sucrose that FD1 formulation will crystallize about at around like 50% RH at lower rhythm. Well, for the FD2 formulation the sucrose will crystallize at a higher RH after 60%. So this shows the mixture got by the second freeze drying condition that the second mixture FD2 have a lower content of amorphous content or a better protein sugar interaction. So different freeze drying condition will improve the stability of the final products. And DBS is a very useful tool for to investigate this protein sugar interaction. To study the impact of different freeze drying conditions of the solid materials. As for the last study is for the disorder in the pharmaceutical material. So during the processing of pharmaceutical solid, for example for the milling or the crystallization of freeze drying, it will generate different degrees of disorder in the form of like crystal defects as well as the amorphous regions. And those disordered material are inherently metastable, that is easier to change the structure during the storage or the application. So it's very important to study the formulation like the level of this disorder in the formulation design as well as the performance of the storage for the final products and DBs can be used to characterize this disorder. And there is a method we can use to determine the amorphous content in this disordered material. So this method is based on the fact that the material will squeeze out any of the sorption molecules during the crystallization step. So we measure the vapor uptake before and after this crystallization and the difference will give the amorphous content of this material. So to start the method first we need to find a certain kind of vapor that will induce the crystallization. So in this case we find acetone, will induce the crystallization at 60% RH and the amorphous content will will become to the crystalline state. And then we will expose the sample of interest into 30% RH. So at this time the sample is with amorphous and crystalline state. And then we will also expose the sample to 85% RH. In this case, all the amorphous states will confirm into the crystallized state is the crystallization of the amorphous phases and a further exposure to 30% RH for the fully crystalline material. And in this stage all the sample inside the material is the crystalline state. So the difference between the first and the last stage is the amorphous content needs to be calculated. And here we calculate around 4.8% amorphous content for this kind of sample. So the advantage of this method is we don't need to do like calibration curve by mixing of different sample ratio. But we do need amorphous standards for the marine for the measurement as a reference material. So every other value will be percentage to this reference material. About reference value. And this is a very accurate and repeatable method to determine the low amorphous content. But it also has a low detection limit of 0.2amorphous content in the material. So comparing with the traditional method like the DSE method and XRDA method, DBS method is prone to give a more accurate result on the amorphous content determination. And we have four different methods for the determination of this amorphous content and this is just one of them. So if we're interested in this topic, we could send you the other method along with the application notes through emails later after the meeting. So for the conclusion, DBS is a versatile and sensitive method for the material characterization. So it could be used to characterize lots of physiochemical properties and it can also be used to investigate the protein sugar interaction and determine the moisture induced phase transition as well as DBS can also be used to determine the amorphous content and then Characterize the disorder in the pharmaceutical material. And DBS is badly used for the stability study of the pharmaceutical and the food samples. And that's all for my presentation. I hope it's clear to you. Thank you for listening. So if you have any questions, we are happy to help with your questions. Thank you, Brett.
If, if anyone has any questions, feel free to either send them in the chat box or you can unmute yourself and talk over over your mic. So what's the difference between ramping method and a step method?
Like the typical method, the typical data we introduced here is a step method. It's just like at certain stage the sample will reach an equilibrium and then jumps to the next one. And the ramping method is we increasing the humidity at a constant rate, like this one, from 0 to 90% RH and it doesn't reach equilibrium. It's just a quicker method to get the TG value of the humidity.
What's the ramping rate for ramp experiments?
This ramping rate is 5% per hour. And we also did experiments, we varied the ramping rate and in this case we plot against the correlation between the ramping rate and the humidity gas like the tgrh and then we can find a critical TGRH for the storage of the sample during the applications.
Okay. Someone had asked, how can you determine the right solvent to crystallize the sample? Like acetone, for example?
Yeah, that's something we need to do during the method. Establish that like we need to find the right solvent induce this phase change at different temperature as well.
Does the humidity percentage at which TG and crystallization occur change the humidity ramp rate?
Sorry, could you.
Does the percentage at which TG and crystallization occur change the humidity ramp rate? I'm not sure what TG is.
Can I just add here first? Regarding the previous question about the. About the right solvent for crystallization, I must add that the mass change, the significant drop in mass change basically indicates a phase transition. And from that you find out that basically this is the right solvent. If it was water, for example, instead of acetone, you wouldn't see the big mass drop that you see at around 60% relative concentration of acetone. So from here you know that crystallization is occurred and that's the right solvent. With regard to the other question about the percentage humidity and whether the ramping rate would change, the ramping rate wouldn't change because basically the system has a combination of very accurate mass flow controllers and valves to maintain the humidity and the ramping rate of the humidity. So that's One of the advantages of the system is that it can maintain very accurate relative humidity or concentration of the solvent at a particular temperature. So it wouldn't change.
Okay, can CO2 sorption be performed?
Yes, we have different models for DBS instrument and the CO2 could be performed with the vacuum system. So in this case we don't have a carrier gas and CO2 adoption in the vacuum system is very like typical study. And yeah, that's it.
How many samples can be loaded for each experiment?
So for most of the system here with the flow system and the vacuum system, we can only have one balance inside the system. But we also have a more advanced version. The endeavor has 5 balances so we can load 5 sample at 1 time and sharing the same methods. So this is a more effective way to run for the experiment.
Okay, for the protein sugar study, can we say that BSA will improve the stability of maltose and freeze drying methods and make a difference in sucrose? Would freeze drying methods make a difference in maltose formulation as well?
Yes, the different freeze drying methods will increase or reduce this kind of sugar protein interactions. But the effect for the maltose may be not as significant as sugar's one due to the different interaction between this kind of sugar with the protein sample.
Okay, is the technique recognized by international organizations?
Yeah, we also have a slide showing that DBS is already recognized by different regulation bodies like the US or the European Pharmacovia and it will also become a standard in the Japan and China as well. And we also have a CFR version of the software that can track any changes during the operation and follow the regulations from FDA from us.
Okay, I don't believe there are any more questions unless someone has a last minute question. We'd be happy to answer anything that you would like to know. What's the difference between configurations of DBS resolution?
You mean DBS resolution with different models?
Maybe difference between version.
Well, here is the advantage is the water only option. So here we only have one water bottle. So like the bottle for only water and we only have one probe for humidity and for the resolution step the system we can run both water and organic vapor and we can also run the competitive sorption of two components like the organic vapor at a certain background humidity or two organic vapors like a competitive sorption on the surface. So it's just basically different number of the water solvent bottles.
Amish and also the preheater options and other options, you know, the ramen and other configurations that you can have for the system.
Yeah, these are different models and the specifications are on the websites available as well. And with those systems we can integrate with the ramen and the camera. But the most smallest one, we can't use the preheater or other options.
Okay, I think that concludes all the questions. Unless thank you, there's any other stragglers.
I would like just to add to thank me for a very nice presentation and remind everybody that this was focused on farmer and food materials, the stability and amorphous content measurements on pharma and food materials. But of course the technique is not limited to this and we are happy we have a range of applications for other materials and other measurements and we are happy to collaborate and try new materials. And we would like to encourage you to contact us if you have some new materials or new applications which you would like us to try your samples with the DBS as well. Thank you very much for your time.
So thank you very much for listening. If you have any further questions about DBS, please email us at inforservicemerimentsystem.com or visit our website, www.servicemeriumsystem.com. thank you.
More from Prof.

Webinar: Advances in Measuring Gas and Vapor Permeation Through Membranes and Barrier Polymers

Webinar: Determining Solubility Parameters of Bacterial Cellouse Through Energy of Adsorption

Online Webinar: Recent Technological Advances in Adsorption Based Direct Air Capture

Online Webinar: Surface Area of Pharmaceutical Ingredients at Real World Conditions by IGC



Hybrid Workshop: Measuring Material Vapour Pressure Properties Using Advanced Sorption Technique

PCL Hybrid Workshop: Recent Advances in the Characterisation of Pharmaceutical Powders


Using Advanced Techniques to Test the Performance of Recycled Bathroom Tissue | A video summary
