Shelf-life Assessment of Food Products by Dynamic Vapour Sorption by Meishan Guo
A 30-minute webinar by Meishan (Mei Shan) Guo introducing Dynamic Vapour Sorption (DVS) methods and case studies for assessing shelf life and stability of food products. The talk covers sorption fundamentals, DVS instrumentation and modes (step and ramp), isotherm interpretation, vapor-induced phase changes (e.g., crystallization, deliquescence), permeability/diffusion measurements (Pincell/pain cell), heat of sorption, water activity determination, and coupling DVS with video and spectroscopy for comprehensive material characterization.
Chapters
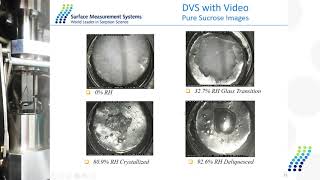
Thank you for joining our webinar. I'm Mei Shan Guo. In the following 30 minutes we will introduce some case studies and applications related to the shelf life and the stability of the field samples. And here are some of the topics we will cover today. So first we will have a brief introduction about the soption process and then we will talk about the DBS technique and go through some of the applications in detail like the isotherm measurement, the vapor induced phase change, the permeability stories as well as the water activity determination with pain cell. So moisture is everywhere in the real world and the relative humidity can vary in different areas in the world and the interaction of the moisture with the solid material have great impact over a wide range of industries including pharmaceutical food, packaging materials as well as personal care products and especially in the food industries. Moisture will cause lots of problems like the powder caking that will affect the fallibility of the powder or the problem like the instability of the products both physically and chemically. And moisture will also induce the phase transition, for example the dissolution or the deliquiscing of the sugar at high RH conditions. So it's very important to study the moisture absorption behavior for the prediction of the shelf life or the stability of the food products. One of the popular properties we will mirror especially in the food industries is is the water activity which measures how tightly the water molecule is bond to the solid materials at a certain temperature. We could get this information from the water substitute isotherms and also calculate some other properties like monolayer content, the heat absorption diffusion constant or the permeability of the packaging materials. And there are some of the water activity meters in the market which are simple and quick away for the analysis. But it has the disadvantage like it only measures the free water in the material, not the total moisture content. And also the experiment condition is not under control. So we cannot study the factors that will affect water activity like the temperature or relative humidity and it's not suitable to measure the moisture transmission rate of the packaging material as well. So we are looking for some other method for the material characterization. So for the characterization of the solid sample we will either use energy as a probe like some spectroscopy method where we can get the analytical and structural information, or we can use heat as a probe like the TGA method to get the thermodynamic information. And here with DBS we use molecules as a probe and its absorption techniques. By measuring the isoscerms we can get all the information related to chemistry, structure as well as thermodynamics and the way molecules interacting with the solid will be either absorbed on the surface of the material or absorbed into the bulk of the material. And the speed they trap into the material and speed the molecules come out of the material will give us the information about the property of this solid material. So in this case we can predict some material behavior during the precising performance or the storage like the shelf life or the stability of the food sample at certain temperature or relative humidity. So when we talk about the molecules absorbed on the surface it will be either physicoption which is a weak interaction and usually a reversible process. And all the property we can measure by physics option is related on the surface like surface area, surface energy, pore size distribution or heat absorption. Or it can also be camisorption which is a stronger interaction and usually an irreversible process. The probe molecule will form some covalent bonds on the surface and the property related to chemisorption is like active surface area or catalyst dispersion. And in case of absorption it will be either box option that the probe molecule will penetrate the surface and then go to the bulk of the material. So during this step the desorption is usually a diffusion limited process. And there will be different kinetics for desorption adsorption and the kinetics for this kind of box option is usually much slower compared to physics option and property could be measured here like the vapor induced phase change which is related to the stability of the material and other property like the total sorption capacity, solubility parameters, diffusion coefficient or the permeability of a packaging material. And the last one is the absorption into the lactose structure which means the material will change the structure in the presence of water or organic vapor leading to the formation of hydrate or solvate. And in this case we could study the structure of this hydrate as well as the kinetics information. So in the case of stability or the shelf life studies for food sample, we will use water as the probe molecule to measure the different interaction between water and the food material by different types of sorption desorption isotherms from a set of DVS experiments. So DBS method is basically a gravimetric method to measure the mass change of the sample at different concentration of moisture or organic vapor. It has the ultra balance in the system with a very high sensitivity. So very small amount of sample is needed for the measurement. Usually just less than 10 milligrams and compared to the static method. EVS has a continuous flow of the probe molecule to the sample. So a much faster equilibrium could be achieved and the experiment can be done at real work conditions at ambient temperature and pressure. This keeps the original nature of the sample without any damage. And this is very important for some sensitive or fragile material like the freeze drying material or some formal material with hydration water. And here's an example with DVS resolution which we can measure both the sorption of water and organic vapor as well as the competitive sorption between two different components. So in the system here we have a macro balance with the resolution of 0.1 microgram. It will connect it to both sample pan and the reference pan. And the carrier gas in the system is nitrogen or dry air. And there will be two reservoirs, one for organic vapor and one for water vapor. The different concentrations of moisture or organic vapor will be generated by the mass flow controllers by mixing the carrier gas with saturated vapor in ratio to get a certain relative humidity or partial pressure. And this mixture will flow to the sample chamber at a constant rate. And the sample inside the chamber will pick up the moisture and the mass change will be recorded. So the whole stand here will be sit in an incubator with the temperature range from 5 to 85 degree. And under this sample chamber here we can also install a preheater that allows to precondition the sample in situ before the experiment and the temperature up to 200 degree or at the same location here we can also install a camera to take the sample image during the experiment, recording any change in color or change to different forms. So here's an example with the Silker sample. So you see there is a different phase transitions at different relative humidity. And here the video function is a very useful tool to compare the change in nature along with the DVS data. And DVS can also be integrated with Raman or IR spectroscopy to take the spectrum at the end of each relative humidity stage. And here is the example of the lactose sample. So from the mass plot here you see at 60% RH here there is a significant decrease in the mass change which indicates amorphous to the crystalline phase change. And from the Raman data here it shows a clear structure changes at high relative humidity, especially above 60% RH, which also confirms with the watersorption data in the massplot. So we have two different software. The control software is for the experiment setup and the analysis software for the result calculation. And both of the software are very user friendly. The analysis software is based on the Excel macro, so the standard version is for the math plot. The isotherm Plot the baseline correction or some other calibration in the system. And the advanced version is for the calculation of BET surface area, the heat absorption, the activation energy of diffusion. This calculates the energy barrier and correspond to the stability of the material. And also like the amorphous content for the food or the farmer materials or the permeability of the diffusion for the packaging material. And we also have the isochrom version which could be used for the pore size distribution for microporous material or misoporus material. And it's also integrated with different models. And the most popular one with food industry is the Young and Nelson constant calculation. So for the results we basically have two different methods for DBS experiment. The first one is the step method that we increase the humidity step by step. And here is an example with the red starch sample in the kinetics information of moisture sorption. So the blue line here is the target relative humidity at each stage. In this case it's the water sorption from 0 to 90% RH with 10% intervals. And the red line is for the mass change at different stage. And you see at the end of, at each stage the mass will reach an equilibrium and then jump to the next stage automatically. And this is the two cycle experiment with sorption and desorption. And the second cycle is just exactly the same as the first cycle which demonstrate there is no irreversible changes in the sample. And this, the first stage here is the drying stage, just flowing of the carrier gas to the sample to get initial mass of the sample. So this is the mass plot between the change of mass against the time. And if we take the change of mass at the end of each stage when it's equilibrium and plotting against the relative humidity, then we can get the exotherm plot between humidity with the change of mass. So this is the sorption desorption cycle. The shape of this isotherm will give us the mechanism of the sorption behavior. Like first of all, the sorption at 90% RH is about 20% change in mass, which indicates it's a bulk absorption dominating mechanism. And it's a closed loop sorption desorption cycle. That the desorption is going back to zero confirms with the reversible pore size and the gap between sorption and desorption which is the hysteresis gap indicates the desorption step is the diffusion limited pore size. Also confirmed with the box sorption mechanism and the shape of this isotherm is A typical type 2 isotherm widely found in the food materials which shows a monolayer region for to begin with at low RH and then go to a multi layered region for light strongly bond water. And then it's the free water region. At high relative humidity conditions, the free water is used for the growth of bacteria or the yeast that will destabilize the material. So we can use this kind of water isotherm to optimize the shelf life and the stability of of the food materials. There are different types of isotherm. The type 1 isotherm is typical for the micropowers material like silica or active carbon. The type 2 and type 4 isotherm are typical for the food materials. That the water molecules will interact with the surface forming the monolayer and then interact with the first layer to get the multiple layer. And the type 3 and type 5 as shown are basically the condensation on the surface that the water molecule will form the cluster on the surface rather than covering the entire surface with monolayer. So in this case the probe molecule has weak interaction with the solid material and the monolayer moisture content can be considered as the most stable state. So we can use the isotherm to predict or optimize the shelf life conditions. And one of the popular equations we use is the Young and Nelson equation to give the constant about how much of the monolayer or the multiple layer are forming on the surface. And the other constant here gives the idea about the degree of interaction between the probe molecule and the surface of the material. So these are some useful parameters for the shelf life and the stability of food material. With the stack method, we also have another method with the ramping method which is a quicker and easier way to measure the stability of the solid material. And this is very similar to the DSC temperature ramp. So in case of DBS, here we ramp the humidity from 0 to 90% rhythm at a constant rate. And here shows the result for lactose. So the water solption is first begin with the surface option. And after a certain point of humidity the water uptake will increase dramatically. Where the box option is dominated here. And the transformation between the surface option and box option could be regarded as the glass transition. And from the slope here we could calculate the glass transition humidity for this sample at certain temperature. And when we keep increasing the humidity, the sample will also go through the crystallization step that the water uptake will decrease dramatically, which is due to the crystalline state has smaller surface area as well as less option capacity. So that's the ramping experiment result at a certain ramping rate. And if we vary the ramping rate, we can get the correlation between the ramping rate and glass transition humidity. And from the intercept here we could calculate the critical glass transition humidity at zero ramping rate. And this is very important for the storage of this lacto sample. And if we do a series of ramping experiments at different temperatures, we we could get this 2D mapping of the metastable material. So the blue line here is for the glass transition and the red line is for the crystallization. And from the plot here we could easily predict the stability of this material at certain temperature and relative humidity. So another example is the ramping experiment with coffee granule which is opposed to the ramping from 0 to 90% RH and then decrease to 40% RH. So during the desorption step the sample is quite stable. Before 60% RH here there is no significant uptake. But after that there is a sharp increase from 60 to 90%. So at 90% RH here with the institute video image it's quite clear to show a change in color between the different samples, between the same sample at different conditions. And during the decorption here the sample mass change reached the maximum at 75% RH. So we can say the delinquency is somewhere between 90% RH and 75% RH. And this is the stability study about the coffee granule. And we have a similar study with the protein sugar interaction to stabilize the sugar content. Where the red line here is for the pure sucrose sample and it is mixed with the BSA protein in ratio to investigate any changes in the mixture stability. So the crystal point for the pure Sucrose is about 50% RH. So with the increasing of BSA concentration this crystallization point will shift to higher rhythm. Which means the BSA has a stabilization effect on the sugar content which is probably due to the protein sugar interaction may delay the sugar crystallization crystal nucleation. So this will result in the inhibited crystallization. And DBS is a very useful tool to measure this kind of phase transition inside the sample at different conditions. And another very useful parameter is the heat absorption for the shelf life and stability study. So to calculate the heat absorption we need to do the experiment at least two different temperature. So here we have the fresh and aged sample at 25 and 35 degree. The aged meat is just the same sample after one week time in the fridge. So from the result for the fresh sample we can see the temperature has very little effect that the two lines are almost overlapping here. Well, for the aged meat the uptake at 25 degree is relatively lower than the uptake at 35 degree. And from the isotherm we could calculate the heat absorption with our macros easily. And here's the result shows that for the fresh meat sample the heat absorption data keeps increasing with the increase in humidity, which means the interaction between the water and fresh meat is also increasing with increasing humidity. Well, for the aged meat here the interaction is much less and in fact is that the probe molecule is just interacting with the other probe molecule resulting in the condensation rather than interacting with the meat itself. So another study is the diffusion of the packaging material where we can use a special device called pain cell to measure the diffusion or the permeability of the thin film sample. So we can put the packaging material in the middle of the pain cell and close with two rubber O ring here the solvent could be either placed inside the cell or it can be placed outside the cell and keep the inside of cell with 0% rhythm. So the vapor molecules will go through the film with one direction and the one way diffusion coefficient could be measured here. And here's an example of the CO diffusion study on resolution with CAPTAIN sample. The methanol molecule here represents for the flavor molecules and the water is for the moisture content. So the experiment is set for three different stages. The first stage here is the methanol only soption at 50% RH and that is the water only soption at 20% RH. And the last stage is the 50% methanol in the presence of 20% RH water. As the background and the experiment were done at both 25 and 45 degrees to to compare the diffusion coefficient at different stages. So from the result for the mathenode here we can see the temperature has very little effect on the math null diffusion that the two coefficients are almost the same and the lines are just overlapping. Well for water here the diffusion rate at 45% 45 degree is almost five times larger than 25 degree one. And with the presence of water as the background, the diffusion rate for the last stage, the methanol is obviously improved at higher RH that the diffusion constant at 45 degree is almost twice larger than the 25 degree. And there is a huge difference between the plot at the last stage with the presence of water as well. So this is a story related to the packaging material about the diffusion and the permeability. And we can also use the Pincel for the Water activity determination inside the food sample. So here, by doing a series of calibration with different cell solution, we could measure the water activity content in the food material. For example, here we married a honey ketchup or starch sample at this kind of condition. And the value we get from the DVS experiment have very good agreement with the literature value as well. And similarly, we could also measure the diffusion rate of some flavor molecules by putting this kind of liquid inside the cup here and then seal with the cell with the storage bag. And we measure the mass loss and calculate the vapor flux for this certain kind of flavor molecules. So here is the water activity and vapor permeability measurement for the first sample. So in conclusion here, DVS is a very versatile tool for the material characterization, especially in the food industries. We could study the moisture absorption behavior to determine the shelf life of the food materials. And it can also be coupled with video or spectroscopy to get a complete understanding of the material stability. I hope you will find the DBs very useful in your future research. And that's all for today's presentation. Thank you for listening. I hope it's clear to you. But if you have any questions, we can discuss them now. Thank you.
We are now open to questions. Question from. For the pain cell, I understand that the dimensions are pretty small, about 5 to 10 millimeter in diameter. How do one cut the packaging film in in a consistent way ensuring no warping or tearing of the film?
We can use some tools in the market to cut the film in a certain desired area like the one for the rubber bump. That kind of tool we can use to cut the film just the same area as the cell area. We use that kind of sample for the measurement.
We also have a video showing all the details, Michelle, don't we? Perhaps we could send the link later to those who are interested.
So another question is, what's the difference between ramping method and step method?
The step method is the one we showed in the red star sample. So at each stage of the step method, the sample will reach the equilibrium and then jump to the next one. However, for the ramping method, we don't wait until its equilibrium. It's a very quick and easier way to study the stability of this kind of solid sample.
Okay.
This is basically similar to DSC and tga, but instead of ramping the temperature, we ramp the humidity.
Sure.
Tera, if you have a question, you can unmute yourself, that's fine.
Okay, thank you. Okay. With regards to that graph, you are using freeze dried coffee and I'm not sure if I heard you correctly. There is the liquid there.
Yeah, between 90 to 75%. RH.
Can you expand the slide a little bit?
Yes.
Yeah. You say between 75 and 90%. Thank you. You see the liquescence of the coffee. So does it mean this the composition of the coffee has some sugars in there?
No, not necessarily. It just means that, you know, even after 90% it probably needs longer equilibrium time. And it just highlights the fact that even after 90% still the coffee granules picking up moisture. And then go through the equations.
Yeah, but the equations is due to their composition, right?
That's right. Yes. Due to their composition. Yeah. In this case there is no added sugar to stabilize the material. But this is something can investigate yet. Maybe different sugars will. Will stabilize the material.
Okay. And then I. I mean the pictures are very nice. In terms of the video images in situ, do you see any kind of a growing of these granules? Granule coffee due to the kind of liquid bridges forming before it becomes.
That's a very interesting question actually. Thank you. We do have provisions to measure the size of the crystals or samples. But in this occasion this was done on an older system where we didn't have the upgraded software and unfortunately we haven't done that. But the new system. Yes, the analysis software would allow you to calibrate the grid lines and apply the grid line and measure the size of the sample or granules.
Okay, thank you.
Okay, thank you. Another question. Is the technique recognized by international regulatory organizations?
Yes, I have a slide here as well. So US has already recognized a standard for different regulation bodies including US and European copia. And it will soon become standard in Japan and China as well. And we also have the CFR version of the software to track any changes during the operation followed by the regulation from FDA for this.
Okay, thank you Meshen. Okay, there's a question. It's not related to food powders but is SMS conducting on surface analysis, IGC or DVC of additive manufacturing powders? We don't have that yet on our future webinars about additive manufacturing powders. However, we will do have some more webinars regarding IGC and DBS as well. You can visit our website for the upcoming webinars. We will soon release topics this week.
Thanks Sen. I believe you guys are organizing a seminar or actually symposium, right?
Okay. Yeah, yeah, the symposium.
Yeah, I think that there will be some applications on surface analysis and DBs on what the person was asking about the food sciences, but I'm not sure about additive manufacturing but about food powders. Yes, for sure. For additive manufacturing? That's a very good question. I don't know.
We don't have yet, I think, data for additive manufacturing, but Majid can answer that for us. But in terms of food powders. Yeah. We do have some precedent for that. Yeah.
Can I just add that we have done for our customers flavors and especially for food materials. So that's something both TVS and igc.
Okay. I think there are no more questions. If you happen to have questions later on, you can email us@scienceurfacemeasurementsystems.com Mingshan, thank you very much for your presentation. It's very helpful, and I hope the participants find it also helpful. Thank you very much to all.
Thank you.
More from Prof.

Webinar: Advances in Measuring Gas and Vapor Permeation Through Membranes and Barrier Polymers

Webinar: Determining Solubility Parameters of Bacterial Cellouse Through Energy of Adsorption

Online Webinar: Recent Technological Advances in Adsorption Based Direct Air Capture

Online Webinar: Surface Area of Pharmaceutical Ingredients at Real World Conditions by IGC



Hybrid Workshop: Measuring Material Vapour Pressure Properties Using Advanced Sorption Technique

PCL Hybrid Workshop: Recent Advances in the Characterisation of Pharmaceutical Powders


Using Advanced Techniques to Test the Performance of Recycled Bathroom Tissue | A video summary
