Surface Characterization of Cellulose and Natural Fibers by iGC-SEA
Surface Measurement Systems explains how inverse gas chromatography measures surface energy and area of cellulose and natural fibers without damaging them. iGC works at room temperature, unlike cryogenic methods that can alter fragile organic structures. Different nanocellulose production methods show distinct surface energy profiles.
Questions this video answers
May 8, 2020
Dan (affiliated with Surface Measurement Systems / presenter in webinar)
Octane at 25 °C (ambient)
77 K (liquid nitrogen temperature, −196 °C)
120 °C for 24 hours
Chapters
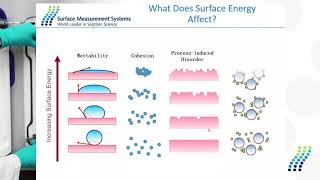
Well, good morning, good afternoon and good evening to everybody joining the webinar. Thank you for your time. Hopefully that everybody is seeing my screen and the presentation. Brad, please interrupt me if if that's not the case. So thanks for the introduction. Again today I'm going to be talking about cellulose based materials and how we can characterize them using inverse gas chromosomes, chromatography. So for some of those familiar with SMS technology, some of these slides in the beginning will be review. But I do like to set the stage of where SMS instruments play a role in your physical characterization toolbox and where it lies with other analytical and physical characterization techniques. So I often classify characterization, solid characterization techniques where you use either energy as a probe. This could be lights or X rays or lasers looking at light in light out, energy in energy out to look at structural and or analytical information like x ray diffraction, IR Raman optical microscopy, those type of techniques. You can also use heat as a probe looking at heat gain, heat loss, heat transfer. These are your calorimetric techniques like dsc, tga, tam, those type of things. And in general you're looking at thermodynamic information where surface measurement systems lies in this space of where we use molecules as a probe. So here we're looking at, in particular to SMS technology. We're going to look at how a vapor molecule might interact with a sample. That could be via adsorption, where it just interacts with the surface, or it could be via absorption where it dissolves or partially swells or interacts with the bulk of the sample. In particular, related to natural materials, these are often considered polymers. You will get both surface and bulk interaction with the various vapors. So we're looking at how these molecules may interact with the material. So we'll introduce them to the material and then see how they come out. Or they may not come out of the material, but we're looking at this adsorption, desorption phenomena. And we can vary the molecule, vary the temperature, vary the conditions, and vary the chemical nature and or size of these molecules that can determine different, both structural and or physicochemical properties of the material that we're looking at. In particular to today's presentation, we're going to use a technique called inverse gas chromatography. SMS has been involved in inverse gas chromatography for over 20 years. It's not a technique that we invented, but it's a technique that we have pioneered and championed over the last 20 years. It's based on the principle of a material it's typically in a column, it doesn't need to be. But we do a pulse injection of a particular vapor and we measure how long it takes that vapor to travel across the column of the material. And it's this retention time that we're measuring. This retention time is a function of the flow rate, the temperature, the concentration, the molecular species and the sample that we're investigating. And depending on how, what variable you adjust, we can learn things, both surface and bulk properties of the material under investigation. So these things can be things like surface energy, surface area, solubility parameters, diffusion coefficients, heat absorption and so on. So as I mentioned, inverse gas chromatography is not a technique that SMS invented. It's been around for quite some time. And just to give a sense of history and the trajectory of inverse gas chromatography, I have a histogram essentially of publications that reference inverse gas chromatography according to Google Scholar, going back to the mid-1970s. And you can see even as late as 2019 the trend is increasing. References to publications using invert gas chromatography. So currently there's between about 500 and 600 publications a year using inverse gas chromatography for a wide range of applications, materials and industry sectors. The most commonly measured property that we see and the bulk of the literature that you will find is looking at it to measure the surface energy. The surface energy of a solid is analogous to the surface tension of a liquid. Surface energy is often defined and used as gamma term. So like gamma L is the surface tension of a liquid. Gamma S is the surface energy of a solid and it's very often divided into a dispersive or non polar contribution, an acid base or polar contribution, depending on different literature resources. This is also called gamma LW for London, van der Waals Lifschitz interactions. This again is sometimes called gamma polar, but we typically use the more widely accepted is that the total is a combination of the dispersive component of the surface energy and the acid base component of the surface energy. Essentially to get these values, you have to use some nonpolar or dispersive molecules in inverse GC to get the dispersive component and you use some Lewis electron acceptor electron donor molecules to get the acid base contribution. I'm not going to go over that today. If you have specific questions, please message us. We can give you all the background and the theory and things like that. So why do people care about surface energy and what does it affect in terms of material properties? This is a slide I'VE shown in other presentations. But I do like to just review it just for those not familiar with surface energy and what it may or may not affect. So if I have a surface like this rectangle here, and if I increase the surface energy of that material, I will increase the wettability of that surface. So if I have a powder and all other properties are unchanged, and all I'm doing is increasing the surface energy of the particles, I will increase the cohesive forces, and it will increase the cohesion or reduce powder flow. It'll agglomerate, it'll stick. That's just due to the interfacial attraction of these particles. Very often in various steps of industrial processing, I may have some sort of milling or grinding or some sort of mechanical thermal stress to this to the surface. And very often this will open up defect sites, create amorphous material, create some sort of surface disorder in addition to making the surface rough, and it very often will increase the surface energy of the material, because these kink sites or other defect sites have fewest nearest neighbors. So therefore has an excess surface energy compared to a clean, ideal crystal surface. And finally, in a formulation type of application, if I have, let's say, two particles, a large particle and a small particle, just to show for illustration, and if I increase the surface energy of the larger particles, I can overcome the cohesive forces of the smaller particles, and then I can increase interfacial adhesion. This doesn't have to be particles. This could be fibers with a polymer matrix. It could be two surfaces. It could be any two surfaces. Although there are many factors that affect ultimate composite adhesion, the surface chemistry and surface energy is something that we can measure, monitor, track, and quantify how that can be. So we can also change the surface energy via surface modification. Some materials, you might have a low surface energy material, and by doing various, let's say chemical treatment or mechanical treatment, you can increase the surface energy to make it higher. On the flip side, I may have a high surface energy sample. And by passivating the surface, waxing or coating or silonizing, I can decrease the surface energy. So surface energy is not a. Whether it's high or low does not correlate to good or bad. It depends on the process, it depends on the sample, it depends on the formulation. So for some materials and some applications, let's say for powder flow, I may want a low surface energy. If I'm trying to coat a surface, I may want a high surface energy. So therefore it'll actually coat or wet a certain other material. So the idea is that by measuring and quantifying any of these surface energy changes, we can see how these changes in surface energy may affect formulation and or processing conditions throughout material lifecycle. So one thing that's unique to inverse gas chromatography is we have the ability to get not only a single value for surface energy, but a surface energy heterogeneity. Most real surfaces are energetically heterogeneous, which means they're not defined by a single value. Much like in a powder, a single particle size does not define every single particle. There's a distribution of particle sizes. Most real surfaces have a distribution of surface energy sites. So what the inverse gas chromatography technique allows us to do is to get a distribution of surface energy sites by covering various amounts of the monolayer. And this is all done if we know the surface area of the material, which I'll talk in more detail about later, and we know the molecular size of the probes, we can eject a discrete amount of vapor to cover X, Y, Z amount of the surface. And then that allows us to build up a heterogeneity profile for the surface energy of the material. And I'll show that with a Once I know the surface energy, then I can look at works of adhesion and works of cohesion. And that's defined by a thermodynamic work of adhesion, where I have between two dissimilar surfaces, or a work of cohesion, which is between two similar surfaces. So then I can compare will a material stick to itself or will it like to stick to another surface? If I know the surface energies of those two surfaces. So getting back to surface energy heterogeneity, this is a study that surface measurement systems done a while ago. And if you've seen any of our webinars or been to any of our on site seminars, you've probably seen the this slide before. But it is a very good example of how we can change only one variable of a material, namely the surface treatment or surface chemistry. And we can use inverse gas chromatography to see how those surfaces are different. So this slide is showing the surface energy, dispersive surface energy on the Y axis, the fractional coverage on the X axis. So this means we're covering more and more of the surface. So the surface energy values we get are dominated by high energy sites at low coverages, and then we get more of an average value at high coverages. And the material we're looking at is a mannitol crystalline powder. So the crystalline Mannitol as received is in red. It shows that it is energetically heterogeneous, which means it has a distribution of surface sites, and those are due to the different crystal planes. Each crystal plane will have a unique surface chemistry, and that is observed by this heterogeneity in the surface energy. And we can get a maximum and a minimum and an average surface energy by integrating this curve here. And we have a silanized mannitol, means the exact same material, same particle size, same particle shape, same surface area. Nothing else was done other than coating the material with. Basically, we're methylating the surface through a silinization process. We can take a powder that is energetically heterogeneous to energetically homogeneous, and we can passivate the surface and make it lower in surface energy. This is the dispersive component. And here is the specific or acid base component. And we see a similar trend. We go from an energetically heterogeneous surface to an energetically lower energy and homogeneous surface. So how can this actually affect some actual bulk property or behavior of the powder? So, as I mentioned in the few slides ago, is that we can use the surface energy to calculate a work of adhesion or a work of cohesion. So the work of cohesion is the likelihood of that particle to stick to itself. So if we look at the as received mannitol, it has a higher surface energy. So therefore we'll have a higher work of cohesion. And compared to that to the cyanized mannitol, which was lower surface energy, lower work of cohesion. So therefore, from a thermodynamic standpoint, the as received mannitol will be more likely to stick or agglomerate or reduce powder flow, whereas the blue or cyanized mannitol will flow better. And one way to get an actual measure on flow properties is by using a Freeman FT4 powder rheometer. And this is an impeller that is turned through a bed of that powder and it's being aerosolized by an air stream from below. And if we look at the energy required to turn this impeller through a bed of the as received mannitol, we can see from here the as received would be predicted to not flow as well. And we see that here is that it requires more force to turn this impeller because it's inhibiting powder flow compared to the cyanized mannitol. On the X axis is the air velocity that is used to aerosolize this bed. If you go to high enough air velocities, you can overcome those cohesive forces and the surfaces will look similar. So it's number one showing surface chemistry does have a large effect on adhesion and cohesion. Secondary, there are other factors that can go into play. And if we put enough air into the bed, we can overcome those thermodynamic surface interfacial forces. And now the powders can flow if we add some other energy in to overcome the cohesive surface energy. That's just one simple application. And in the short webinar, that's all I was going to go over. I wanted to give a couple other examples of how this could be applied to some cellulosic natural materials. And this is a study that was done in particular by NIST. This was published back in 2014, where we wanted to look at the source of various nanocelluloses. Those familiar with nanocellulose know that you can create nanocellulose through a range of processes. So this is looking at basically a chemical way, a mechanical way, and basically through enzymes or bacteria. So a range of cellulose sources were used, how they were defined. And then this was a larger paper where multiple techniques were used to characterize these nanocelluloses. Inverse gas chromatography was one of them. And it's a little bit busy slide. But the bottom line is you can see from these various types of nanocellulose, they have unique dispersive and acid base surface energy profiles. So although these are quote, unquote nanocellulose, the surface properties of these nanocellulose are vastly different depending on how we create them. Just to show the importance and the growing trend in nanocellulose is that this paper was published in 2014, and as of today, there is 272 citations of this paper. So this was only part of a larger study where there was a much larger characterization of these nanocelluloses. And if you want to, here's the reference for this paper. Another example of looking at different cellulosic materials and how surface energy is one way we can characterize those. This was a study not done by us, but done by Dr. Doug Gardner at the University of Maine. And again, it's a larger study, and I just wanted to show some examples here is that this is the dispersive component of the surface energy of various cellulose materials at different temperatures. So we can see some certain trends that as you go up in temperature, you see a decrease in the surface energy. And you can also see that these different sources or treatments of cellulose can vastly affect the surface energy of these materials. So there was a correlation between hydroxyl number and dispersive surface energy. The higher the hydroxyl number, the higher dispersive surface energy. Also, the surface energy, as I mentioned, decreased with increasing temperature and that was related to agglomeration of particles. So I'm going to. I'm already taking a little bit more time than I thought, so I'm going to quickly move on to surface energy. Is one thing we can measure by inverse gas chromatography. Another commonly measured property is surface area. That can be challenging for natural materials with traditional techniques. So traditional techniques use nitrogen at 77 kelvin to measure the nitrogen absorption and then subsequent surface area of these materials. However, you can use any molecule as long as it forms the right isotherm and you know the cross sectional area of that molecule. So for instance, you can use octane, butane, water even. It's not typically recommended for natural materials. But krypton, argon, anything that will form the right shape isotherm, you can measure a bet surface area. The most widely used molecule is nitrogen. However, when you get below 1 meter squared per gram, the reproducibility becomes challenging and it's recommended to go to krypton. But krypton is extremely expensive and not a lot of people like to use it due to the exorbitant costs of krypton compared to nitrogen. So there's also the requirement to go to vacuum conditions and liquid nitrogen temperatures for to measure the surface area by nitrogen techniques. For natural materials, this can cause a problem. They might have different amounts of water content. When I rapidly dry them under vacuum and nitrogen liquid nitrogen conditions, I can change the structure of these materials. They might collapse, they might go through a phase change, they might change the material. For instance, this is a paper from Advanced Powder Technology a few years ago. The bottom line is that the surface areas were not able to measure them with nitrogen, so krypton could be employed. But they still had a problem of going to very low temperatures. So inverse gas chromatography was used at ambient temperature to risk altering the crystal form. And to highlight that, I'm going to show a quick study that was done with surface measurement systems and the Imperial College of London and the University of Vienna using various techniques to measure the surface area of cellulose materials. So a volumetric nitrogen absorption, inverse gas chromatography and dynamic vapor absorption. All three of these methods were used. These are the experimental conditions. Obviously nitrogen was done at liquid nitrogen temperatures. DBS and IGC were done at 25 degrees C using octane as the molecule. To measure the isotherms, various cellulose based materials were used. I'll show data on one of them. This is part of a larger study that I won't go through today. But again I do want to reference Imperial College London and University of Vienna for their help with its work and Dr. Annette Condor from Surface Measurement Systems for doing the bulk of the work for SMS side of things. So one of the challenges in a nitrogen system is getting fluffy cellulosic powders into a bet tube. And you had to use about 15 milligrams of sample. In inverse gas chromatography and or DVS, it was a lot easier in DBS. If anyone knows our DBS products, we just put about 3 milligrams of sample into a sample pan. In inverse gas chromatography, very easy to place a few milligrams in a tube. Unlike the volumetric technique, you don't have to get it all the way down to the bottom of the tube, you can just place it within a few centimeters and it's quite easy to get it into the inverse gas chromatography. So we measured the isotherms using octane. These are the right shape, they're a type 2 isotherm. We go out far enough into the relative partial pressure range and you can see that they are quite reproducible. This is IGC isotherms on the nanocellulose or the freeze dried cellulose. This is the nitrogen absorptions by the BET instrument. And here are the DBS isotherms measured using octane. Again very reproducible. Although the isotherms are reproducible, we can see that the resulting VET surface areas are quite different. So by inverse gas chromatography in DVs we can see that the surface areas at 25 degrees C were around 65, 68 meters squared per gram. However, you can see here for the nitrogen absorption, the surface areas are much lower and they change if they've been run multiple times. So the first time they were run around 31 meters squared per gram. That goes down to around 20 meters squared per gram. Whereas subsequent measurements are all relatively constant by the atmospheric based techniques. So we looked a little bit further at this and we just looked at running the same sample after several different outgassing runs. And you can see that for inverse gas chromatography, very consistent. Whereas the nitrogen data we saw, every time you ran the sample the values changed and so there could be a couple Reasons for this we can see here with inverse gas chromatography, even if we vary the flow rate, vary the conditions, we get the same results within about 1 meter squared per gram. The advantages of the inverse gas chromatography is that we can degas it in situ. Good reproducibility, quick experiment. The volumetric technique for these type of materials, the biggest issue is the low temperatures and vacuum conditions can alter the structure and the state of the material, which clearly shows a difference in surface area compared to atmospheric based techniques like inverse GC and or dbs. One other thing, and I will wrap up here and I apologize, I'm going a little long is that not only can we measure these at atmospheric temperature, we can measure surface area values as a function of relative humidity. So we can see at real world conditions how does that affect the surface area area of these materials. This is showing data at 0,50 and 90% RH. This is showing on an avicel, a microcrystalline cellulose. The surface area, it's around 1 meter squared per gram. We get to about 65% relative humidity and we see a dramatic decrease in the surface area. Most likely water could be causing a phase change. And now I see a structural change in the material as I go to higher humidities. So as I wrap up this short webinar hopefully highlighted some applications looking at both surface energy and surface area for inverse gas chromatography and cellulosic based materials. I want to thank the colleagues at SMS at nist, Imperial College and also University of Vienna and ICL and for your time and attention. And I'll leave my slide on here to look at our upcoming webinars. And I'll pause and Brad or if there's anybody else that could direct me to any questions or anything else I can help at this moment.
Okay, during this time we're going to take a brief moment to answer any questions that you may have. So you may unmute yourself and ask the question or feel free to type your question in the chat bar and I will be sure to get that question answered. So if there's any questions, feel free to ask us. Hi Dan, can you share the title of the paper from Imperial College Measuring the surface area of Nanocellulose?
This was a presentation that was done at the American Chemical Society last year, in 2019. I'm not sure, I think it's in press. I will find out if we have a, if we have the final paper for that. I believe it's in press right now or in publication. So it might not be released as of yet, but I don't have it at the moment. Sorry about that.
They said thank you.
Yep. We can share the. Sorry, we can share the full presentation that was done at the ACS American Chemical Society meeting last year. If you message us on that, we can share that with you.
How do you differentiate between surface and bulk interactions of vapor and materials in igc?
That's a good question. And that's one of the reasons why we did this particular study here, is that in inverse gas chromatography you typically assume that you're at fast equilibrium and you're looking at surface properties. And one of the ways we can confirm that is by varying the flow rate. If we get the same answers, the same retention time, the same retention behavior under varying flow rates, then we know we're dominated by surface interactions. If we want to study bulk interactions, we would go to a temperature range, a concentration range and a flow regime where we're going to encourage bulk or dissolution behavior. Overall, inverse gas chromatography is mostly used for surface properties, but you can do experiments where you vary the flow rate and look at diffusion properties into the bulk. And then we get outside of this linear range and we go. It's called a Van Deemter analysis where we can go to lower flow rates and higher concentrations to be in the bulk range for investigation.
How do you go ahead? How do you explain the difference in surface area measured by BET and igc?
Sure. What we believe is happening is that the conditions that were used in the nitrogen data, so for instance, the cryogenic temperatures and the vacuum conditions are changing the structure of the material. So this is not only this phenomena. It is known that if I drastically dry out, some materials cause water to leave very quickly, I can crash the structure of the material. So what we believe is that by going to these extreme conditions, extreme for these materials, if it was quartz or if it was a rock, that's not going to matter. But for fragile organic materials like a freeze dried cellulose or a nanocellulose or some pharmaceutical materials, a shock to the material collapses the structure. And that's why you see a decrease in surface area. And that is known for other materials as well.
Would we expect a similar difference for micronized materials?
If they are by micronized, it shouldn't matter. I mean, it depends if it's highly crystalline, we may not see this behavior if there's a lot of void spaces. And it all depends on the material. If that thermal and or pressure Shock is going to cause some sort of structural change. The micronizing is looking at smaller particles. You would typically, as these particles get smaller, you see an increase in surface area for sure. But this phenomenon is more structurally related, not just material related.
Thank you. Someone had a question of humid sample doesn't affect the system as the system is in gas phase.
Yes. So what we do is when we introduce humidity to the instrument, we've actually humidified the carrier gas. So you can use nitrogen and or helium as a carrier gas. So the carrier gas is fully humidified to 10%, 80%, 50% relative humidity. We allow it to reach equilibrium with the sample. We flow it over there for a period of time, so humidity remains constant. And we use an FID detector which does not detect water, so it's not affecting the signal at all. And then we can inject the other molecules on top of that humid carrier gas and then measure the retention behavior with or without moisture present. So it does not affect the functionality or the mechanism of how the instrument works. It only will affect if humidity is changing the sample. Will it affect? The end result is because not due to just the system, but due to moisture is actually causing a change in the sample.
Due to the dispersive and acid base surface energies determined by IGC match the values determined by the contact angle measurements on flat surfaces. It seems that dispersive energies that you showed for a nanocellulus seem very high and relative to acid base energy. Yet this material seems to have a significant level of oh, which I would have thought would contribute to high acid base energy.
Very good question. And the answer is it's related to. So, yes, on flat surfaces, it's related to the energetic heterogeneity. So a contact angle puts a drop out of liquid and measures an average surface energy. So if I was to compare inverse gas chromatography data directly to contact angle data, I'd have to compare the values at high surface coverages, in particular to this study here. This was done on powders, not we. The particle engineering group at London Imperial College grew macroscopic crystals that were 2, 3 inches in dimension and measured contact angle on the individual crystal planes. And those contact angle values matched directly with the inverse gas chromatography values on the powders. So I will get good agreement. But I do have to go out to high coverages. And that's part of the advantage of inverse gas chromatography is that real materials are energetically heterogeneous. And I can actually measure and quantify that heterogeneity Whereas by contact angle I'll get an average value. But I would have to compare the values by inverse GC at what we call finite dilution or high concentration at infinite dilution. Yes, you're 100% right. You will typically get higher values than contact angle.
How do surface area results compare between DBs and IGC with Octane?
We can go down to here and we can see. Like I said, I just highlighted some things. But if we look right here. Sorry, let me just go through a few slides right here. So this green is IGC with octane. This blue is DBS with octane. And you can see we get exactly the same results. So within the error margins or the measurement conditions we get the same answers by DBS and IGC using octane for both techniques.
Then I think this is a response to a previous question. Yes, using N2 absorption we must degas materials, but I do not think changes the structure rather evaporations of some absorbed gases on the surface or ad.
Rob? Well, just to be clear, for all of these techniques we do have to outgass the sample. And if we go back to here just to for this study, all three, I think it's here, all three techniques, we outgassed them at 120 degrees C for 24 hours to remove the surface sorbates. The only difference is that so we heated up to 120 for DBS and IGC we measured them at 25 degrees C for nitrogen absorption you measure them at 77 Kelvin or minus 196 degrees C. So I agree all samples will outgas. However, it is known that cryogenic temperatures and vacuum conditions can cause some fragile materials to change structure. Not for what I would say rigid inorganic materials like maybe a zeolite or an activated carbon or other things like that. But it can happen for some fragile organic materials. And that's what this is highlighting is that this is one of those applications.
What type of analysis is better for hydrated materials, IGC or dbs? Where can I find more info about these techniques? Thanks.
Well, obviously you can find some information on our website and we'd be happy to help you out if there's something specific. But there's not a one size fits all for hydrated materials or for hydrophilic materials. Inverse GC is typically more sensitive to subtle surface chemistry changes. So if I'm looking at maybe a small amount of impurity. If I'm looking at if I micronize or mill or do something to the surface, am I going to have A more subtle change. And the reason for that is an inverse GC typically works at low concentrations and infinite dilution. I can very often look at very subtle differences, Whereas DBS is more of a bulk technique. I'm looking at the entire material through the vapor absorption. So if I want to look at very subtle surface chemistry changes, inverse GC might be better. If I want to characterize the overall hydrophilicity or structure of the material, DBS is considered what I would say is a bulk technique where IGC is more surface sensitive. So there's not a one size fits all, but both are complementary.
Is it advantageous to study surface area at different humidities?
It depends on the material. It's not something that's typically done. It depends on if your material is going to be processed at different humidities or if the material goes through a phase change. If it's a rigid inorganic material, you probably wouldn't gain much from it because you're just. The moisture isn't going to change the material. If my material is moisture sensitive, is amorphous water acts as a strong plasticizer, then it could have some value.
Can we measure the surface area of highly porous materials like activated carbons at greater than 2000 m2 g?
Not by inverse gas chromatography. That is a limitation. So inverse gas chromatography, because of the nature, or at least most people, in a pulse technique, it is hard to measure very high surface areas. For those materials, I'd recommend something like dynamic vapor absorption, which can easily do very high surface area materials like activated carbons, like MOFs or zeolites or things like that. In a pulse mode, typically we focus below 100 meters squared, maybe 200 meters squared per gram in IGC. So it does have limitations. In the data that I showed here, the way we ran the experiments, It'd be difficult to measure surface areas above 200 meters squared per gram.
Octane is a relatively large molecule. I guess it's good for me, the porous materials. You try to test other compounds.
Yeah, we have done other compounds. And you're right. If I go here, I believe if we look, here is the. So nitrogen is around 16.2 squared angstroms. Octane is about four times the size of that. You could use water. I wouldn't recommend water for an organic material. But for inorganic materials, you certainly could use water. It's even smaller than nitrogen. So. But you are right. We only can get access to the surface that we can. But even for a microporous material, octane would get into a microporous, which is below 20 angstroms. But it could be occluded to some things, although we could use that to our advantage. We could look at size selectivity and we could use molecules with different cross sectional areas to look at size selectivity of microporous materials.
All right, there's two more questions and then we're going to wrap up.
Okay.
Is it possible to use a polar probe, molecules like acetic acid?
Yeah, absolutely. I mean, ethyl acetate, acetic acid. I don't know if we would directly use acetic acid. It depends what we would say is polar. But you can use, if you're talking about surface area, you can use any molecule as long as it forms what's called a type 2 isotherm or a type 4 isotherm, where it forms a monolayer and then grows layer by layer for surface energy, you can use any molecule you want. If I want to look at the acid base contributions to surface energy for surface area, the criteria is it has to form a type 2 or type 4 isotherm. So that's material dependent.
Okay, and final question. Can you please say where Annex A is from?
Oh, sorry, that was from the larger study. Yes, that's where this is here. And it is just, it's actually taken from the, there's a certified reference materials and there's been a cross, cross multilab, multifunctionality, multi instrument study by the European Commission where this was taken from. So it's taken from. If I look at, if I was to look up a bcr, there's some surface area studies that were done on multiple samples, on multiple labs with multiple techniques to determine that that's where this, this table is taken from.
Okay, well, I want to thank everyone for joining this webinar today. We hope you found this webinar very informative and very helpful. If you have any further questions, please feel free to visit the website at www.Surfacemeasurementsystems.com or feel free to email us at scienceurfacemeasurementsystems.Com and we'll answer all your questions. If you have any questions in the future, again, that, that wraps everything up. And thank you, Dan, for the presentation and for the webinar today. And it was very informative and we hope everyone has a great rest of your day. All right.
All right, thank you. Stay safe. All right, bye. Bye.
More from Prof.

Webinar: Advances in Measuring Gas and Vapor Permeation Through Membranes and Barrier Polymers

Webinar: Determining Solubility Parameters of Bacterial Cellouse Through Energy of Adsorption

Online Webinar: Recent Technological Advances in Adsorption Based Direct Air Capture

Online Webinar: Surface Area of Pharmaceutical Ingredients at Real World Conditions by IGC



Hybrid Workshop: Measuring Material Vapour Pressure Properties Using Advanced Sorption Technique

PCL Hybrid Workshop: Recent Advances in the Characterisation of Pharmaceutical Powders


Using Advanced Techniques to Test the Performance of Recycled Bathroom Tissue | A video summary
