The Isosteric Heat of Adsorption and Competitive Co adsorption of H2O with CO2 on Zeolites
Webinar by Vlad (Prof. Sorption) presenting methods to measure adsorption on zeolites using a dynamic vacuum gravimetric vapor sorption (DVS/Vacuum) system. Covers zeolite basics, instrument operation (dynamic flow and static modes), sample outgassing, kinetics and isotherm measurement, and calculation of isosteric heat of adsorption via Clausius–Clapeyron/Leipin approach using isotherms at multiple temperatures. Case studies include zeolite X, Y and a composite (water sorption at 25/50/70°C) and competitive CO2/H2O adsorption on 13X with modelling by dual-site Langmuir and IAST. Presentation ends with live Q&A containing instrument specs and procedural clarifications.
Chapters
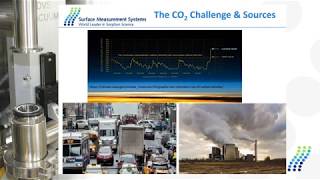
Okay, so good afternoon, Good morning everyone. Thank you very much Brad for kind introduction. And I also would like to thank you to all our participants around the globe that are listening in today my presentation about the heat absorption and competitive adsorption on zeolites. So without further ado, so I'm going to go through briefly overview of my presentation. So basically I'm going to do short introduction to zeolites. I am pretty sure most of you very familiar with these materials and knows quite a lot about it. Then I'm going to focus on the techniques. I'm going to talk about gravimetric analyzer. So I'm going to talk about anything about the XRD X rays. Then I'm going to show how these DVS data can be used to determine the differential enthalpies of adsorption or isosteric hydro absorption. And lastly I'm going to discuss the coadsorption measurements on zeolites using water and CO2 as pro molecules. So zeolites are well known materials. So we have the synthesized natural zeolites. So as you know they are crystalline helipoils, aluminosilicates, biodob, aluminium and silicon tetrahedra in blocks. So it's a three dimensional pore system. As we can see these systems got very well defined pore diameter. One of the biggest advantage of this that this pore diameter can be tuned to different applications. So as you know the structure of the Zolag is negatively charged. So for this we need to actually in order to maintain a neutral net framework. So we're going to have to introduce some monodil and cations actually influence the pore diameter of these materials. And this reason I mentioned this because very important for separation processes we can separate large molecule from the small molecule because if the molecule is big enough, small enough, it will go into the pores. If it's large enough it will be actually excluded from the adsorption process. The reason zeolites are still much of interest to us is because they are very stable in harsh environment and humid environments and they are cheap to make. There is several applications of zeolites like industrial scale is mainly drying and purifying of gases. The separation processes as I mentioned, one of the promising is removed carbon dioxide or other toxic gases, pollution control and heat adsorption pumps or heat seasonal heat storage. So all these processes got one thing in common and this is the adsorption or adsorption process. So when talking about adsorption process we discuss both adsorption and desorption so in a typical absorption process have the flux of the molecules, either water or gas, they come into a contact with a solid material. Let's say the zeolites they either get weakly bound to the surface using van de mass forces or some of the material molecules can get absorbed. So they penetrate bulk of the material and the rest of the molecule coming out. So during this first process we observing the absorption stage and when the molecules coming out the adsorption stage. Now, in order to actually quantify the amount of the molecules absorbed and dissolved or the interaction of these molecules with the solids, we need to actually measure these properties. For this we are introducing dynamic gravimetric vapors optionalizer, we call it vacuum. So this system is actually capable to measure the absorption processes in dynamic mode under subatmospheric conditions. So what it does so is a gravimetric. So it means it's got a balance. So we continuously measure the amount of molecules, the weight gain and weight loss at different partial pressures or absolute pressures of gas. In order to determine accurately sorption behavior of the materials. During these measurements we also obtained the in situ drinkers. This is very important for instance for pharmaceutical industry. When we can look at the drying condition with the slip of nitrogen different pressures. So we can model how it's going to behave in driest. We can determine adsorption disorption like kinetics. So basically we see how fast molecules goes into the poros materials and how fast we reach the mass equilibriums. Then from the slope of the data we can determine the kinetics diffusion coefficients using Fick's law. Then from kinetics data we observe, we can obtain the isotherms. So the isotherm is done at isothermal conditions. It means temperature is constant. And we write the pressure from isotherms data. We're going to derive the heat of adsorption, enthalpy of adsorption. So if you measure two different temperatures, then if you have a right shape of isothermal, say type 2 and 4, we can calculate barrier surface area. And lastly we also capable the system is also capable of measuring the adsorption isobars which is little bit this is under isobaric condition, basically pressure constant regarding the temperature. Now I just want to show you the insights because it's quite important for co adsorption measurement. So it is the isotherms measurements are performed under isothermal condition. Well, it means all this is housed inside a temperature enclosure including the mass laws, baratrons and the ultra balls. So and sample itself, which is on the left hand side. Here. So what it is important the temperature is constant to other measurement. Now if you want to do co adsorption measurements. So you need to have two mask load controllers to deliver vapor. In this case is water and at the back is DC of 2. So this is very important. So we can have the two components at the same time or we can have a two gases or two vapors. So this is going to be positive measures. So this system can deliver two gases or two vapors at the same time. Now the other thing is, what is important is that around here we have another preheater which can measure the outgasser sample at high temperature. So this is the adjust to setting this in for the co adoption measurements that are going to be done in the static or dynamic mode. Now if you look at the scheme of the system as I mentioned on left hand side we have the typical absorption process as it carried out. All right, inside is the scheme. I'm just going to go to briefly. So here's the inlet. So here's your upstream, this is your downstream. This between is the vacuum chamber under dome. Here we have the ultra bounds. So in a typical experiment we dry the sample. So basically you load the sample here, you apply high vacuum, high temperature to outgass the material. So you close the upstream and you open downstream. So you pull high vacuum. Once the sample is dried pool to the sorption temperature, we close the downstream. So this is a butterfly valve here which is sitting between these two transducers. That's the exit side of the chamber and we open the upstream. So in typical experiment let's say about 25C. So we want to go 10% pop knot which corresponds to 2.38 or absolute pressure. Because valve closes we set a flow rate to 20 SCCM. The water pressure raises up to set pressure. Once the pressure goes above the set point then the butterfly valve get the feedback from the baritones, the pressure went over and as a result of this the valves open and reduce the amount of water molecule inside the chamber. And these valves will be opening and closing. So controlling the flux of the molecule inside the chamber till steady state is open. So in steady state we're going to have the constant flux of gas or water vapor molecule which is maintained by this valve while we continuously measure the changes in the changes in the mass. So this is a typical dynamic sorption experiment. Now we can also apply the static mode. And the benefit is that this valve will be continued always closed. And then we're going to just injecting the pressure Injecting the molecules using one of these muscle controllers or both at the same time. So this is a typical scheme, pretty basic operation principle of the vacuum. Now as I mentioned, so we had the two operation modes, dynamic vacuum mode. So we are able to flow the gases under vacuum. So we measure pressure, low pressures. And we're waiting for, for mass equilibrium. But we go the benefits of this mode is that we can go to very low relative pressure. So if you want to do water sorption for instance at 0.04% RH at 25, we can do it. And I will demonstrate some data. So we can measure the extremely low pressure which is difficult to obtain in normal flow systems. And also it's got, we can do the module. The other mode is static, which is again will be used demonstrate later for co adsorption. Then we can do it co adsorption static mode. And we will show how this can play in a role. So in this case we're going to use just injected molecules now. So let's move to the typical data. So as I mentioned, so here we look at the typical drying curve for the material for mold. So what you see here, solid red line is the mass of the sample. So initially this sample dried at high vacuum only. Then when we reach sort of the plateau, we apply the heat. So we increase the temperature of this radiator style of preheater up to 150 degrees using heating 5 degrees emitter heating rate. And then we observe further mass loss. So this is the completely outglassing of the material. And outglassing is play a key role for many porous materials because depending on outgassing conditions we will also see the effects on the adsorption capacities later. And I also want to show this is the metal part which is used during the measurements where you can unload your beads, pellets or powders or measurements. Now this typical data again. So here's the kinetics, what I described earlier. So in red we have the solid red line which is mass. In blue is the relative pressure P0. So what we observe here, so if you want to demonstrate, we look at the composite material which was made of like honeycomb structure coated with zeolite. We look at the water's option at 50 degrees. So initially we have, we dried the material which is, which can be, which is obvious from these huge muscles. Then once the material is completely dry, we introduce a water vapor 0.02%. So what we see here is the target pressure, offset pressure and the actual measured pressure at 0.02% RH, we still get almost 4% uptake. So it's for if sometime is interested in the performance of material which is usually at very low concentrations. So this is the. This is type of the measurements can be carried out in our system. So what you see here. So we got also the kinetics here. So this is this red line here. From this we can calculate the set diffusion coefficients materials. Also, as you can see, each of these steps or the mass equilibriums are different duration. So this means that the materials. This is the way we perform the experiment is called in the mass equilibrium criteria. I want to point it out that from these equilibration points at each relative pressure step, we can calculate the isotherms which will demonstrate here. So what we see here is the absorption this option isotope or the composite at 50. So in red is the adsorption branch. In blue is the desorption branch and the gap between is hysteresis. So since it is the composite material, so we have the historic condensation on the this option. So now as I said the scene. So this is typical data this system generates. So we can move to main topic of this talk, which is is option or enthalpy of adsorption. So why we are interested in this. So overall it will influence the cost of the overall cost of the adsorption process. It also have the effect on the absorption equilibrium. So it might shift because the amount of the heat released. And also we need to understand the cost of disruption or regeneration of the process. So there are several methods to determine heat of adsorption. So one of the traditional methods is calorimetric where we just basically directly measure the heat release in the cell during adsorption equilibrium. So electrically electrical signal is a basically proportional model heat evolved. Now in this talk we're going to mainly focus on the thermodynamic measurements determination of heat of adsorption by measurements of the adsorption isotherm. So for this we will use the classic Leipin equation where constant coverage is maintained at equilibrium pressure and the temperature. So I'm going to also go briefly through equations how to actually derive the heat of adsorption. So if you look at the change of the Gibbs free energy, it is directly of adsorption process is related to the adsorption equilibrium adsorption constant using one of the equation. Now, the Gibbs free energy is also related to change in the heat of adsorption and heat of change in entropy at a constant temperature. Now if you combine these two equations together, we can express the Delta we can get express the adsorption constant in this following way. But from this expression we can determine the the heat of enthalpy of adsorption we're using from the slope or this linear plot ln key lnk over 1 ot which is actually equal to the entire adoption. Now here we look. Here we look at the adsorption constant. So in order to actually apply to all the data, so we have to substitute equation for K for Langmid equation which is down here. So it's a Langmid equation. And then if we express temperature in the form of delta t over t over delta t, we end up with the classic leaping equation which is actually used for calculation of isosteric heat of absorption from the slope of linear plot of LNP versus Van Ovot. Now, how this method applied to DBS data. So basically first we need to collect three isotherms at three different temperature in a small temperature range. From these isotherms we have to determine as shown here, number of pairs of pressure in temperature values at the same surface coverage. And then by applying classes klepton equation to the set of pressure and temperature values from the slope of this curve, we obtain the enthalpy of adsorption. Now so this was employed on the study for fajita type of zeolite which was prepared by Julia Kompe from Magdeburg University. So we're going to look at the two type of two flavor two types of zeolites, Fagota zeolite type X and type Y. So the difference is in the silicon aluminum ratio and the amount of the ion exchange using magnesium chloride solution. But we also have the composite zeolite which was prepared by using aluminum oxide in open cellular ceramic form. So these are the materials. So these three materials which are going to be used for the study and investigation of heat of adsorption. So first all these materials going has been outgassed under identical condition. That means initially a few hours at 80 degrees and then for several hours at 350 degrees under high vacuum. So it's very important that we don't expose these materials to high temperatures very fast because it might cause a shrinkage. After the outgassing we cool down the material to absorption temperature and then we perform the water absorption is measurements at 25, 50 and 70. What we're looking at here is actually basically the kinetics data as I discussed earlier. So in this slide we actually look at these 0 line x adsorption desorption isotherms at 25 is blue, red 50 pink and green and brown Antarctic mis at 70 degrees. So as you expect at higher temperature, as you go up in the temperature, the adsorption capacity goes down. Now the same from this data we calculated, we constructed the isosteres. So Basically we created line 1 OT as vanilla P and and these isostasis from the slope we will calculate the heat of adsorption. Again same measurements were done for Zolide Y. So you look at the kinetics data here. Again we get the sets of the isotherms very similar behavior, very similar trends. So at higher temperatures you get much lower optic. Now when you look at the again because of the isosteres for this type of the material. Now you look at the. We look at the composites and then in the context of the composites what we observe the kinetics are very similar throughout whole temperature range. And if you look at the isotherms, the adsorption capacity, they fall into the same adsorption amount, which is quite interesting. Again we got mineralized isotes for this material. Finally we got from this data to derive the easiest elegant upper absorption as a function of surface coverage. So what we see there is your light Y and X. So got very similar heat of adsorption. Whereas the composite could initially quite high. The adoption has low surface carriages and then at high surface carriages just dropping down. So this is the way to drive heat absorption from this material. Now we're going to move to the second part of the presentation which is all about the CO2. So I mean that you know, there's lots of level of CO2 is increasing in the atmosphere for past few years. There's lots of sources like the power plants in the automotive industry. So our aim is to actually mitigate or reduce the CO2 emissions. So there are several methods available on the market to do it. One of them is scrubbing the atomic ray capture using solid adsorbents or absorption based processes using porous absorbents such as mozzelite in the pressure and temperature source staining walls. So this is the one of the methods which is heavily investigated. So for this adsorption based process, if need solid adsorbents, it's very easy to obtain the adsorption capacity for let's say for pure CO2. But one of the challenges when you have the flue gas from power plant there is a moisture present. So this moisture present in the flue plants there's also it's very difficult to actually get good understanding what's the actual capacity of the CO2 in the presence of Water. So in order to investigate this kind of problem, so we employ again our DBS to study these measurements. So we're going to look at the dynamic competitive adsorption in the dynamic mode of two probe molecules. So as a case study I've looked at a 13x dynamic adsorption of CO2 in the presence of 5 and 10% of water vapor. Going to use the model. So ferron switch. Usually, in order to understand the behavior of the materials, it's very important to obtain the pure isotherm. So we look at the pure adsorption water adsorption isotherm of 13x at 25 degrees. So adsorption here is option blue. So nice. Table 1 isotemps again done the same measurements for 0,13x up to 1 bar. Again adsorption in blue. In red. Adsorption in blue. So type 1 isotams. Now, in order to fit the data. So the data was fitted. B is dual cell Langmuir model. So fits are shown below the table. So in the table we get all the Langmuir constant obtained from the fitting procedure. So as you can see, there's a good agreement between experimental and the simulated data. Now, because when we measure the coadsorption, when you prefer the coadsorption measurements in dynamic mode, that is we continuously flow vapors gases at the same time in different flow ratio is very difficult to quantify the amount of each other. So because you always will look at the total mass uptake. So in order to actually quantify it in this case. So what we have to do, we need to use the simulation to actually help us. For this we employ the ideal adsorption solution theory ic and we simulated the data from our crew data the adsorption, the amount of CO2 absorbed in the presence of 5% of water and 10%. As you would expect for CO13 exact material, the adsorption capacity of these zeolites for CO2 is very low. So the absorption is dominant by the water. But what we did also. So if we put added up this number which come up for the absorption values for water and CO2 plotted against the experimental data. So when you float a mixture of water and CO2 over. So we had a very good agreement. So in this case, if you look at the core adsorption measurements dynamic mode we have to employ the simulations to help us and to understand him and I saw. But you also know need to know make few predictions about the materials in order to understand variable structures. So structurally important properties are very important. Now the other Example is binary of CO adsorption is binary Competitive absorption of CO2 at constant loading of water vapor on zeolites. This way we will be able to quantify the amount of each molecule at all. Having said that, we assume we make several assumptions. We know that CO2 won't replace the say water. There will be no chemist option. So if you make these assumptions, we know the structure of materials very well. This is the simplest way to determine to actually to assess the performance of materials in the humid conditions. So once again what we've done. So initially we outgassed the material for several hours. Then in this case we introduce 1.845 volume percent of water vapor, wait for the mass equilibrium to be reached and once the mass equilibrium was reached, we introduced using the second MFC as you showed in the previous slide, the CO2 on top of it. So the CO2 was increasing small steps up to 300% concentration. And then from this data we can actually now calculate demand of CO2 absorbed at a constant loading of the beta vapor. So for this particular example, so if we have loading of 1.8451% of water vapor, the amount of the CO2 absorbed by the sample is about almost 12 of 8%. Okay, so this experiment now can be repeated for different loading of the water vapor. You can do for 2% 6% depending on your conditions. But this way it's very easy to assess how much of CO2 is absorbed by the sample. But as I said is only valid for certain types of material. Not every material is going to be able to provide such a like this. Now lastly, so I move to my last slides. Actually I would like to make some conclusions so I just wanted to help. I was able to demonstrate you the methods to determine the is the state of adsorption and also show you how to simply analyze some coadsorption data using this DV as vacuum system. And lastly I would like to acknowledge my collaborators, Alexandra Lieba, Julian Kombe from University of Magdeburg who were providing the zeolite type X type Y zeolites and Jorge and Ilic for the help with the simulation of ist. Now this is why thank you to you all for your listening in my presentation and if you have any questions, don't hesitate to send us your questions or ask now.
Thank you Vlad for that presentation. So we are going to open up the chat to any questions that anyone has. So you can either type your questions in the chat box or unmute yourself and feel free to talk. We do have a question. What are typical sample masses that are used for experiments.
Typical sample masses are about 30 milligrams. For zeolites, 20 to 30 milligrams. Okay.
What's the lowest achievable pressure for a system of tenders? 7 tor.
The lowest pressure is 5 millitol.
Constructing the isotherms requires interpolation of the isotherms. Do you use a linear interpolation or a spline one?
Can you repeat the question again?
Constructing the isotherms requires an interpolation of isotherms. Do you use a linear interpolation or a spline one?
Oh, in this case was linear interpolation. Okay.
Could you clarify your process for H2O or CO2 coadsorption? The first dose was H2O and then the subsequent dose was. Were all CO2.
Yes. So first dose was H2O. They waited for the mass equilibrium and then once the mass equilibrium was reached, so you got this particle here, then the CO2 was intelligent to copy.
What is the maximum temperature for outgassing of material of 400C?
Also the maximum temperature without gassing of materials is 400 degrees Celsius. Okay.
How sensitive is the method to initial mass of the sample?
So the sensitivity of the balance is in 1 microgram. Sorry, is this also mass? Basically. So the mass we select for the measurements all depends on the type of the isotope. So if you have typically type 1. So we use typically between 20 to 30 milligram of mass, which is good, Give us good, very good signal. But if you have, let's say type 4 isotams, or if you have extremely low absorption capacities, 1 below 1, 8%. So the mass used for the measurements will be much higher. It's going to go up to 100. Between 100250 milligrams.
What's the lowest absolute pressure for a vapor or gas absorption?
The lowest absolute vapor pressure is 5 millitol. In terms of water vapor. The lowest pressure is going to be in terms of pure RH. It's going to be at 25 0.03%. But it's easier to express it in terms of absolute pressure, which is 5 milliliters.
And what's the resolution of the balance?
The low mass balance. Got resolution? 0.1 microgram. Okay.
I believe we have answered all of the questions that everyone was asking.
Can I ask if Kristina.
Go ahead.
Okay. Hello, My name is Omid Nij and actually I'm from Suante. We are working on temperature swing adsorption for carbon capture and we have a dbs. The question I have is you mentioned you can we can inject CO2 and water together. Is it right? Can we inject CO2 and water together at different RH?
Yes. So I don't know which DVs. So in this DVs because we can inject independently water and CO2 as you saw in my earlier. So we have the two master controls. So do you have the flow system, DBS or which model you have?
We use very old system. Not the vacuum one that you have. We have very old one. But what we do, we are actually injecting the pure CO2 into the bubbler and then at different RH we can inject CO2 and water. But the problem is that when you for example, you want to inject a 60% RH, it takes time for the DVs to reach to 60% RH versus the CO2 is available to the adsorbent. Then that's always the problem. Meaning that the adsorbent it takes time for the machine to bring the water level to the set point versus the CO2 is always present. And we never ever can have a very nice data because always we lose the pulse. CO2 is that there's constant partial pressure versus water is not there.
Okay, so in this case we don't use bubbler. So in this case we generate the vapors by a little bit slow at thermodynamic air filling and absorption temperature. So we just take the headspace of the liquid directly into the system and then second one is connected to CO2. You can inject both water and CO2 at the same time if you want to. The mixture and the pressure change is very fast.
Okay, thank you.
What is the lowest vacuum pressure you can achieve at the start of an experiment?
We can go down with the sample 10/6 TOR.
Okay, I believe that concludes our webinar. Unless anyone has any other questions. Last call. We want to thank everyone for attending this webinar and we appreciate everyone for attending.
Hold on.
Is the sample recoverable after the experiment?
Yes, the sample is recoverable after the experiment and can be used for the other non destructive techniques like other diffraction.
Okay, well I want to thank everyone for attending. We appreciate you coming to the webinar. If you have any further questions you can visit the website at www.surfacemeasurementsystems.com.
Or.
Feel free to contact your local sales representative. Thank you again Vlad for the great presentation and I hope everyone has a safe and great day.
Take care.
More from Prof.

Webinar: Advances in Measuring Gas and Vapor Permeation Through Membranes and Barrier Polymers

Webinar: Determining Solubility Parameters of Bacterial Cellouse Through Energy of Adsorption

Online Webinar: Recent Technological Advances in Adsorption Based Direct Air Capture

Online Webinar: Surface Area of Pharmaceutical Ingredients at Real World Conditions by IGC



Hybrid Workshop: Measuring Material Vapour Pressure Properties Using Advanced Sorption Technique

PCL Hybrid Workshop: Recent Advances in the Characterisation of Pharmaceutical Powders


Using Advanced Techniques to Test the Performance of Recycled Bathroom Tissue | A video summary
