Webinar Advanced Characterization on Solid State Materials Prof Williams Imperial College - Part 2/3
Professor Darrell Williams demonstrates inverse gas chromatography to measure surface area and surface energy of pharmaceutical powders. The technique uses vapor-phase molecules passed through powder columns to yield BET surface area and dispersive and polar surface energy components. Case studies show how milling raises aspirin's surface energy and dissolution rate, and how surface energy predictions correlate with granule size in wet granulation.
Questions this video answers
About 50 to 100 mg (range mentioned: ~10 to 500 mg).
Approximately 1 m2/g.
Approximately 0.3 m2/g (from 250 mg sample).
Measurements compared at 0% and 70% relative humidity.
Up to ~20% surface coverage (probes mostly the most active sites).
Chapters
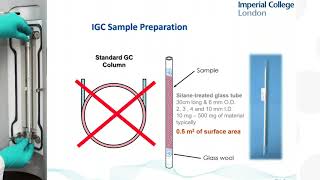
We will take question in regards to the presentation to all the presentation at the end of the session. So at this moment I would like to move forward with the next part of our workshop. And our next presenter is Professor Darrell Williams. He's a professor of Particle science in the Department of Chemical Engineering at Imperial College in London and he's also the managing director and founder of Surface Measurement System. Today he is going to talk about surface area and surface energy study on pharmaceutical powder. So Dr. William well, good afternoon and welcome to this afternoon's presentation which will nicely continue on with the discussion we heard this morning previously around characterization of APIs in this service area. We'll hear a little bit surface area and other measurements on pharmaceutical powders. During my presentation day I will be shifting techniques a little bit. A related technique to dynamic vapor absorption is inverse gas chromatography and I spend a little bit of time explaining that and I'll give you some examples of the sort of information sets that you can obtain by characterizing pharmaceutical powders using inverse gas chromatography. Our emphasis today will be on both surface area, which we heard a little bit about before, and also surface energy, which are two important powder attributes and not always attributes that are commonly measured. So the talk outline is as given here. I'll be talking about the IGC method. To start with, we'll have a brief introduction to surface area determinations, but most of the presentation will be about the surface energy and how that is an important property for understanding the performance and behavior of pharmaceutical solid state dosage forms. And that will be the major theme of the presentation will be around surface energy and materials. Just to start by giving a little bit introduction to inverse gas chromatography. It might seem like a new technique. It isn't a new technique. It has been around for a very long period of time and was originally invented for characterizing polymers and composites and also catalysts and adsorbents going back into 1950s, 1960s. But in recent years we've also discovered that it can be very effective for characterizing particular materials, including pharmaceutical solids. Today's examples are taken from work we've done over the last few years in characterizing pharmaceutical solid state materials. And just to sort of explain a little bit about the technique and why the technique is useful in common to the dynamic vapor absorption technique that I've just that you've heard earlier spoken about today, IGC is a technique where we're going to use molecules, gas molecules, but in reality vapor phase molecules to probe material properties. And it Turns out if we use gas phase molecules, such as water molecules or acetone or octane molecules, or ethanol molecules, they can provide us with chemical information around the material and information that sometimes can be quite difficult to obtain using other techniques such as spectroscopy. So we can measure thermodynamic nanophysiochemical properties of our solids by characterizing using these gas adsorption techniques. And as we'll also see, one of the benefits of these approaches is it's possible to actually look at both temperature and, well as humidity effects, as we saw very effectively earlier in today's workshop. So essentially we're going to use molecules to investigate materials, but rather than measure a change in sample mass, as you do gravimetrically with the DVs, we're going to measure it chromatographically. So let me explain a little bit about the chromatographic method that we'll be describing during today's presentation. So firstly, it would be useful for me just to remind you a little bit around analytical gas cartography compared to inverse gas chronotographers, which is a technique that we're introducing. So we have a little animation here which basically shows you the difference between analytical gas chromatography, which is shown in the up the drawing at the top, and inverse gas chromatography, which is a new technique we're going to describe today. So in analytical gas chromatography, we have a known column that we buy from manufacturer, and we typically use that to separate some unknown molecules. And from that we can determine what the molecules are, and also we can determine the concentration of them. And we do that by having a known process of those vapor phase molecules absorbing on our known column. Now, in the technique known as inverse gas chromatography, we're going to invert the rolls. So what we're going to do is prepare a column, we're going to pack it with our API or our formulation, and we're going to pass through that in the gas phase, some known molecules. It might be hexane, it might be octane, it might be ethanol, methanol. So we're going to inject known molecules through our unknown material, the solid we want to characterize, and that's the basis of the inverse gas chromatographic approach. We're going to now characterize our unknown powders using known molecules. And of course, analytical chromatography is a very accurate way of determining composition. And, and it turns out that the inverse technique is a very good way of determining the physical chemistry of our solid and properties as we'll see today, such as surface area and surface energy can be measured very accurately and very easily. So an inverse gas chromatographic measurement Is similar to a commercial gas chromatic wave. You have. Analytically. The difference is it's designed to do experiments in a slightly different fashion. Where you have the ability to inject a series of different vapor phase molecules. So it could be octane, hexane, ethanol, methanol, cyclohexane, chloroform, acetone. We can inject these molecules one at a time under very well controlled injection conditions. And what we're going to do is, of course, as I mentioned before, we're going to pack a column here. This is going to have your material in it. Maybe 50 to 100 milligrams of the powder, sometimes less. We're going to pass through that column some known molecules. And we're going to measure in our experiment. Because we've got a flame ionization detector at the end of the column, Just like we have in a normal analytical gc. We're going to measure how long it takes for pulses of organic molecules to pass through the column. And as they pass through the column, they will adsorb. They will attach themselves to the surface of my particles. And how much time they spend attached to the particles is a measure of the affinity of the particles for my known molecules. From these retention behaviors, I can determine the anisotherm for the material. From that, I can derive different physiochemical properties that describe the solid in my column. The technique has some similarities to analytical chromatography, except we're going to use our own material as the solid. Packing in a column. As I said, packing in a column is actually relatively easy. Typically these columns are glass columns. They're typically 2, 3 or 4 millimeters in ID. And between 50, 10 to 500 milligrams of material can be packed. And typically we'll have about about half a meter squared of surface area in the column. It's a straight column. It's not a capillary column like a normal analytical gc. It's a straight column. So it's actually quite easy to pack. And typically we can pack a column in under five minutes. And the packing of the column is very reproducible. And it is of no significance at all how well you do or don't pack the columns. They're very easy to reliably pack. Now, once we pack our material into our IGC column, we load it into the machine. There are many, many experiments we can do I'm not going to go through all of that. I'm going to focus on really two measurements. And what are the two most important measurements. I'm going to focus on the one at the top, which is surface area. The surface area is, in many cases, one of the most important properties of particular materials. It's not commonly measured. And as we'll see, the reason it's not commonly measured is because it isn't that easy to measure for powders. And we're also going to briefly talk about measuring the BET surface area. We heard earlier today how you can use dvs to measure surface area. And we're also here in today's presentation how you can use IGC to do a similar type of determination. So let me talk a bit about surface areas. And one of the most basic properties people would expect to have for any particular material, including pharmaceuticals, is to have the surface area. And I think it's a sad statement of facts that in many particular material systems, we often have very little information around the material. We might get a particle size distribution. If we're lucky, we might get a PET surface area, possibly. But after that, we tend to have very little information. And one of the problems we have often when it comes to dealing with manufacturing problems, batch, batch variabilities in materials is often we don't have the. The right types of particle information to understand what the problems are. So we might have lots of bulk information in terms of infrared spectroscopy and maybe SEM, but often that information isn't of sufficient value to help us understand some of the occasions where particles don't behave the way we hope. But a basic property is surface area. And let's talk about that. There are a number of techniques available for measuring surface area, but they're all based on adsorption of molecules. And the most common technique in broad use these days is nitrogen absorption. So nitrogen absorption has been around as a technique now for probably about 50 years. And for porous materials or materials with high surface areas above 10 meters squared per gram, for example, it's a common technique and extensively used. But in the world of pharmaceuticals and actually in the world of foods and personal care, often materials aren't above 10 meters squared per gram. Indeed, often they're much lower. Materials down to 0.1 meters square per gram are very, very common in the world of pharmaceuticals. And if you take a material that's 0.1 meters squared per gram and you try to do a nitrogen adsorption, you will find it virtually impossible to do. Once you get to less than 1 meter squared per gram. The experiments become difficult. And not only are they difficult with those amounts of material, with those types of materials, you also, as we saw before, need one or two grams of sample, and you may not have that. So what we've discovered in recent years that the IGC method is a very good way of measuring surface areas. It has the benefit, as we'll see in a moment, as I can go down to a low surface area, less than 0.1 meters squared per gram. And also I can do materials at ambient temperature. I don't require 77 kelvin. And also I can use organic vapors to determine my surface area. Those organic vapors, such as octane or cyclohexane, have properties that are surface areas that are more representative for the real problems I'm trying to understand. And also I do the experiments under ambient pressure rather than vacuum. So it's much closer to the real world. So we're going to have just a couple of slides where we describe these sorts of measurements. So there are international standards for doing bet, which some of you may have come across. And in fact, the international standards just don't talk about nitrogen, although that is the most common gas. You can use argon, krypton, but actually you can also use octane and heptane and benzene. These are all molecules that are accepted by the ISO standards for measuring BET surface areas. I don't feel that because you're not doing nitrogen method, that it's outside the standards. The standards do cover molecules besides nitrogen for doing surface area determinations. So in a little study I'm showing you here at the moment, we used a bet standard reference material. It's CRM170. It's actually an aluminium oxide. It's a standard calibration material you use if you're calibrating your nitrogen analyzer to do low surface areas has a surface area of about 1 meter squared per gram. And what we've done here is a study by doing octane adsorption at 25 Celsius, 30 Celsius, you'd say onto the material, having preconditioned it, which is basically shorthand for drying it for six hours at 100 degrees. So we do the octane isotherm. You can see the octane isotherm is over here on the left, which is what you'd expect for this sort of material. And then we apply the BET theory and we get a nice straight line. And from the BET line we can measure the surface area. And this material has a surface area of about 1 meter squared per gram, as you can see in the overhead. And this is very, very similar to the experimental measurement that you would expect for the reference material. So for an organic. For an inorganic reference material, the octane adsorption using IGC gives you a very good estimate, which is in full agreement with the accepted reference value for that material. But, of course, you're not going to be interested in aluminium oxide. We would like to look at a pharmaceutical material. So here is some data on a pharmaceutical material. So this material is paracetamol, otherwise known as acetaminophenol. And what we got here is a series of data where we bought some material. This one, Sigma Aldridge high purity. We've used quite a bit of sample, well, 250 milligrams. So that's certainly, you know, five, ten times less than you use with BET. And we've packed a column and we've measured the BET surface area in 10 successive measurements. And what you can see here is the surface area is low. Okay. It's about 0.3 meters squared per gram, so, well, less than 1. And actually, we can see on the bottom table here that we've got a range of surface areas which are between 0.28 and 0.27, with a very small RSD and very low standard errors. So, in other words, for materials that are less than 1 meters per gram, in this case 0.3, we can measure BT surface areas very accurately, very easily. But here's a question. What happens if you've got a material that is sensitive to water vapor? And we heard earlier today about hydrates, and of course, hydrates are very, very common in APIs. I don't have a hydrate example to you for you in a moment, but I have an example of a material where, in fact, if you were to condition it under nitrogen, you would dehydrate it. In fact, I'm going to show you an example of a material. It's a simple material where we've done the BET surface area at different humidities, and this is potentially applicable to a hydrate material, because if you took a normal hydrate and put it in a liquid nitrogen absorption system, you'd have to dehydrate it by removing the water. But we can do these experiments using IGC at different humidities. So here is a measurement of the surface area of cotton, and cotton is not unlike cellulosic materials. But what you can see here is that as I change the humidity in this particular case, the material swells slightly and the surface Area changes due to humidity. So the IGC method is quite interesting because it allows us to measure the surface area of a material how at different humidities, which is quite interesting and quite novel. But let me move on to the main thing today, which is surface energy. It's a very important property for particular materials, but the properties not often measured because it's a little bit tricky to measure for powders. And we'll hear why in a moment. And just to remind you what the surface energy is, we're probably all relatively familiar with the surface tension of a fluid. It's the amount of energy or work required to create a new surface area. So if I have a droplet of liquid and I make the droplet a little bit bigger, I have to put a bit of energy into the system. And the energy required to do that is known as the surface tension. For a liquid, the surface energy is the same, except the surface energy relates to a solid. So if I want to create some more solid surface area, I've got to put a bit of energy in and that's known as the surface energy. And the surface energy is a direct measure of the intermolecular forces. If I want to create a new surface, I have to pull molecules apart. So I'm measuring intermolecular forces. All fluids, all solids, will exhibit some van der Waals forces. These are long range molecular forces. And we'll see some of those examples of those in a moment. And some materials are those that have polar groups or acid base groups, such as OH or hydroxyl groups will also exhibit in addition, some acid base forces or polar forces. And we'll see some examples of both of those in today's presentation. So when we measure the surface energy or any of the surface tension, we're actually probing the intermolecular forces of our liquid. In this case, we're looking at intermolecular forces in our solid. And those forces are helpful to understand many different sorts of behavior of our particular materials. Now, there are lots of techniques out there for measuring the surface energies of solids. And some of them you will have come across. We heard reference to atomic force microscopy before, a very common technique, very popular technique. And if you've got flat surfaces, it's a good way of imaging materials. You can sometimes use it to measure the surface energy of a flat surface, but it's a bit tricky, but it is doable. The most common way to measure the surface energy of a solid if you've got a flat material, is using content angle measurements. It's a Very good way. If you've got a flat polymer film or a flat ceramic wafer, very good way to measure the content angle. And from the content angle of a fluid I can then work out what the surface energy is going to be. But the problem for these techniques, and including the wetting balance techniques that's over here, is that for particulate or for very rough surfaces, they're not very good. They've all sorts of complications. So actually it turns out if you want to do particulate materials or fibres, the inverse gas chromatographic method is the best. It's more reliable, it's more reproducible, and doesn't suffer from a number of the experimental problems that you have using AFM or conodemal determinations. So we're going to talk about the use of IGC for determining the surface energy of powders right now. So once we've measured the surface energy of our powder, why would that be useful? Well, if I know the surface energy of a powder, I can understand how particles interact with each other and with themselves. So if I'm looking the way powders interact with themselves, I'm interested in cohesion. If I'm interested in how they adsorb vapors, I'm interested in sorption. If they how they disperse or how they wetted the liquid, it's a wetting behavior. And how they adhere to other materials is called adhesion. And all that can be partially determined based on you knowing about the surface energy of your material. So once you've got surface energy, you can start to understand cohesion, absorption, wetting and adhesion behavior. So in terms of why you might want to measure it, here's my little list of potential reasons why the surface energy of your powder is potentially useful. I won't go through this, but it's broadly around adhesion and cohesion. It's also around process induced disorders. They think about minding a milling or micronization of solids, batch to batch variability, and also sometimes just getting a fundamental understanding of the surface chemistry. Different polymorphs, for example, might be helpful in terms of understanding some formulation problems. So there are lots of useful information sets where surface energy is helpful and we'll see a couple today. And as I said, if we look at the surface energy it reflects in the wet ability, as materials have higher cells energy then liquids will wet them more positively, you will get stronger adhesion between particles of the same type, which is called cohesion. The higher energies also relate to disruption surfaces due to milling or mochanization and Also, higher sources will give stronger adhesion between particles of different types. So once you've got a handle on source energy, you can start to understand some of these processes. So let me talk about the first important measurement we're going to do with surface energy. We want to measure these long range adhesive forces, which we call van der Waals forces. Sometimes they're called dispersion forces. And to do that we're going to inject a series of alkane molecules. Now, alkane molecules only have van der Waals forces because there are no hydroxyl groups or any other active chemistries. So what we can see here on the left is we're going to inject a series of molecules from heptane through decane. As the molecules become bigger, they have strong glutinous forces, higher surface tension, so they spend more time adsorbed into on air material. In this case, our column is packed with micro crystalline siloes, a very common excipient. And from the retention data that we see here, we're able to determine this thermodynamic construction here, which allows us to estimate the surface energy. This is the adhesive properties or the interfacial molecular properties of our particle surfaces. And we can see here the, we're measuring the surface energy of this advice cell material at two different humidities, at 0 and 70% humidity, where there are some differences in the actual properties. And from these experiments based on igc, we can also measure what we call the surface energy heterogeneity. Now it turns out that many pharmaceutical materials do not have homogeneous surfaces. And those surfaces can vary for a range of reasons, which I'll explain in a moment, but it's quite common because we've got heterogeneous chemistry, we often have heterogeneous surface energies. And the IGC will allow us to measure the surface energy, as you can see here, as a function of surface coverage. So it's giving us a representation of how the energy varies across the surface. So we have some hot spots, if you like, which is shown by the data on the left. And eventually at high concentrations, we see a more uniform surface. Now the reasons for us seeing these things, there are lots of reasons why you see this heterogeneity. But there are chemical contaminants and impurities, different crystal planes, different crystal facets have different chemistries. We have different sorts of amorphicity sometimes, we sometimes have polymorphs, hydrates and sulfates. We have defects, irregularities. There are lots of reasons why we have heterogeneity so actually heterogeneity is quite common in these classes of materials. So when we're doing our inverse gas chromatography experiments, we're essentially doing gas adsorption experiments. So we've got, on my model adsorption isosome here we've got concentration on the X axis and the amount absorbed on the Y axis. And we're typically working in a transition between the HENRY and the BET regions. And that allows us to probe surface coverages up to about 20% of the surface. So in other words, we're going to look at the surface chemistry of about 20% of our surface, which represents typically the most active sites on the surface. So what we're going to do in our experiment is we're going to increase the concentration of molecules by doing a series of different injections. And as we increase the number of molecules, we change our sampling space. When I inject a small number of molecules, I tend to profile the high energy sites. And when I inject a large number of molecules, I will sample both the high energy and the low energy site. So I'm able to get statistical measure of how homogeneous, or rather not the material is that I'm actually looking at. And we'll move on from this one here. So what I'll end up getting in my IGC experiment is I'll get surface energy, which I see here on my left hand plot. I will get surface energy as a function of coverage. So if I've got a material that's got lots of defects, for example, it'll typically have a big variation in the energy. And materials that are more homogeneous with less defects will have more uniform surface energy here, the uniformity shown here. And from the surface energy versus coverage, I can also determine some normalized surface energy distribution, just like a particle size distribution. Except rather than having particle size as our metric, we have surface energy. And you can see here in this model thing that I've got one material that's got a very wide variation here, the blue curve, it's both wide and high. And the red one is both narrow and lower in energy. So that gives you some idea of the sort of properties that we can establish from these sorts of experiments. And from that we can also determine the gamma 50, which is the 50% population average. So we can get some statistical measures of the surface energy. So the data I'm about to show you now is some work we did a few years ago on mannitol. Now, mannitol is a very common excipient. It's a crystalline material. We did work on D mannitol, and we have two types of D mannitol that we prepared in the study. We took normal as received demonitol, which is a fairly hydroxyl intensive material. It's a sugar. I'll show you the structure in a moment. And we also produced a related material. We produced a hydrophobic material. So D mannitol is a hydrophilic material, has a lot of hydroxyl groups on the surface of the facets of the crystals. And we also changed that chemistry by using cyanising chemistry to make some hydrophobic mannitol. And the first part of the study we did was to grow some very large crystals. But we wanted to compare our surface energy data, which is going to be determined on powders using igc with a traditional method of determination, which is the contact angle on a crystalline surface or a flat surface. So basically we grew some large crystals, did contact angle measurements, and then we moved on to our powders a little bit later on. So here's the chemistry of mannitol. As you can see, lots of hydroxyl groups. And on the right you can see some large mannitol crystals that Raymundo Ho grew as a part of his studies here. And the different crystal phases are shown. And we'll see later on that those different crystal phases have different concentrations of hydroxyl groups. That affects the shape and aspect ratio of those crystals. And we'll see that in some of the chemistry we're going to explore a little bit later on. So we took some of these large crystals that were grown, and we took water and di iodomethane, which are the standard ways to measure the contact angle and surface chemistry of a material. And we put droplets on different crystal faces. And the table that we can see belief here shows you the con of angles for water on these different crystal faces. You can see the O11 facet has a very low conv angle. That's because it has a high concentration of hydroxyl group. So the conduit angle that you're seeing reflects differences in the concentration of hydroxyl groups. We can see that with our wettability experiments. And we'll see equivalent data later in our IGC experiments. So what you can see here is that the dispersive and the polar surface energy are different for each crystal face. Okay. And the gamma Ds you'll see vary between 39 and 44. And we also have some polar forces here which are due to the hydroxyl groups on the surface that's for our as received normal mannitol with lots of hydroxyl groups. Now what we've also done is some XPS work. What you can see here are XPS traces of the actual material. And what you can see is on the 011 face, which is the end face, you can see how much more hydroxyl groups are something like three or four times the concentration of hydroxyl group, which is why it has the lowest condit angle for water. So the chemistry of the surface, it reflects the chemistry structure and the chemical groups that are present on each crystal facet. Well, I said we also wanted to produce some hydrophobic material. So what we did was we took some cyanising chemical and basically we went to some trouble to replace all the hydroxyl groups with methyl groups. So we're going to essentially make a hydrophobic material. No hydroxyl groups, so no polar forces, no acid base forces, just a van der Waals forces. And we treated that material. The x ray diffraction is the same because we've just changed the surface chemistry. And XPS confirms the presence of our hydroxy of our methyl groups on the surface. And of course what we did then is we did that for single crystals and we measured the surface energy of the crystal faces. And what you can see now is, is that for the cyanide material, which is the column and the pink here you can see how the surface energies based on contact angle measurements are now the same for each of the different facets. So whereas before, because hydroxyl groups were varied in concentration, these different facets, even gamma D varied a little bit. But now once we put all these methyl groups present, all these materials basically look the same. So that's what we get. This is all about conund angles. But of course in the real world we can't grow 2 centimeter crystals. We actually need to deal with powder. So we're now going to move across to start to characterize the mannitol and demonitol that's been modified using inverse gas chronography. So we're now moving to powder. So the next bit of work you're going to see are studies on our powders. So now what we've got is some IGC data for the powders. So we've got some untreated and, and also the cyanide finish. So the untreated material with all the hydroxyl groups, you can see that that's got a much higher degree of heterogeneity. Surface energy which is over here varies from about 60 all the way down to about 40, whereas the red line, which is my solanoids material, is about 32 all the way across. It doesn't vary. And here's another fairly inert material, which is racemic ibuprofen. Again, very homogeneous material. How about our wetability data? How does that look? And now we put our Conant angle data across here. The con angle data is very good agreement. And do you recall that I'm talking about surface coverage here? So by the time we get to about 10% surface coverage, the IGC data and the cone angle data are the same. In fact, the continental data is an average for the entire surface. It's not able to detect high and low sight energies. So essentially we're able to get a good agreement between the IGC data and the continental data. So it gives some confidence that the IGC data we're going to use in the rest of our presentation is reliable and sensible data. So we've now got these two powders. One powder is hydrophobic, one powder is hydrophilic. So because we've got the surface energy, it's quite easy now to compute the cohesion. How much do cyanides powders want to stick to each other compared to these as received Manitoba materials? And what you can see here, that the as received materials ar are much more attractive to each other than the cyanised materials. In other words, the cyanized particles don't stick as much in theory. So this is a prediction simply taken from the surface energy we've measured for the powders. So let's now see, this is the predicted adhesion. And what it says here is that the agency of mannitol is stickier effectively than the mannitol than the solanoid mannitol materials. And do remember, these particles are all the same size, same shape, same density. They're all the same, except that some of them are hydrophobic and have different surface energy. So if we now go on, and this is how we compute the surface of the energy thermodynamic work cohesion, we can now look at the practical cohesion by looking at some FT4 flow behavior. And what you can see from the FT4 flow behavior is that essentially the material that's as received we think it's got higher energies and actually it is a much stickier powder. So the FT4 data says yes, the AS received material is stickier, and the FT4 powder says yes, the as received material is sticky. So basic validation that the adhesive properties of those powders agrees with what we see experimentally. So let's look at some other examples. And now we're going to look at some aspirin materials. So these are aspirin powders that have two different histories. We've got some materials that have been milled, and they're shown in the blue. And we've also got some unmilled materials of the same size shown in the red. And what you can see here is that when we do some dissolution studies on these materials, we get much faster dissolution of the milled materials. The milled materials, regardless of the two different particle sizes I show you, the milled materials are going to dissolve much faster, and they'll be getting a stronger absorption, which we print, which relates to a higher dissolution rate. So now we're going to take those same materials and we're going to characterize them using igc. And what we see here is these are the dispersive surface energy distributions, and this is a measure of how high the energies are. And what you can see here, the milled materials, which are the blue and the green, have much higher energies for the same particle size than the unmilled materials. So what we're seeing is, because the particle size is the same, that there's a agreement between higher surface energy and higher dissolution rate for a material that is the same from a chemical perspective. In other words, these materials have the same chemical structure, but we're seeing some differences in the thermodynamic landscape of these different materials. So the milled materials, which have higher energies by quite a bit, by 20%, have quite different dissolution properties. And in fact, this also comes back to changes in the surface groups that are present. So, in other words, when we mill the material, we change the population of different surface groups that are present. So these different surface energies reflects a difference in the surface chemistry of the powder. In other words, the milled and unmilled material have different populations of crystal facets, different crystal facets. So the fifth, the facet chemistry is at play. And we can see that through the IGC data sets. We've also done some other work looking at the effect of crystal habit on surface energy. And as we change crystal habit, which is shape, and shape relates to the population, different groups, we also can see changes shown here. So we've got a series of different materials with different crystal habits. We see those as a way of separating them in terms of the population and different facets within our powder sets. And the IGC data is able to see differences in the populations of facets which we see from sieving the powders. In other words, particles that are more rod like will have a different surface property than particles are less rod like because the population of surface facets has changed in the milling or comminution process. And similar data here for some other materials. So the final example I think I've got today is really around granulation. Wet granulation of powders is an important process by which we will take small particles and make larger granules or agglomerates. The first stage is to take the powder and just spray it with a liquid. Typically it's called a binder solution. It's typically aqueous based, may contain a polymer such as pvp. And that liquid will wet our powders, granules will then form. And we're particularly interested in understanding will our liquid droplet wet or not wet the powder. And if it makes, if the powder has different wetability, will it affect the granules that I end up with? And that's what we're going to concentrate on for the last five minutes of the presentation today. So the examples I'm going to show you today are identical. Identical wet granulation conditions, same binders and same primary particle sizes. We sprayed an 11% solution of PvP that was the binder. And we have a range of different powders which were hydrophobic, mannitol, hydrophilic mannitol and mixtures in between. So basically we took the particles you saw earlier on, we made powder mixtures and we granulated them. We measured the mechanical properties and the particle sizes. But because of time I'm just going to talk about particle sizes. But actually both the mechanical properties and particle sizes changes simply because the wettability of the powders varies. So what I'm going to do in the analysis today, and I won't get in much detail, is we're going to measure the surface tension of the PVP solutions, We're going to measure the dispersive and the polar components of the surface tension of those solutions. We're going to measure the surface energy of the powders, both the hydrophobic powders and the hydrophilic powders. And we're going to estimate gamma D for dispersion, gamma P for polar, and we're basically going to predict will the PVP solutions spread out on the powder. So basically this is a wetting experiment. Characterize the powder, characterize the actual solutions, and then we predict the wetting behavior. And what we end up with is this determination of spreading coefficients. Now, the spreading coefficient is a measure of whether or not the liquid you have want to wet the surface that you have projected in front of it. And essentially, if the spreading coefficient and the numbers we're going to particularly focus on are the ones over here in this column, the spreading coefficients tell you whether droplets want to spread or not spread on your solid. In this case, our powders, what it says here, for the silinized material, it has a positive value and that means that spreading is not encouraged, it's not thermodynamically very favorable. Whereas for the untreated material, that's my hydrophilic material, the one that you would expect should be more facilitating. It is. And our average value of minus 6.7 says that for that particular material, my PVP solution will want to spread on it. So that's a solution that will be spreadable and that would encourage granular formation. And the cyanise material, it does not want to spread. So that would undermine our granulation process. And if we look at just some simple properties in terms of what we measure, this is now looking at in this graph, we're looking at granule size. Yes, these are quite large granules, you're right, they're up to a couple of millimeters in size, but that's not uncommon. And what we can see here is that the granule size depends on the composition of the powder. So for example, if I look at here, the diamonds, the wide open diamonds, they are, they are untreated material, 100% untreated. That's the normal material you buy from your supplier. That material gives you quite large granules, basically up to about two and a half millimeter sized granules. However, the material that's untreated, this is a hydrophobic material where the water does not want to wet, it is shown by the black squares, and that has a size of about 1.5. So in other words, the liquids that wet, because the surfaces are more hydrophilic, give us particles that are nearly twice as big as the hydrophobic particles. In other words, if I've got two formulations and they have all the same chemistry, the particle size, particle shape, then the surface energy will affect particle size by a factor of two. So that's in some cases quite significant. So I think my time is up. Time for me to conclude. So what I've shown you today is that IGC can be used to measure the surface energy of solids, particularly low surface areas. We can map the surface energy materials using igc and this data agrees well with weight ability data, which often is difficult to obtain. The surface energy tells us about the heterogeneity surfaces, which can be created during milling. And also turns out this surface energy relates to powder flow. And not only does powder flow affected by certainty, but if we're doing granulation, particularly wet granulation, the ability of liquids to wet my powders can be predicted directly from IGC data. And that also relates directly to some of the final attributes of the granules, both particle size and particle mechanical strength. Thank you for your time and attention. And Raimundo Ho should be highlighted here, because Raimundo, who works at AbbVie, quite a bit of the work we looked at today was from Raimundo, and there was some work from George Wang in there as well, and my other collaborators. So thank you for your time and attention. Happy to answer any questions at the end of today's program. Thank you very much, Professor Darrell William, for your present.
More from Prof.

Webinar: Advances in Measuring Gas and Vapor Permeation Through Membranes and Barrier Polymers

Webinar: Determining Solubility Parameters of Bacterial Cellouse Through Energy of Adsorption

Online Webinar: Recent Technological Advances in Adsorption Based Direct Air Capture

Online Webinar: Surface Area of Pharmaceutical Ingredients at Real World Conditions by IGC



Hybrid Workshop: Measuring Material Vapour Pressure Properties Using Advanced Sorption Technique

PCL Hybrid Workshop: Recent Advances in the Characterisation of Pharmaceutical Powders


Using Advanced Techniques to Test the Performance of Recycled Bathroom Tissue | A video summary
