Webinar: Challenges on specific surface area analysis of cellulosic materials
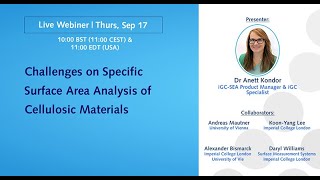
Dr. Annette Condor compares three methods for measuring surface area in cellulosic materials: nitrogen sorption, inverse gas chromatography, and dynamic vapor sorption. Nitrogen sorption often produces unreliable results for these samples and can introduce artifacts. IGC and DVS work better for cellulose, bacterial cellulose, and nanopapers.
Questions this video answers
0.05 to 0.30 relative pressure.
At least four points.
TriStar 3000.
Liquid nitrogen temperature, −196 °C (77 K).
IGC: 6 mg; DVS: 3 mg.
Chapters
Good morning and good afternoon for everyone. Today's webinar is about challenges on specific surface area analysis of cellulosic materials. It was a collaboration work with Imperial College and the University of Vienna. During the presentation, first I will give you an overview about the specific surface area analysis and about the applied techniques during our study. And at the end I will share the result and the challenges what we faced with during this study. Specific surface area analysis is relatively well known measurement. There are plenty of publications about it and specific surface area is a quite commonly measured property of solids. If you are not familiar with it, this standard document contains everything you need to know about this. And the most important is that BT indicates an equation, the method which is applied to determine the specific surface area. So it's actually not a technique, it's just an equation method for the bet. For the specific surface area analysis, UPEC classified the adsorption isotherms in six different types for the BET to apply the BET method only the type 2 and type 4 is C table. During the measurement, the inaccessible pores are not detected by any gases and the BET equation is worked out for a specific relative pressure range which is 0.05 to 0.3 relative pressure. Within this relative pressure range you need at least four points to determine accurately the BTE specific surface area. For the analysis you can use any gas which will absorb physically on the surface, so create a weak point at the surface and can be distorted by a decrease in pressure at the same temperature. Nitrogen at its boiling point is usually the most suitable at sort view, but you can use other gases and vapors to determine the specific surface area by the BET method. In this standard document there's a table which lists the fragment in used adsorptives. And in this table you can see that there's some organic vapors and some other gases as well that you can use to determine the specific surface area. Octane heptane can be also used at room temperature which is a more sensitive compared with the liquid nitrogen condition which is required for the nitrogen argon or pepton. Volumetric technique has a technical limitation. There's a lower limit of surface area at which the size of the relative error becomes unacceptable. So they suggest to use other gases or maybe other techniques. Besides this technical limitation, the conditions of the measurement could cause some structural changes in certain materials, like pharmaceutical hydrates will completely dry out, crystals might collapse under this condition, and some food materials release thermal compounds which affects the analysis and the results at the end. The condition effect of the nitrogen volumetric measurement was Studied in different studied by different research groups. This publication was done on the spray dry dispersion which has a low glass transition temperature point. Therefore, nitrogen or krypton sorption measurement is not suitable to determine the specific surface area. Although IGC is an alternative technique to measure the bio the specific surface area of this kind of materials because it applies ambient temperature and pressure and due to the inert carrier gas flow, there's small risk for the structural changes. So that's all about the specific surface area. And now I will give an overview about the techniques what we applied. So we used volumetric nitrogensorption instrument and the model was the TriStar 3000. It has an external degassing device. What we used for the sample preparation, the measurement carried out that the liquid nitrogen condition. So the sample tube was dipped into liquid nitrogen. And this technique requires relatively high amount of sample in case of low surface area materials. The other technique that we also used was IGC inverse gas chromatography. It's a carrier gas technique and during the measurements the conditioning was an in situ process. The software was allowed. The software is designed to run a conditioning just before an experiment. The temperature range of the instrument is from 20 to 150 degrees C and it's very suitable for low surface area materials. And to determine and adsoptionize the term in this gas chromatography you need a series of injection of an organic vapor, different concentration injections and you can get the isotherm. The third technique, what we used to measure the specific surface area of the cellulosic materials was the DBS dynamic vapor sorption instrument. It's a gravimetric sorption technique that measures the rate and the amount of solvent sorbed and released by a sample. It provides also an option to set up outguessing and it's an in situ process and also has a wide temperature range from 5 to 85. But we measured the samples at room temperature and it requires also a small sample amount. On the table you can see that summary of the three different techniques. The temperature in case of volumetric instrument it was a liquid nitrogen temperature -196 degree and then DBS and IGC is 25 and 75. The adsorptive gas in case of DVS and IGC was octane. In case of volumetric it was nitrogen. The carrier gas in case of DBS and IGC was nitrogen. The duration of an experiment excluding the conditioning time was the longest in case of DBS due to the kinetic absorption and desorption it took Much longer than the other two measurements. And the shortest one was the IGC measurement. It was a little bit less than three hours. So that's the summary of the three techniques and the conditions. And during the study we investigated three different cellulosic materials. Crystalline pile. There it was Evicel PH101. And we also investigated a cellulose nanopaper in a freeze dried cellulose material. First I will show you the results on the freeze dry cellulose bacterial cellulose. The first challenge we faced was during the packing of this sample into the sample tube of the volumetric instrument. This sample is quite fluffy, very light. So the gravity doesn't help to to pack this sample into the tube to the bottom of the tube. So we had to pack it very carefully because pushing the sample through a long tube could affect the surface, could cause changes. And so it was a quite challenging procedure to pack this sample tube. And we had to use relatively high sample amount, 15 milligrams in case of the DVS and IGC, the packing or placing the sample on the sample pad was much easier compared with the volumetric device. In case of IGC and dvs the sample amount was significantly smaller. But we had to use and on the pictures you can see the samples on the pen and in the column, the chromatographic column. The position of the sample in the chromatographic column doesn't affect the results. So after we the tube and the column and they were preconditioned to remove any absorbed contaminants. And in case of volumetric instrument it meant an external device, it was a smart prep device. In case of IGC and dvs the conditioning was an in situ process. Straight before an experiment we could set up conditioning stage for the sample. And after that the measurements started straight away. So it wasn't a challenging thing, it was just a difference between the techniques. The method setup was I would say similar. Required the same basic operational skill for all the tree systems. So wasn't really different between techniques then. So here's some isotherms. But we measured. So this one measured with the IGC technique. We repeated every experiment three times. And here's the tree runs on the same sample with igc. So the results are quite reproducible. Here's one isotherm and disruption curve with the nitrogen volumetric technique in the kinetic graph with the DVS and one sorption desorption curve with the DBS on this freeze dried bacterial sample. And here's all the three DBs curve the DVs. So you can see all the all the isotherms was nice and was the applicable type of the isotherm. On this slide you can see just the summary of the results what we get with all the three techniques. The red blocks represents the volumetric nitrogen absorption results, Green is the IGC and blue is the dbs. So on each technique we repeated three times the experiments with IGC and dbbs we got quite consistent values specific surface area values for the freeze dried bacteria cellulose. However, with the volumetric nitrogen absorption, the experiment to experiment reproducibility on the same sample, the sample tube we didn't remove, even the sample tube wasn't reproducible. So we got different values from run to run. And there was quite a big difference between run so 30% decreases between the first and the second run. And also the surface area value, what we measured with volumetric nitrogen sorption was significantly smaller which was also interesting because nitrogen is much smaller molecule than octane. And we measured really really small compared with the IGC or DBS surface area values. So here's we're faced with the second challenge to understand the results to interpret them. But we decided just to do more experiments and repeat the surface area measurements on another batch of freeze dried bacterial cellulose. So in the second batch of the freeze dry bacteria cellulose we just used IGC and the volumetric nitrogen absorption technique because DBS measurement took quite long. So we just used IGC and the volumetric nitrogen soption anyway then BBS and IGC provided the same value in the first place. In this case on the second batch the results on IGC still consistent. We got the nice similar values with each experiment. But in case of volumetric measurements now the results showed an increasing trend. So from run to run the surface area increased of the freeze dried bacterial cellulose. So after these measurements we concluded that the specific surface area using volumetric nitrogen absorption is still not reproducible on the freeze rhine bacterial cellulose sample. The next step was to check the reliability of the IGC results. So to investigate is there equilibrium between the gas and the solid phase. So how reliable is the IGC data? This can be done by varying the flow rate through the experiment. So we use 5, 10 and 20 milliliter per minute nitrogen carrier gas and we measure the same surface area value of this sample with a relatively good standard deviation, 1.06 meter square gram deviation, which was quite good. And it was convincing that the IGC results are reliable and there was equilibrium during the measurement. So after this we concluded that IGC results are more reliable and accurate than the volumetric and even quicker than the TVS measurement. It has a very good reproducibility. It provides an EC2 degassing and an easy sample preparation. But still there was this one challenge what we couldn't solve. Why the volumetric does not work well on Free Tribe bacteria Sterolose, why the results are not reproducible and not reliable. So the first thing would be that there's no equilibrium because during volumetric measurements there's no kinetic information. And the other thing, what we thought that maybe something happened with the sample due to this thermal shock which happens during the measurements because the sample basically from a lab condition, from a lab temperature is going to 77 kelvins deep into liquid nitrogen. So basically 200 degrees C temperature changes in a very, during a very short time. It's really a shock, a thermal shock on this organic sample which could cause shrinking or some other structure changes. We are still working on to find the answer for this. So it's still in progress. But if anyone has the answer for this, please comment. Share with us in the chat box. Thanks. So let's move on to the next sample, which was Solo's nano paper, which was like this, looked like this, but for the volumetric measurements you had to cut it. So it was also a bit challenging because we had to cut the sample to stripes in short stripes to make it suitable for the sample tube of the volumetric technique. And this picture, the last one was taken after the conditioning. And you can see that after the conditioning, the temperature conditioning, the sample became a bit yellowish, so changed in color, which was also an interesting observation for us. We think that probably there was some oxygen, what the carrier actually couldn't push out from the tube. And after we packed the sample and condition, we performed the experiment. And the first run, first results look like this and the second run and the third run. So for us it was really hard to define this isothermic, to categorize this isotherm based on the UPEC classifications into one of that slide. And we had discussions with other researchers who's working with cellulose nanopapers and they also mentioned that they got similar type of mesotherm when they use volumetric measurement. And yeah, it's a little bit interesting. And also what we observed that the adsorption curve is going down, so it has a negative slope. Basically there's no really adsorption, which is very weird and interesting. But in some cases there is a positive veg curve. So Here came the third challenge to understand this phenomena, this type of isotherm. And how is it possible to get the positive PET curve even though the adsorption isotherm has a negative solve. So we checked equations and everything, how the volumetric technique calculates and determines the bet. Then mathematically it's possible. Although scientifically I think it's impossible to use this kind of adsorption curve or this term for BET specific surface area analysis. So with volumetric we didn't really report the values. What we got for this cellulose nano paper, we moved on to the next technique igc. To pack this nano paper into the column was much easier. It doesn't require to cut the sample. You just need a piece to roll the paper and just push it into the col and that's it. And after the experiment and the conditioning we checked the sample the sample column and we didn't see any color change. So also we see benefit of this in situ conditioning is the sample remained in the same colors pro there's no changes. And here's an isotherm with IGC using octane, it's much nicer. It has a positive slope since there's really adsorption of octane molecules. And here's the BET plot 1 of the BET plot the surface area was 15.25 of this Nano paper. So in case of the nano papers we concluded basically that volumetric nitrogen absorption is not really applicable. Maybe the dead volume in that tube or something else the reason but IGC is really applicable on this paper and we get the very nice results and reproducible results. The last sample that we investigated in another sample, it was an evicel, a crystalline powder. It's mainly used in pharmaceutical industry as a binder for tablets. But it has also other applications. During the sample tube packing or the column packing, there wasn't any challenges. Was easy for all the techniques to pack the column or to place to the sample pan. Ice germs also looked nice with the positive slope. It's a volumetric and IGC we used the same conditioning 28 hours 80 degrees C. And the results were really nice and reproducible on volumetric technique and also on IGC inverse gas chromatographic technique. Slightly better reproducibility in case of IGC what we measured. But I think both is quite good. However, to find the best conditioning parameters, the temperature and the duration of the conditioning was quite challenging. In case of this sample every cell. So in case of nitrogen absorption measurements we use different preconditioning 50° 300° 80° C with different durations and we get different bet specific surface area values. And then we apply the same conditioning in case of igc. But the results were consistent with each conditioning parameters. So the challenge is really to optimize the conditioning parameter is is in case of volumetric measurements. That's what we concluded and observed with IGC results when affected with different conditioning parameters. Probably because it's an in situ conditioning and in case of volumetric is still an external process. The last results. What I'd like to share with you is the impact of the relative humidity on surface area with inverse gas chromatography. We have a benefit to investigate the impact of the relative humidity on the different surface properties. Because we can mix the carrier gas with water vapors to generate different relative humidity and we can measure the different parameters surface area, surface energy under humid condition. So here's an example For a standard material of a luminance sample. The reported surface area of this material is 2.95. With IGC with zero relative humidity. It's also 2.95 if we use octane at 30 degrees C. If we mix the carrier gas with water vapors and we generate 50% relative humidity and we measure the surface area at the same condition, the surface area decreases a little bit. And with 90% relative humidity there's even more significant decreases in surface area. So as humidity increases, the measurability surface area decreases because water competing for science or blocking available surface area. And it affects the surface area, the specific surface area, the available surface area. So we determine which humidity level or what's the percentage of humidity which affects the heavy cell surface area. So we measured the surface area from 0 to 90% relative humidity actually and this background humidity and we could determine an infection point basically where stem cell surface area started to decrease. It was around 85% relative humidity in case of this ph101. So relatively quite high humidity Compared with some other materials like in case of magnesium steroide we Observed quite low 20% fragile free medical could cause significant decreases in surface area. And here's our challenge summary table Based on our experiences, we collected the different parameters and indicated yes if there was challenge and know if there wasn't any challenge on a certain technique. So you can see with DVS and IGC the level of challenge is quite low. We had only challenge in case of the nano paper when we placed the nanopaper on the DVS sample pen and in case of 5 GCs just an adsorptive probe gas could be Challenging on some materials. Volumetric nitrogen absorption technique for us seem to be quite challenging on cellulosic materials in many ways to understand the results, reproducibility, conditioning parameters and so on. Packing was also quite challenging. So based on our results, DBS and IGC have a low challenge and volumetric quite high has a quite high challenge. But overall our conclusion is that the most applicable method for BET specific surface area analysis is depends on the sample. It's a sample specific. We would not define a standard method for every sample. But in case of cellulysic material seems IGC and DBS is more applicable so we strongly recommend it. And volumetric nitrogen sorption technique seem to be challenging technique for cellulosic materials. So we only recommend it for challenge oriented researchers. And finally, thank you for your attention and I'm happy to answer your questions.
Thank you Annette. That was really great. We've got a very active board here. So we've got a good few questions for you if you're happy to take them. The first question is. Sorry, first question we have is what is your experience in BET measurements of aerogels based on nanocellulose? I am working in this topic and I have challenges to avoid including dead volume because the bulb is filled with only 20 milligrams.
Yeah, thank you for the question. Yeah, the R experience is really that in case of volumetric measurements it's really hard to pack and to place the samples into that hole. I would really recommend soption techniques because if you smash or try to if you compress this aerogel you will change the surface and you could cause maybe changes. And at the end you will measure a different sample not basically what you'd like to characterized. In case of TVS and IGC you don't have to push through the sample along a tube. It's much easier to pair. Especially in case of dbs you just have to place the free stride sample, the aerogel on a sample pen. Daryl Williams has a publication on freeze dried pharmaceutical samples and that publication is all about surface area analysis. We can share with you that paper and also we are working on the manuscript of this study. So it's also in progress to publish this data with a little bit more results. And after that we can also share that with you. So would recommend to use other techniques than volumetric.
Our next question from Raymond Pearson. He has asked for ITC sea How small is small? What is the sample size and also what is the size of the sample for dvs?
Sorry, I missed which kind of sample in Case of which sample was this question?
Apologies, the question was for idc what is the sample size? And also what is the size of the sample for dvs?
Okay, so. So in case of freeze dried bacterial cellulose, the sample size was for IGC was 6mg for DVS 3mg. In case of the other samples for the nanopapers we used also significantly smaller sample amounts. So it required smaller sample amount compared with the volumetric technique. So in this case we use 200 milligram paper nanopaper cellulose nano paper in the tube. And for IGC we just use maybe it's not there, but we just use about 30 milligrams. And for EPL it was also different for every cell we used in case of IGC just about 1 gram. And also you can use 500 milligram if you don't have this much amount. In that case the experiment will be even quicker. And for DBS you need also just a 20 milligram of Avicella. For the volumetric measurements you need much more. Basically you have to fill up the bulb. Was that enough or which kind of materials? This person is interested, I can maybe give you some IDs. How much sample is needed for IGC or DDS or other.
Great. And we invite Raymond if you'd like to follow up as you just mentioned with us, he can contact us at marketingurfacemeasurementsystems.com Our next question coming from Carlos Leoni. Leon. Would it be possible to perform volumetric tests with octane at high temperature versus N2 versus N2 at 196 degrees Celsius for a more direct comparison.
First of all, we didn't have the device and the nitrogen volumetric device is not suitable to use octane organic vapor. We could use krypton or argon, but it wasn't. Or CO2. There wasn't an option to use octane. Although in this study we wanted to represent the commercially available standard commercially available techniques applicability of cell logic materials. So without any modification of the instrument, how accurately we can measure the specific surface area and which specific surface area is more reliable.
Okay, great. We had a question from someone who's now left, but it could be useful for the other participants to hear it. The sample preparations for free with freeze drying are notorious for poor reproducibility. This may come from a simple small difference in fraction of solid to liquid in the sample. Did you image the samples?
No, we just had an image about the freeze dried samples before the experiment but after and these samples were crystalline samples with not much for us. And so we didn't really did that test. But thank you. Yeah, maybe it's something to consider about.
Okay. We have a question coming in from a Shahzad Sharif. He asks nitrogen instruments have a conditioning system vacuum and flow. Would the flow be very close to an IGC setup.
In case of this external device? What we used the flow also was quite close to the IGC because we use nitrogen with the same flow rate what is in IGC or dbs. And we also use the same temperature in this conditioning outgassing device. Yes, we are aware that there's a vacuum type of guessing device. But because we wanted to use the same conditioning in case of all the three devices and vacuum is not an option for RGC there's a vacuum DVs. So we could use vacuum. But for us it was the standard DVS was more available to perform this study. And that's why we didn't really use the vacuum sample sample preparation just a temperature treatment out guessing.
Shahzad has followed up with the question. So you confirm you use flow to condition nitrogen.
For the volumetric? Yeah, we use nitrogen flow. Yeah, there's an option also that device to use helium during the conditioning. But we used the nitrogen to be consistent with the other techniques. So it was a nitrogen gas in this case. Yeah. So at higher temperature to upgas and.
How about thermal shock?
Sorry again please.
Sorry. And to follow on from my question, how about thermal shock should it increase surface area?
Thermal shock when during the conditioning it wasn't that huge changes because the lab condition was about 20° or the sample was at room condition and the preconditioning temperature was 120. So around 100 degrees Celsius changes during conditioning. And of course we at the end of the conditioning we waited until the sample cooled down and volumetric measurements. We performed the weight measurement. We weighted the sample tube after conditioning and then we placed into the device and then the sample tube was dipped into the liquid nitrogen the experiment required. So during that was the 200 degrees C temperature change which could affect I think the sample and there could be some changes. That's why we measured a smaller surface area with volumetric in case of freeze dried samples. Probably the sample was shrinking or there was some this may be collapse the structure. We can't really see what's happening inside the sample tube. Would love to. Yeah. So there's also publications and even in this standard document mentioned that the measurement condition temperature could affect the surface area the specific surface area, especially in case of organic materials, it makes sense because they are not that rigid as inorganic materials. So the temperature has a huge effect on the surface properties. Especially if it's a big temperature changes 200 degrees C for example, it could affect the structure of the organic sample and the properties of this organic material and that surface area. What we basically measure at -196°@ liquid nitrogen condition is the surface area which is not available or not accessible during at room condition or the application condition of that solid material. And maybe it will not be that useful and informative as the DVS or this IGC result. That's also another thing what we might consider.
Okay, one last follow up from Sharif. He's asked should thermal shock not fuse the sample or would it crack the sample the sample surface and increase the sample surface area due to the crack from thermal shock?
I think it depends on really the sample and the structure of the sample. So in case of the freeze dried samples, it may be just the available surface. So due to the shrinking, maybe the less surface was available so that the crystal faces just closed. And then we measured significantly lower surface area of the freeze dried bacterial cellulose using volumetric technique compared with IGC or dbs. So in case of this type of sample, since the surface area is much smaller at that condition and in case of spray dry dispersion that the publication studied, the glass transition temperature point of spray dry dispersion is low. So when you expose this kind of solid materials to liquid nitrogen condition, there's a potential risk of structural changes is the material is going to its own glass transition point. So at the measurement condition the sample is a different state than at room temperature. So that's why it's not accessible the surface area of spray dried samples with krypton or nitrogen absorption measurement. So it's really, as we concluded at the end, the most applicable BET specific surface area method or technique. What you use to determine the BET specific surface area depends on the sample. The solid material, it's really sample specific. So would not define one standard technique for every samples. Inorganic materials are more rigid than organic materials which are more sensitive temperature for relative humidity and so on. So there's a lot of factors.
Okay, fantastic. I think we'll wrap it up there everyone. I'm sure you'll join me in once again thanking Dr. Dr. Annette Condor for a fantastic presentation and really thank her for giving such detailed responses to all of our answers. If anyone has any further queries for us or questions for the doctor please do feel free to send them through to marketingurfacemeasurementsystems.com for any of you who have inquired about the manuscript or slides being available, we will be making a video recording, an audio recording of this session available the next week, so we'll contact you with information on how to access that. Please make sure that you check back on our website for upcoming webinar information and I hope you all enjoy the.
Rest of your day.
Thank you and goodbye.
Thank you also for your participation. Bye.
More from Prof.

Webinar: Advances in Measuring Gas and Vapor Permeation Through Membranes and Barrier Polymers

Webinar: Determining Solubility Parameters of Bacterial Cellouse Through Energy of Adsorption

Online Webinar: Recent Technological Advances in Adsorption Based Direct Air Capture

Online Webinar: Surface Area of Pharmaceutical Ingredients at Real World Conditions by IGC



Hybrid Workshop: Measuring Material Vapour Pressure Properties Using Advanced Sorption Technique

PCL Hybrid Workshop: Recent Advances in the Characterisation of Pharmaceutical Powders


Using Advanced Techniques to Test the Performance of Recycled Bathroom Tissue | A video summary
