Webinar - Characterization on Solid State Materials | Dr. Damiano Cattaneo - Part 3/3
Dr. Damiano Cattaneo explains Dynamic Vapor Sorption for characterizing solid materials. Learn how solvent-triggered recrystallization quantifies amorphous content, how BET isotherms measure surface area, and how to track water and organic vapor sorption simultaneously.
Chapters
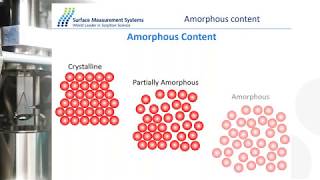
I think we are going to move forward with last presentation and as Daryl mentioned, we are going to take question at the end of all the presentations. So I'm just going to share my screen with you. You should be able to see my screen. Now. Today I'm going to talk about, I'm going to go back to the surgery of DDS and I'm going to talk about DDS applications specifically for amorphous content and BET calculation. So. Okay, one second. It seems to me that my laptop is moving a little bit slow. Here we go. So the overview of my presentation is going to have a small introduction about the technique of DBS and then we are going to focus on an example of how to calculate amorphous content using DDS data. And also we are going to focus on how to do the calculation of BET surface area. Practically the last part of the presentation will focus specifically on the sensor that we use to detect organic solvent in our dbs which allows us to calculate both the ammotor's content and the BET surface area. So whenever we talk about a study of dbs, which is a gravimetric technique, we study the interaction between a molecule, in this case could be water or could be an organic solvent and a sample. The interaction could be on the surface of the sample, which is usually defined as absorption, or could be through the bulk of the material, which in this case is defined as absorption. Now the process as we know could be reversible or irreversible depending on the type of interaction and the strength of, of this type of interaction that we are describing. So to define a little bit better these two concepts, we are going to look at adsorption, which is usually defined as physisorption or chemisorption and absorption, which is usually defined as bulksorption or absorption into the lattice structure. So for the adsorption definition, we usually talk about physisorption when we are dealing with a very weak interaction between the molecule probe that we're using and the surface of the sample. So it's non strong bond, it's a reversible process and the molecule can basically pile up on the surface of the material and can be removed very easily when we try to dry up the sample. We are particularly interested in this type of interaction specifically because from this type of interaction we can get information about surface area, pore size and surface roughness. Some other interesting information that we get from this type of interruption are each of absorption or also free energy, which Professor Darold has just described. For example, in the Sea Technology now, when we talk about chemisorption, we're usually talking about a very strong interaction. So the probe molecules are usually covalently bonded with the surface of the material that we are using and we are trying to study. We are usually interacting with specific site of the material. The process can be reversible or irreversible, but the energy involved in this type of interaction is usually much higher. Compared to the physician. We are usually talking about specific type of samples that are designed to interact with this type of probe. So titrate, acid base, active surface area and catalyst dispersion are the most common material that are usually dependent on chem absorption for the interaction with the molecule that we are introducing. Moving on to the absorption part of interaction. So this is a process that is in two phases. We will always have a part of absorption, so the molecule will always pile up on the surface. However, it's possible that those molecules can also penetrate through the surface of the material. And whenever we have a process of penetration of molecules through the material, we also encounter phenomena of diffusion. In this case, usually the kinetic process of absorption are much slower compared to something that only happened on the surface of the material. The process can be again reversible or irreversible. That depends on the type of interaction and the property of of the material that we are studying. However, this type of interaction can give us different type of information. For example, we can study glass transition, we can study crystallization, which we are going to focus about during this presentation, the requesting point. So the information that we can get is potentially total solution capacity and solubility parameter. But we can also focus for example on point polymer material. One of the interesting studies that can be done using gravimetric technique like DBS is diffusion coefficient or solid solid phase transition, for example, studied during the amorphous content characterization. The last part of interaction that can happen between a probe molecule and a sample is absorption into the lattice structure. And this has been highlighted very well during our first presentation from Dr. Jurgen. The solvent formation or hydrate formation is a bulk sorption process. And the example provided in those presentations were actually reversible. But we have also irreversible process of formation of hydrate or solvent. And in this case we are literally looking at our structural change. But also they can be studied not only from dbs, but for example from powder xrd. It can be stoichiometric. So we can exactly define how many molecules of that solvent are trapped into the new structure. So we can say, for example, is an exahdrate or can be non stoichiometric and for example, non reversible. So those are the type of interaction that we can have between a molecule and a material. So how do we study this specific type of interaction? So we use agavimetric technique mainly for dbs. But this method is basically a derivative of an even older method, which is defined as a jar method. You will have a series of desiccators which contain a saturated solution of a salt at the bottom of the desiccator. So you will have lithium chloride, sodium chloride, magnesium nitrate. Each saturated solution will generate a constant vapor on the surface. And inside the desiccator itself, you will record the initial mass of the sample. And then you will position your sample inside each one of the desiccator, wait for a few days and then record the mass again after a couple of days. And you will repeat this process in and out of the desiccators until the mass have reached equilibrium. Each desiccator will represent an equilibrium point in your isotherm. And from that point on you can build up the absorption study of your material. The DVS process works in a similar fashion, but we have a balance and a generation system that controls each step of generation automatically. So from a different point of view, we can look at these two techniques that technically provide the same type of data, but but physically actually have very much a lot of difference. In a gyro method, you require grams of sample because the process is manual, so you need to make it repeatable. So you need to increase the mass of sample to obtain the same quality of data that will be provided, for example, with a micro balance. In a dbs, so we work on gram compared to milligrams of sample. The difference in three time required for reaching equilibrium is significant because in a German meter you work in a static condition. So the equilibrium, the force equilibrium, is only due to diffusion of molecule inside the desiccatory cell. In a dbs, we actually drive the process using a carrier gas. So it's dynamic in the sense that we have a constant flow of gas that pushes molecule on on the surface of the sample, allowing us to achieve equilibrium much quicker compared to a static method. The difference in time we will see in a second is very significant. But we also have to consider contamination and cross contamination specifically. Because when you think about removing a sample from a jar to put it on a separate balance and then put it back into the system, into the desiccator, you are exposing to different level of humidity, potentially different level of temperature, because it's a manual process, it's affected by whoever does the process. Some might do it more quickly to avoid any contamination, some might do it more slowly to be more careful. So those introduce a systematic error to the measurement. In a DVS process, we can see here a gravimetric absorption and desorption. The red line is your mass change, your blue line is your partial pressure. That's a full process of absorption and desorption that happens in situ. So we don't have to touch the sample, we don't have to expose it to any different condition. While in a standard gravimetric desiccator technique we can only measure a single cycle of absorption, but it also requires a significant different amount of time. So the example that I'm showing you over here is exactly the same material. One running a desiccator about 300 days, one run on a DBS about 6,000 minutes, which is about 4.2 days. The other important difference that you see over here is that the data on the left only show absorption. The data on the right shows absorption and desorption in four days. Which means that when we plot our isotherm, we can measure only absorption. In a jar method we could do the desorption, it will take double the amount of time. And in a DBS we can measure full absorption and desorption and hysteresis effect. So how do we measure an experiment with a DBS is basically explained by looking at the graph, the schematic that show here how one of our instruments work. So here is an instrument that will run an experiment using water. So what we will have here is two separate reservoir, one containing water, one containing a carrier gas. It could be nitrogen, it could be air. That will be defined by the setup of your lab. We will push the carrier gas and the solvent through tubing. We will have a sensor right here that will allow you to measure the amount of humidity generated at each partial pressure stage. And then the humidity will push through to the chamber that contain a sample side and a reference side which are directly connected at the top to a microbalance. As you can see here, the system is perfectly symmetrical. So you can picture this as an old pharmacy's balance with two plate, a sample and a reference which are identical. The only difference between the sample and the reference is the fact that you put the sample on the left side and the reference side remains empty. So why do we have this symmetrical setup? A lot of the data that you see today about EVS and a lot of the data I'm going to Present forward are very specific measurement of absorption of molecule on the surface or of the bulk of of the sample. So those are very accurate measurements, but they are collected in a very comprehensive and very informal way. We just have a balance and we measure mass change. It's difficult to define mass change as an absolute value, especially in a condition that is not symmetrical, because you have to consider the fact molecule absorb everywhere. Molecule will absorb on the sample pump. Molecule will absorb on the end of wire on this side of the chamber. So to make it symmetric, to make it accurate, we make it symmetrical. If the molecule absorbs on the sample side and the reference side in the same way, the only difference will be the sample itself. So that's the reason why we developed the system to have symmetrical setup, to be more accurate and to be more repeatable. So a standard DBS experiment can be designed in a very simple way. We will try to dry the sample as best that we can. We can use just nitrogen or air for the initial stages, but we can also add a preheater if the sample requires preconditioning at higher temperature. So we can heat up the sample up to 200 degrees Celsius. If required to completely dry the sample, we will then introduce molecule of water or organic solvent, depending on the type of experiment that you're interested to run. And we will increase progressively each step the humidity or partial pressure of solvent around the sample until we go from zero, for example, to 90%. We then decrease the relative humidity of partial pressure and we measure the full kinetic of absorption and desorption at the end of each partial pressure stage. We also record the mass at equilibrium at each stage. And at this point we can then plot the absorption and desorption isotherm that you see at the end over here. And from analysis of the absorption and desorption we can get information regard to amorphous content in regard to BET surface area and so on and so forth. So this is how we connect the data. Now we are going to look at how the data generally looks like. So here is an example of a DBS set of data. Here is from a RICE sample is a two cycle absorption and desorption. It's a kinetic data. So the plot at the bottom is done on time. And we have percentage mass change in red and partial pressure or relative humidity in this case of water in blue. This is a full cycle of absorption and desertion. We start with our initial drying stage, we introduce water up to 90% and then we cycle it down and we repeat it. So what information do we get from, for example, the kinetic data. The first idea that we get from the kinetic data is the fact that this material can be dry to reach a constant equilibrium and it has a very, very high uptake. We're talking about over 20% mass change. So it has a high affinity for water. The other information that we get is the fact that this material is perfectly repeatable. In fact, you look at the first cycle and the second cycle, there is a high repeatability in the two cycle. Now if we take each mass equilibrium at each partial pressure and we plot it in an isoton fraction, you can see the data here. So in red we have the absorption stage and in blue we have the desorption stage. So as you hear over here, we get even more information in regard to the sample itself. We can see that the material has a stereosis gap between the absorption and desorption, which is probably telling us that this material has boxorption. What it means is that the molecular water not only pile up of the surface of the material but but also penetrate to the bulk of the material. And the information that we are getting from this type of material is the fact that to get to the same level of mass change during the desorption stage, which is the second, the blue part, we need to go to a lower level of relative humidity. So the material absorbs water very well and it's harder to dry it. So we need more energy to get the molecule out of the structure of the material. The other information that we get again is that the material is perfectly reversible so we can do sorption and desorption. So that is a general overview of the technique. And now we are going to show you a couple of examples of specific applications starting from amorphous content calculation. So I'm not going to go into detail of the definition of what is amorphous and what is crystalline. What I'm going to show you is how to identify and how to use the DBS to characterize amorphous material. What I need to focus on specifically is the fact that in a DVS we are never going to be able to tell you an absolute value of amorphous content. What we are going to be able to do is measure the ratio of amorphous content between a reference material and a second material. The reference material can be defined by the user. So from our point of view, we study a material from a point of view of difference in mass uptake. So you will pick a material that will be the as purchase or as prepared material and that will be your reference material. That will define the starting point of your calculation. Then you will study the same material, for example, after any manufacturing process or after storage for weeks or months. And you can calculate the difference of amorphous content of this second material compared to your reference, the DVS itself. You have to remember, only measure mass change. So you will never be able to define what is 100% amorphous as a pure definition. That is usually dedicated to spectroscopic technique, which are less sensitivity. But they look at the structural part of the material from a DDS point of view. We do a measurement of mass change and difference in mass change and uptake. So how do we do this measurement? The first starting point is the study of the isotherm. Here we look at amorphous lactose in this specific study, and we start from a dry material, which is amorphous. We, as you can see here, increase the partial pressure progressively. This is a two cycle absorption and desertion. And we get to a certain point in which the mass, rather than going up in the uptake, it goes down even though the partial pressure is going up. So there is a mass loss rather than a mass uptake. While we increase the amount of molecule of solvent around the sample. This is due to the fact that material is moving from the amorphous phase to the crystalline phase. So the crystallization process is causing the material to reduce the surface area. If you think about a material as an amorphous phase, the amorphous phase will be disorganized, not ordered. And that allows the material to have more space to absorb molecules, for example of water or of an organic solvent. When the material moves from the amorphous phase to the crystalline phase, the order, the structure of the material reorder itself and the reordering actually cause a mass loss, because the molecule that used to be trapped inside the structure during absorption now have to be released to allow the structure to pack. Consequentially, we measure the specific mass loss of the material. The interesting part of this isotherm is the fact that the second cycle that you see over here on the right side does not have any massless, indicating that the first absorption desorption cycle allows the material from moving to the amorphous phase to fully crystalline. And the material that we have in the second cycle is fully crystalline. Now, if we plot the isotherm of this study, you can see right here, our first cycle with the mass drop and the second cycle is a perfect overlap. So no mass drop in the second cycle means that the Material has been moved completely from the amorphous phase to the crystalline phase. Now, how do we do this study? How do we use the study of DBS to quantify the amorphous content? We have different methodology and I'm going to show you specifically one of these methodology today. What we are going to start from is identifying a solvent that allows the calculation to happen. And then we are going to use that solvent to do the calculation. The first thing we need to do to do this method is to identify before crystallization and after crystallization. So have we. We need to identify a relative humidity or partial pressure that caused the crystallization, so we can study before it and after. So the first thing we always do is start from our sample and measure the absorption of the amorphous material. So you can see here the data that we collected for water on this specific amorphous sample. The red line is the amorphous material. But the material in water does not have any mass drop, which means that there is not any crystallization stage. The crystalline form of the material has very low uptake, and you can see it down here. But the material, when exposed to water, stays amorphous. Now we move to a second type of solvent in this case, because water is not allowing us to identify a stage of crystallization. So the second type of solvent that we study in this case is acetone. And this is the amorphous material exposed to an acetone cycle of absorption and desorption. And you can see here there is a very defined mass drop over 60% partial pressure. Now, what it's telling us this study is that at 30% partial pressure, the material is fully amorphous. And at 90% partial pressure over here on the right side, the material is fully crystalline. So we can easily identify a section of our data that is definitely foramorphous material and a section of our data that is definitely crystalline material. So we take a second batch of the sample and we do this same study focusing on these two values, 30 and 90. So here is how we run the experiment. We derive the sample, we move it to 30% partial pressure, and we measure the mass uptake at this condition. Then obviously in this case, the amorphous phase, then we move to 90% right here. And you can see that there is an identifying mass drop over here, which is identifying the fact that the material moves from the amorphous to the crystalline phase. And then we move back in the last stage to back to 30%. And here we measure the uptake of the crystalline phase of the material. So the delta, the difference between the 30% of the amorphous and the 30% of the crystalline is only due to the amorphous content of the material. So we can do this study for a reference material and we can do this study for the next section of our study. So the material after storage, the material after processing, and that will tell us exactly what's the change in amorphous content of that specific material. So there are pros and cons obviously on this type of study. So the pros are the fact that the method is extremely accurate. We can detect up to 0.2% difference between the two different material, reference and new material. So it's very repeatable, very accurate. It is reported in Pharmacopoeia as one of the methods to study amorphous content. Obviously we have two parameters that we have to define. We have to define a material as a standard. We pick one of our sample standards which we will use as a reference and the second condition that we have to find a solvent that causes crystallization. As I've shown you, in my example, water was not a good solvent for our study, we have to move to acetone. So a question will come from a point of view, which solvent should I pick for my study? And usually is related to how was your material prepared? You're obviously running with an amorphous sample and that sample will probably prepare with using some process of synthesis, could be crystallization and it could be for example spray dried material or also freeze dried. So the solvent involved in the process of synthesis of that amorphous material would probably be the one that also caused the crystallization. So the co solvent or antisolvent used on crystallization stages or on spray dried will be the first one to use for causing the recrystallization step. So those are usually the suggestions that we give look at the way the amorphous material was prepared and that will give you a suggestion what solvent you can use to do that same type of study. So the second example that I want to give you for you today is BT surface area. Now we, the previous presenter, both Dara Williams and Jurgen Ebb, talk a lot about BET surface area. I'm going to look a little bit on the theory, just a little bit to highlight the way we use isotherm specifically on gravimetric technique to study BT surface area. So independently of the type of solvent that you're using and the type of material that you're studying, the isotherm that you will get will be one of the one represented in this literature image the specific type of shape of isotherm is defined by the interaction between the probe and the sample that you're using. It's not defined by the solvent itself and is not defined by the sample. It's just defined by the interaction. The isotherm that can be used to study BET surface area are type 2 and type 4 isotherm. Specifically, because these two types of isotherm show that have a linear section, a linear plot in the lower region of the isotherm in what is called a monolayer region. So the monolayer region is defined in a partial pressure between 5 and 30 maximum 35% partial pressure in this region. Usually when performing a monolayer, the process has provided enough molecule to cover the surface of the material to form a monolayer. The reason why we are focusing so much on the monolayer formation is because by knowing the monolayer formation, you know the surface area of the material. The volume of the monolayer divided by the mass of the sample can tell you the specific surface area the sample itself. So why do we focus on type 2 and type 4? The reason why we focus on type 2, type 4 is specifically due to the fact that we are looking for linearity. We are looking for a linear plot. Why we care about linear plot? If we look at the equation of DBT surface area, which is reported right here, it looks complicated, but it's really an equation of a line. If you look at the terms here, y =mx +Q. So what we are doing really is fitting a line to the plot of an isotope. By fitting the line, we can measure this intercept and the stiffness of the curve. And automatically, by knowing the intercept and the stiffness of that specific line, we can measure the value of C, which my colleague had talked about before, and the vm, the volume of the monolayer by noise, C and Vm, we automatically know the specific surface area of the material. So this is very simply identifying what we are doing. We are taking the equation and we are trying to fit it in the specific region between 5 and 35%. So the more accurate is the fitting. So the. The bigger is the r square value, for example, that we always refer to. The better is the fitting, the better is the lineality, the more reproducible and the more accurate is the data that we are obtaining. I would like to point out the fact that in no part of this explanation we mentioned solvent. This process is the equivalent that can be used for organic solvent, for example octane cyclohexane that we usually use for gravimetric technique or it can be used for volumetric technique, for example from nitrogen. So the method is independent of solvent or gases, is dependent only on shape of isotherm and quality of fitting of data. So the focus that I want to mention is exactly this is not dependent on the sample and is not dependent on the solvent, is dependent on the interaction between the sample and the solvent and the way this interaction is manifested. Specifically, energy of interaction. If you think about a surface, that is, for example, the surface of your table is coated usually in polymer in resin. So the surface of your table will be usually hydrophobic. If you spread water on top of your table, which is hydrophobic. Now that molecular water will not spread as a monolayer will not try to coat the table as deeply as possible, but will form droplet. This is because the delta H of condensation, so the molecule will try to stick to each other rather than spread the delta H. The energy of interaction between the molecule is higher than the interaction between the molecule of water and the surface of the table. But if you think about for example, engine oil, if I spread engine oil on top of the surface of the same table, the droplet of oil will try to expand as much as possible to cover as much surface as possible. In that case, the energy of interaction of the molecule and the table is comparable to the energy interaction between molecule and molecule. And that's the reason why you get a linear plot rather than exponential plot. If we look at from a point of view of DDS data, here is an example of lactose. And we can see here the different plots of lactose with water, which is the blue line that is exponential because it doesn't want to spread on the surface. When we move to solvents that are less polar, for example methanol, ethanol, isopropanol, you can see that the isotope clot drops immediately and it becomes more linear. And it's showing you here that the interaction between molecule and surface of the sample is much higher compared to molecule and molecule itself. So that is basically the way we perform the study and the way we identify the solvent to use for this type of study. Now, between this presentation, I talked a lot about using organic solvent to measure different property of the material in a gravimetry technique. So how do we actually detect the presence of organic solder? Now, the measurement of water is fairly simple. We equip our instrumentation with humidity sensor which can be purchased are available on the market, which measure temperature and other property, for example thermal conductivity. And that's quite a reliable way to Measure humidity. Organic vapor are more complex to measure. Organic vapor have different vapor pressure and different reaction at different temperature. Consequentially, it's very hard to find a commercially available sensor that reads all the organic sensors that we need to measure in a reliable and repeatable way. We found it quite difficult to actually find a commercially available one. One so much so that we had to develop a specific sensor in house to measure organic solvent. And every one of our equipment measures organic solvent. Actually use this specific sensor that we developed, which is called speed of sound sensor. The speed of sound sensor measure time of flight of carrier gas and carrier gas plus solvent combination. So here is a simple example of how the solvent are measured in our instrumentation. Imagine the speed of sound sensor have a brass cylinder where you have an emitter and a transducer which are represented here by these two black squares. The emitter emits a sound that is bounced to the sound user. And we measure the time required for the sound to propagate from the emitter to the transducer. Very simple. That time of flight is measured for a carrier gas. And then we introduce a certain amount of partial pressure of a solvent and we measure it again. When we introduce the solvent, the time of flight changes depending on the concentration of that new solvent that we introduce. The change in time of flight is dependent on the change in density of the gas trapped inside the sensor itself. Now we are able to create a very direct calibration between the change of time of light and the partial pressure, the concentration of the solvent trapped inside the sensor. And that's the way we actually measure relative humidity, specifically partial pressure of different organic solvent. We have a series of of solvent that are calibrated specifically in our system. The calibration is always a binary calibration. So is a combination of carrier gas plus solvent. So you will see here we have air and nitrogen calibration for each single solvent. This is not a complete list. We have a full over 22 different types of solvent that is being calibrated and can be provided to you with our equipment. So the most common solvent that you will run in your lab, like acetone, cyclohexane, octane and isopropanol has already been performed. And we can run this calibration and you can run a very, very reliable experiment. However, there are occasions in which some of our customers might inquire to run different type of solvent that are not in our list. And we can provide calibration for these type of process. The interesting thing is that we are measuring density Basically, we are measuring a change in density, which is a physical property. So we do not need to do a specific calibration for each system. We can collect data of calibration on our R and D system and we can provide new calibration to every single user without coming and visit every single one of the equipment. By just sending a calibration file, we are able to update your calibration list and you can run new solvent whenever you want. So we're talking about a sensor that is very reliable that reads a series of different solvents. But obviously the question is how accurate it is in measurement. So here is an example of a common solver running a very specific condition. Just to show you something a little bit different, someone might say at 25 degrees Celsius might be simple to run. What about different temperature? Here is an example of a generation of ethanol at 50 degrees C. Here is a test not done at 0 to 90. This is what I would like to point out. It's done from 0 to 10. And here is how accurate we can go into the measurement of organic solvent. So here is a 2%, 3% step, but we can zoom in to do very, very small stages. So below 0.2% staging, we can actually measure small steps of generation. The other important thing that we can do with this type of measurement is obviously because we are measuring time of flight and it's a continuum measurement, we can actually measure it very quickly, which means that we have a constant feedback of the condition and the performance of the instrument all the time. The last thing that I would like to show you is application, an application of using single end up or component. So we said we can measure water and we have a sensor to measure water. And we also mentioned that we can measure organic solvent. So the DBS instrument also allows you to measure 2 water organic solvent or 2 organic solvent at the same time. So what advantage do we get out of this type of study? Here is an example of a single and a double component experiment. So we start from water absorption, sorry, we start from methanol adsorption. So here is a porous material, in this case a zeolite sample that we run using a DVS solution. The sample had been dried under nitrogen and we expose it to different level of methanol from 0 to 90% as a single component material. As a material perfectly dry. We can see here that the material have a quite significant uptake. If we look at the isoton plot, we get more than 12% mass change even in the first stage uptake so we can say that this material, in a perfectly dry condition without any humidity in the background, has quite a significant uptake in mass and specifically quite high affinity for methanol. Now, that's an ideal condition. That's the condition in which the sample had been stored under nitrogen and have been activated. It's not likely that that material will have the same performance when it's sitting on our benchtop after a couple of days. So what would be a more realistic performance of this same material, for example, using a little bit of water, let's say 10% of water, which is not really that much, but it's an idea of how the performance of the material change when we look at more realistic condition. So we start from the dry sample over here and we have two different lines. The green line is actually water. So the first stage here is we introduce water by self. And you can see over here the percentage of mass change jump from 0 to 60%. So most of the empty space inside this water material has been occupied by water. In the second part of the experiment, we start introducing methanol and we see here the absorption and dissoption of methanol from 0 to 90%. However, when you look at the mass change caused by the presence of methanol in the structure, you can see that the mass change is significantly smaller. We are talking about 2%. So the performance of the material and the affinity for the methanol had jumped from 12% to 2%. Mass change basically by just adding 10% of water. And this study can be repeated for this type of experiment can be very influential to measure, for example, change in surface area of standard material compared to a grid form, for example, or a porous material that has been exposed to water. So these are a few examples of application that we can use in a dvs, in this case using water, using organic solvent, and different types of that can be applied in this specific technique. So with this, I would like to conclude my presentation. I would like to thank you all for your kind attention and I would like to know if you have any question in regard to my presentation as well to the other presentation that have been shown today.
I'm going to ask you again a question myself. I was interested in looking at your presentation on the surface areas. I mean, do you use the DVS regularly for doing surface area screening? Because you can obviously use very low amounts of materials, which obviously makes a difference in terms of doing nitrogen bet.
To be honest, I think the standard is still using the standard BET instrumentation. But as I said, there Are many advantages using DVS or maybe also igz. What would be an options? I think in the future one needs to look more into those techniques.
Yeah, but again, if you've got a couple of grams of sample, then it's easy to throw it in a BT analyzed it with nitrogen, it's fine. But if you've only got 100 milligrams or whatever, and you gave a great example where the. The price of the material and the effort to require the material make some of the other options just not options. And I would have thought if you're trying to get. If you're trying to measure surface areas on a material in the early stages, when you only have a small amount of material, then it gives you an option you might not otherwise have.
I mean, for us, this was really a case study to see what's possible and how it works. And it worked really perfectly fine, surprisingly. But to be honest, this is a material with a rather high specific surface area. So that might make it simple.
It helped a bit.
Yeah.
I mean, yeah, we certainly running. I think we ran a couple hundred milligrams, but that was still better than using 2 grams.
Exactly.
Yeah.
And that was 0.3 meters per gram, which is at the low end.
I really see the benefits and the advantages, but yeah, the pharmaceutical industry is a rather conservative.
Okay, someone's asked a question around the BET equation. The BET equation is the standard equation which allows you to convert the amount of gas or vapor absorbed versus partial pressure and allows you to estimate the monolayer coverage equivalent when you've got a monolayer surface coverage. So if you just did a Google on BET equation, Wikipedia, you get a nice explanation on how that works. So probably that would be. Probably. Probably do a better job of it than I will. So B2, ask us, in the IGC experiment, how do you vary the service coverage? So we vary the surface coverage. I mean, we vary the surface coverage by changing the injection size. Okay, so that's just. It's a little more complicated than it seems because obviously when I inject, you know, one millimole of material, for example, the vapors will preferentially attach themselves to the higher surface energy sites. And when I inject 50 millimoles, I will sample a bigger area. So essentially we're skewing the sampling of the surface by changing the number of molecules are injected. So we're getting an equivalent surface coverage. It's not, you know, the word surface coverages is used in a slightly more complicated term here, but it's an equivalent Surface coverage. Not an exact surface coverage, a dynamic experiment. So it's not quite the same. That was a slightly vague answer to a complicated question, but hope that's okay.
I do have a question for you again. Actually, just quickly. One of the slides that you presented was showing powder XRD data for different series of hydrates. I was wondering, did you a different level of humidity? Was it the humidity generated in C2 or did you generate in a DBS and then took it to the powder xrd?
No, it was an humidity generated powder cell. So I mean on the. You have various humidity controlled equipment on the HRPD stuff and is that the main issue? Yes.
Yeah. So we've had a question from Barath who's asked us, can we use surf energy value to improve uniformity? I think we need to be clear what we mean. Uniformity. If you're talking about, I mean in broad terms, yes. If you're trying to maintain uniformity of energy, then absolutely. If you try to measure, if you're looking at uniformity in terms of powder mixtures, it could help you. Clearly uniformity of powders is to do with particle adhesion and measurements of energy. Could be a tool to help you produce more uniform powder blends.
Have you tried like you know, choosing a drug or any material which has, you know, low mixing ability and based on surface energy values, could you improve like powder uniformity? Have you tried that?
Can we.
I haven't, you know, yeah, I haven't done that personally, but I have seen some data from some collaborators and I have seen people do that sort of thing for different powders and mixing them. And in fact I haven't got any data to show you at the moment, but I'm running a project with one of my PhD students and we're specifically interested in powder mixing and the relationship between surface energy and powder mixing behavior. So probably very soon Alina will start to be sharing some of her data. So that might help you very, very specifically.
Yeah, because most of the times like if you are working on low dose formulations and you will have issues on blend uniformity. So based on surface, if we get to know the surface energy of the drug molecule, like can you suggest like appropriate excipients that would.
Yeah, yeah, that's a really good question. And I think in it, personally, if you were sitting down saying right here I've got this active with these properties and I've got these five different excipients, which one is most likely to give me a good dispersion? I would think that the IHC dataset would be one. I mean, what information would I like? Well, from a fundamental perspective, I want surface area and I want surface energy. They're the first two things I want. And I think if you had those data sets, I think that would be a really helpful way of having a good go at predicting the best formulation.
Do you guys have like any database on regular excipients, surface energy values for regular excipients?
Nope, I don't. I'm not aware. I mean, I know researchers are characterized excipients, we've characterized some. But if you head to me, is there a database I can point you out where all that data lives? Sorry to say, no, I'm not aware of a database of that topic of that type.
I think it's also critical because you have so many different qualities of the excipients. It might be really. And sometimes you have lots of variability.
So I think, yeah, I was looking at most.
Things. You know, there's a lot of very. There's a lot of properties you'd want to measure to have a shot at it. But it would be a good idea to have that sort of intelligent database with the right, you know, particle size, particle shape, hydrocarbon surface area, surface energy, other bits and pieces would. Would be very helpful, but I'm not aware it exists. I think, I suspect a lot of companies have their own internal databases for their own internal use, but I expect that's not in the public domain. So someone's asked a question here on the mannitol study. Is it possible to tell the surface energy of each facet, like concentrate angles? Sadly, no. So the IGC determination gives you a statistical average for the powder sample you've got, but the conduct angle gives you the energy for each crystal facet. And the only way you can get the information for the specific facet is, is from contact angles. But the. If you want to measure the distribution of energy, you get that from the ogc, but you can't get the facet energy from the ODC experiment, I'm sorry to say. And Akshan said, can we calculate a surge area of power to having a value of more than 100 meters per gram? You could be quite on. If you've got a material that's got more than 100 meters squared per gram, you're probably easiest to go and do with nitrogen. To be really honest, the benefits aren't great. Although of course if you don't have much material, then you might want to consider the techniques I described today. Is it any more Accurate? Probably not, except if you've got a very small. So if you're going to do bet, and the answer is I'm going to use 2 grams of sample and you've got 2 grams of sample, then bet is fine. But if it turns out you've only got 50 milligrams of material, then obviously the BTU technology may not be that much accurate. And the new techniques you heard about today might be better. Yes. So DVS or the SEA technique could measure surface area for low amounts of sample. That's probably where the benefit is not. It's not necessarily more accurate. But if you've only got 50 milligrams of sample, you aren't going to get that in the BT analyzer and get good data properly.
I think it depends also what you want to do with the measures. Typically you use these PET measures just to put it in your analytical result sheet, but if you want to take some information out from it, I think the charm here is that you can get data under unbiased conditions, which makes a difference compared to the classical determination. And I think, yes, it depends what you want to do with the results at the end. And there might be also some cases where you think, okay, the DVS or IGC result might be more reliable, with respect what we observe on the process conditions.
Because that's right, as Jurgen makes very clear there. I mean, you're measuring the surface area at room temperature and in some cases at room humidity. And that's not what you're doing with nitrogen. And for some materials, the operation of 77 kelvin under vacuum isn't maybe going to be a runner. Jurgen, I was going to ask you if you had a hydrate in one that measures surface area, how would you do that?
You ask how I would do it or how it is done?
How is it done?
Yes, how it is done. It's using the classical pet and then you tell this value as the value of the hydrate, which is scientifically wrong, because what we would expect is that the hydrate won't be stable under those conditions.
There's no hydrate lift.
So then you should use a different technique. But that's what I said. What is the value? What is. What do you do with the BT value you generate? And typically it's just a number and it's. The people don't ask what it's standing for. And if you use it more to.
Understand formulation performance or to. It's not used to engineer the product, what you're saying, it's just a data for repository.
Exactly. Just to compare lots, to see are there differences in lots. But I think you can get more out of this data. But then you need to use the right technique.
It's interesting that you point out the fact, for example that in your specific study you were showing four different type of hydrates. And if you do a pure and you are probably, well, your team will probably characterize them as much as possible. But then in the surface area box will have only one single value identical of four of them.
Even though to be honest, during the solid form landscape screenings then you have only a few milligrams of material typically and then we don't analyze the bet for those values. The bet is typically analyzed or measured for material for the selected solid forms when you have process development steps and things like that. So that's at a later stage. And to be honest, typically we don't want to produce hydrates. We try to have anhydrous forms.
But you get hydrates for free, don't you Jurgen?
Yes.
They don't charge you any extent of getting a hydrate. Yeah, we've had a question here around is the surface energy sufficient to understand API exhibit interactions? So there are three or four things I'd like if I was doing this problem from first principles. There are three or four bits of information I would like to have. I'd like the surface area of the products, I'd like the surface energy and I'd like the components of the surface dispersive and long range surface energy. So I'd like that if I've got excipient, I'll be concerned that some of them are amorphous and if they're amorphous I'm going to want to know about the amorphicity and I got to know about the TG or the glass solution temperature of those materials. And obviously, you know, particle size distributions also going to come into play in terms of some of the contacts. So there's some of the things I would like. So energy is just one thing that you would need to give you a chance. It's not in itself, it's not sufficient.
So there's a question for me in regard to use of multiple solvents, the incorporation of both organic or inorganic solvent could affect the data. So this is a point of view of developing a full study. It's never a single experiment that will tell you the answer. Specifically, when you're running organic solvent and water or two different organic solvent, the starting point is always we start from single component. We do the full sorption and dissorption of the single component. So it could be water by itself, could be methanol by itself, and then we introduce two components in different ratio. From the point of view of the dds, you are analyzing mass change, which can give you information in regards of the shape of the isotherm, the amount of solvent uptake, because different solvent will have different uptake and different isotherm shape. The other thing that I would like to mention is that because it's a comparative study, the more technique you can add to this type of study, the better it's going to be. The more refined it's going to be the result. We will have a workshop in regard to multi component absorption and DBs. And most of the time when we try to do multi component absorption, we also associate a Raman study. So we do single component absorption, we collect the Raman spectra with a single component, we see how the material behave with one component and then we follow it. When we add two components at the same time and we try to identify with a spectroscopic technique and a gravitational metric technique which one of the two solvents are interacting the most. It will never tell you exactly how many molecules and where they are. It will be we are measuring the sum, so we are measuring a total effect, but it will definitely tell you which one of the two is affecting the most, the mass change. And we have seen positive data from both DVS and Ramana Cell to actually follow this type of characterization. I don't think there are any more questions, but in case you have any more questions or you require any more information, you can always contact us@scienceurfacemeasurementsystem.com and if you want information about this presentation or any future workshop that we are going to run, I would like to thank Dr. Jurgen and Professor Darryl Williams for the participation to the workshop and everybody that participated to this event. And thank you again.
Okay, bye bye everybody.
Bye bye.
More from Prof.

Webinar: Advances in Measuring Gas and Vapor Permeation Through Membranes and Barrier Polymers

Webinar: Determining Solubility Parameters of Bacterial Cellouse Through Energy of Adsorption

Online Webinar: Recent Technological Advances in Adsorption Based Direct Air Capture

Online Webinar: Surface Area of Pharmaceutical Ingredients at Real World Conditions by IGC



Hybrid Workshop: Measuring Material Vapour Pressure Properties Using Advanced Sorption Technique

PCL Hybrid Workshop: Recent Advances in the Characterisation of Pharmaceutical Powders


Using Advanced Techniques to Test the Performance of Recycled Bathroom Tissue | A video summary
