Webinar: Comparative single solvent & multi-solvent sorption studies using DVS & Raman spectroscopy
Prof. Damiano covers Dynamic Vapor Sorption paired with Raman spectroscopy to measure how materials absorb solvents. DVS uses a microbalance and continuous gas flow for faster, more precise results than static methods. Examples include rice showing 20% water uptake, zeolite blocking methanol, and titanium oxide absorbing hexane and butanol differently.
Chapters
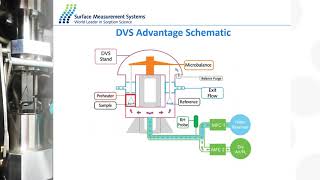
Today I'm going to show you a few examples of CO absorption study done on dbs. The presentation will be divided into different sections. We are going to start from a brief introduction on DBS and how the instrumentation work, how we collect data using dbs. Then we are going to move over to diffusion and permeability study done with a single solvent and then with multi solvent. Because we are talking about solvent application. We're going to look at the ET surface area application and in the last section we are going to focus specifically on in situ RAMWAR technology. We are going to start with how does the RAMR setup and work in a standard experiment. And then we are going to finish with an application study that use DBS and Raman to study CO absorption on a sample of titanium oxide. So from a point of view of the functionality of the instrument and from the point of view of how we collect data on a dbs, picture the process of absorption and desorption as an interaction between the surface or the bulk of the sample with a series of gas molecules. In this case, for example, we can take water as our reference probe. The molecule of water can interact with your sample in two different ways. They can absorb on the surface of the sample or can absorb and then penetrate through the bulk of the material and then absorb. The process of interaction between this molecule and the material can be reversible or irreversible. Which means that when we reduce the amount of molecule on the surrounding area of the sample, the molecule can leave the sample or they can stay trapped inside it. Now we're going to focus specifically of these two definitions because they're going to be useful to define process that we're going to describe during the presentation. More specifically, we are going to talk about adsorption and absorption. So when we look at adsorption we are talking about two potential phenomena. We can talk about physisorption or chemisorption. A physicorption process is usually a weak interaction between the molecule that we are introducing and the surface of the sample. Because it is a weak interaction, it is usually a reversible process. So whenever we drop the concentration of molecule, automatically the molecule will be removed from the surface of the sample. This process is actually particularly interesting for us because it gives us information about the surface of the sample. Surface area, pore size, surface roughness are all calculated using surface options. Specifically, other interaction like heat of absorption and free energy characterization are also done when the probe molecules interact only on a surface level. So as a physics option, now the second type of interaction that happen on this surface is chemisorption. And when we are talking about chemisorption, we are talking about strong bonding, a very strong interaction. Usually it's covalent. For that reason it requires energy to form, but it also requires energy to break. And that usually identifies the process as irreversible. It can potentially be reversible, but is usually irreversible. And these identify specific type of material that are designed to interact with the molecule that we are introducing. So we are talking about active surface area or catalyst dispersion. They are designed to interact specifically with the molecule that we want to study. Moving on to the phenomena of absorption that happen not only on the surface, but also on the bulk of the material. We have two potential phenomena. Bulk sorption, in which case the molecule not only pile up on the surface, but also penetrate through the bulk of the material. Now, whenever there is a phenomena of diffusion, the desorption process is limited because the molecules don't only dissolve from the surface, they have to migrate from the bulk to the surface and then they can dissolve. So the process is lower. It's usually reversible or irreversible. That depends on the type of interaction, but it gives us more information in regards to what happened to the bulk of the material. Now, every phenomena that is related to glass transition, crystallization, the liquefiescent points happen in the bulk of the material. The molecule have to go through the bulk of process. So measurement of diffusion coefficient, which we are going to talk about during this presentation. Solid, solid phase transformation. So glass transition and crystallization and drying kinetics are all typical of study of bulk sorption. The last type of interaction is very specific, is the absorption into the lattice structure. In this case, the molecule penetrates through the bulk of the material and causes a structural change in the sample. We're talking about starting from a material that is an iris and then moving to a hydrate. And if we are introducing an organic solvent, we are usually talking about a solvate. Now again, the process can be reversible or irreversible. But we also add an extra definition here, which is stoichiometric. If we can count the number of molecules that goes into the structure per molecule of sample. So we call it hexahydrate, for example, or hectahydrate. We know how many molecules go in. We usually define it as stoichiometric. If we are not able to identify the number of molecules that are trapped inside the structure of the final product, then usually we define it as non stoichiometric so those are the type of definition that we are going to use during this presentation to identify the type of absorption that can happen between a molecule and the surface of the sample or the bulk of the sample. So the question is, how do we collect this type of data? So a dvs, which is a dynamic vapor resolution, is a gravimetric technique. And I'm going to use and the definition to actually identify how the process of development of DBS started. So the base concept of a DVS started from a jar method and then developed to a dynamic vapor absorption method. And it's all based on measuring mass change when exposed to different level of humidity when a sample is exposed to different level of humidity. So we start from an historical method which is based on using desiccator to identify how many molecules of water will absorb inside a sample. So in a series of desiccator, I would put at the bottom of the desiccator a series of salts in a saturated solution that generates a constant level of relative humidity. So I will have lithium chloride that generates 11%, sodium chloride that generates 75%, and so on and so forth. I will then move a sample of known mass inside the desiccator and I will wait for a couple of days. After a couple of days, I can remove the sample, put it on a balance, read the mass and put it back into the desiccator and repeat the process until my mass reading becomes constant. Every single desiccator reads a constant relative humidity every and also gives me a mass change per each point. And that allows me to build up an isotherm. A DVS process basically work exactly in the same way, but we measure the mass and the generation of humidity constantly. So we have a micro balance installed in the system that constantly read the percentage mass change. And we have a series of valves that generates the required relative humidity to perform the experiment. So the difference between the two method is obviously related to a series of changes that allows us to collect data much more accurately. The first difference is obviously the mass of sample required. Whenever we are looking with a manual method, we usually use grams of sample. The higher is the mass, the more repeatable is the experiment. However, in a DVS, we are allowed to use a micro balance. Consequentially, we can use milligrams of sample rather than grams. Now, the difference is not only on the fact that the amount of sample uses is different, but also the way the equilibrium is reached is different. In a jar method, we're talking about a static process. The molecule diffuses inside the desiccator from from the air to the sample. While in DVS we use a constant flow of carrier gas, about 200 milliliters per minute of nitrogen or air that carries the molecule of water on the surface of the sample and allows for the absorption. So the difference is not only in amount but also in the way the equilibrium is reached. And the time required for this sample to reach equilibrium makes a big difference. The other parameter that we have to consider is contamination. Whenever we have to study a sample in a jar, we always have to remove the sample from the jar, expose it to potential different level of humidity, put it back into the desiccator. Consequentially we are exposing to a different level of humidity. Some user might do it more quickly than other. That creates a systematic error in the measurement. In a DVS we never touch the sample. We put the sample inside the system, we start the experiment and we only remove the sample at the end of the experiment. So there is no human interaction required for the collection of the DVS data. Here is what for example a kinetic plot. So a mass change over time over partial pressure for a specific sample is collected on a DBS and we can see it takes about 6,000 minutes. The same sample collected on a jar method takes about 300 days. 300 days versus about 4 days. That's the difference in time required. The other important difference here is that on the left the plot only show absorption. It does not show the desorption data. Because we are not able to reduce the humidity using a desiccator, we can only increase the humidity from a point of view of from a dry sample to a wet sample. In a DVS we can do absorption and desertion. In that way we can measure the full isotherm. So when we plot the partial pressure versus relative beam. Sorry. Versus mass uptake in a jar method, we only have the curve up the absorption. While in a DVS we add the absorption as well as the desorption. So we can also measure the hysteresis information. So this is technically how the DVS was developed. And this schematic will help me explain how a normal experiment work from a mechanical point of view. I will start from the explanation from the bottom right hand side over here. Where we have what we call two reservoir system. In reality, one of the reservoir is your carrier gas, your dry air or nitrogen. And the second reservoir contain water or organic solvent. We have two reservoir connected, then two mass flow controller, two valves that generates the required amount of mix between what we call wet, so the headspace of the water reservoir and dry, which is your carrier gas. So for example, let's say we are drying our sample, we require a wet condition, so sorry, a dry condition. So what we are going to do is the master controller of dry will be 100% open and the maslow controller of the WET will be 100% closed. If we require for example 20% wet, for example, we are doing a 20% relative humidity stage. What we can do is the mass flow controller wet will be open of 20% and the mass flow controller of dry will be open of 80%. The flow of the two mass flow controller will meet in the middle, will be read by a sensor that reads the concentration of water, the relative humidity and then it will be pushed into the system, into the two chambers, the sample and reference chamber, which are two metal pan connected via handheld wire to a micro balance on the top. Now what you see over here basically is the dynamic process of two plated balance. Imagine an old pharmacist balance and we have a sample side on the left side and a reference side on the right side. And the system is perfectly symmetrical. There is no difference from the sample to the reference side. It's the same path, the same end and wire, the same chamber. The only difference between sample and reference size is the fact that there is your sample in their sample size. Why do we make it symmetrical? The reason why we make it symmetrical is because we are trying to measure mass change microgram related to surface of bulk solution of the sample. But we are doing it in a very simple way. We're just pushing molecule of water inside the chamber and molecule of water cannot be controlled. They will absorb everywhere. They will absorb on the sample pan, on the endon wire, on the chamber itself. So we don't want to measure the mass change related to the pan or the ender wire of the chamber. We only want to measure the mass change related to the sample. So what we do need to do is make the system symmetrical. Because if molecule absorbed on the pan on the left side, it will absorb on the pan on the right side in the same way. So automatically they will cancel each other. As long as there is a sample inside it on the left side, we will measure a mass change. If there is no sample, there will be no movement recorded in the balance. So that's basically how the DVS process mechanically work. How does the data collection work? So here is a very simple schematic experiment of drying process and then absorption and desorption. The Most simple experiment that you can do in a dbs. So we put the sample into the sample site, we dry the sample and we record an initial mass. And then we step up the humidity, let's say 10%. And we wait for the mass to reach equilibrium right here. And then we move to the next stage and we wait for the mass to reach equilibrium. We move up from 0 to 90, back to 0, and we measure the adsorption and desorption. We take each point of equilibrium of the kinetic plot and we plot it against relative humidity and we get the isotope plot. So how would the data look like when we actually look physically at the data? So this is an experiment done on a sample of rice and is a two cycle experiment of absorption and desertion. So in red, right here you have your mass and in blue you have your relative humidity. And if we look at this process, we have an initial drying curve which is repeated in the second cycle. We have a full absorption and a full dissolution. And this cycle is repeatable right here. So this experiment was collected at 25 degrees Celsius. The information that we get from this set of data is basically that every stage is reaching equilibrium. In fact, the mass flats out during the equilibrium stage. The material have a quite high bulk solution because we are recording about 20% mass change. And the sample is repeatable because we start from zero, we go back to zero every single time. So if we take each point of equilibrium and we plot it against the relative humidity, we get this isoton plot which shows a red line for the absorption cycle and a blue line for the desertion cycle. We have a nice gap of hysteresis in between. Now these data are giving us a little bit more of information in regards to the property of the sample. It's telling us again that the sample is reversible, that the sample has a very, very high affinity for water, which causes over 20% mass change. And also telling us there is a bugsorption gap here. There is a nice hysteresis gap here, which means that the molecule will come in and then they will have to migrate out. They require more energy during the desorption rather than absorption, which means basically that there is a bulk sorption phenomena here. I need to provide more energy for the molecular water to come out of the sample rather than during the absorption stage, which is the initial line over here. So this is nice set of information. And the other set of information that we can get here is that our material is very, very stable in presence of water. In fact, we can do this cycle as many times as we want. And we can always go back to the initial condition of the material because there is no transition. So this is a very, very simple experiment. Now we are going to talk about different type of applications. So the first experiment of application that I'm going to show you today is a study of diffusion and permeability. So I'm going to give you an example of how we usually study diffusion and permeability with a single component. And then I'm going to give you an example of a multi component experiment. So diffusion, the experimental diffusion can be carried out on different type of material, but on also in different shape. We can measure diffusion on a membrane, we can measure diffusion on powder, and we can measure diffusion on fibers. The diffusion requires an two part, two things to be carried out. The first one is the fact that we need to know the travel distance of the molecules. So for the calculation of diffusion, we require to measure for membrane, the thickness of the membrane, which can be measured with a caliper, the average thickness of the membrane. For powder, we usually use the average particle size of the powder. And for the fiber, the radius of the fiber itself that can be used. And the experimental diffusion is extremely simple. We start from a drying point and then we generate a constant level of relative humidity or partial pressure. If we are using an organic solvent and we wait for the sample to reach equilibrium, and we measure basically the initial uptake and the uptake at equilibrium stage. And we can do this experiment at different partial pressures. So we can do 20, we can do 40, we can do 60% at a constant temperature, obviously. So if we look at these data, for example, if we take the stage at 20%, we can easily calculate the diffusion on the thin film by measuring the initial uptake here, which is basically the mt, the mass uptake at the initial condition and the uptake at equilibrium condition, which is M infinite. We know then the distance of travel by knowing the thickness of the membrane. And then we can calculate the diffusion coefficient at 20, 40 and 60%. So this is a very simple, very straightforward experiment with a single component, in this case only water. The permeability experiment require an accessory or require a pre preparation of the sample. The permeability for example, on blister packaging material is fairly simple to perform if you have access to a blistering machine. So what you will do is load a drying agent inside the blister packaging and have your film that you want to study on the outside. We will dial up a constant value of relative humidity 2040 or 60%. And and we will measure the mass uptake over time. And the study of permeability is fairly straightforward. Now obviously not everybody has access to a blistered packaging material. So we can provide a pencil which is an accessory that can be purchased with the dvs that allows you to cut a piece of membrane and encapsulate it in a metal cell, load a drying agent at the bottom side of the cell and measure the diffusion and pair maybe on one side of the membrane itself. So very, very simple, very very straightforward experiment. You will have a disk basically of your membrane that is cut to size. It will be squeezed between two oring and will be encapsulated in these metal capsule. We use a drying agent to maintain and cause the relative humidity in the inside of the cell and then we measure the uptake from the outside. I'm going to use this diffusion pencil to show you an example of a multi component experiment. In this case, this study has been done on Kapton tape. And what we are doing is loading Kapton tape in diffusion cell and measuring the uptake with two different solvent in two different temperature. The experiment we carried out is designed in this way. This study is on captain tape to measure methanol absorption by salt and metal absorption in presence of water. So the experiments start from the first stage is measuring only the green line which is the absorption of methanol by itself. Then we are going to add water by itself. And in the last stage we are going to have methanol plus water. So the percentage that we are using is in the first stage we are going to have only 50% of methanol. The second stage will have only 20% of water. And in the last stage we will have 50% of methanol plus 20% of water. So this is the experiment done on captoctape. At 25 degrees Celsius we measure the diffusion of methanol, 50% of methanol, the diffusion of water, 20% of water and the diffusion of methanol plus water which is the last stage over here. And you can see here that there is quite a similarity between the diffusion of methanol and the diffusion of methanol water at 25 degrees Celsius. When we repeat the same experiment and we changed the temperature at which the experiment occurred, you can see that there is a drastic change. So methanol by itself has no difference. So the uptake of methanol is more or less very similar independently of the temperature which we are performing it experiment. However, water you can see is almost double the diffusion rate throughout the sample. So at 20% is very increased. And if we look at the last stage again at 45 degrees Celsius, there is a significant increase when we use methanol plus water. So methanol by itself does not have any change in relationship to temperature change, but methanol plus water actually has a different change. And this is probably because water is helping the glass transition phenomenon and helping methanol going through the membrane of the sample itself. And obviously we can calculate the diffusion parameter of each component at each temperature and then the association of the two components at each temperature. So this is a simple example of a single component study and a multi component study. So I just introduced you to the concept of using organic solvent. One of the examples is diffusion. But another example of a study that you can run with organic solvent is the measurement of the surface area of the sample. So how do we measure surface area on a cravimetric? The measurement of surface area is very similar to the process that we you will usually use on a nitrogen suction. So a volumetric system, it uses an interpretation of the isotherm plot. So here is graphic of the reported literature isotherm that you can obtain when you expose a material to a solvent. No matter what solvent it is, the isotherm will look like one of these six. To calculate the bet surface area, your isotherm actually need to look like a number 2 number 4 isotherm. The reason for this requirement is the fact that these two isotherm are the only one that are showing a linear plot in the region between 5 and 30% in the lower concentration of partial pressure. Why do we need a linear plot in the lower region of our isotherm? Because the isotherm, the BT surface area calculation is a fitting of a line to your isotherm itself. What we are doing is trying to fit a line to the point of your isotherm in the lower region of your isotherm itself. What you look here is the equation of the bet surface area, which looks complicated, but if you look at the terms that we are looking at, this is basically an equation of a line. You have y equal mx plus C or plus q. So what we are doing is fitting this line to your isotherm plot and identify the value of C, which is the constant of absorption and the vm, the volume of the monolayer. Once you know the volume of the monolayer. If you think about the definition of a monolayer, you know the volume of your monolayer, you know the molecule that you are using to form that monolayer. So you automatically know the surface area of the sample. You know the initial mass of the sample. So you can divide the surface area by the initial mass and, and you can get the specific surface area of the sample. So what we are really doing is basically taking our isoton plot, trying to fit point in this region and check for linearity. The more linear is the plot, the more accurate is the measurement of the surface area. And that's what our calculation usually look like. You see, we take points between 5 and 30 maximum 45% partial pressure. We fit a line in between, we check that our R squared value is as close as possible to one. And then automatically we can calculate the volume of the monolayer, the constant of absorption. So automatically we know the specific surface area of the sample. And this is very repeatable. It's basically the same performance and the same type of calculation that you will use gravimetrically and volumetrically. No difference from that point of view. So what defines the shape of the isotherm? Why would an isotherm will be linear and some other isotherm will be nonlinear? The type of isotherm that we obtain depends only on the interaction between the solvent that we use and the sample that we pick. It's not dependent on the solvent itself. It's not dependent on the sample itself. It depends on dependent on the interaction. So if you think about for example, a polymer material, a polymer material usually does not have a very high interaction with molecular water. Water will rather aggregate, form, droplet because the delta H of condensation is higher than the delta H of absorption when we put water on top of it. But if we put something like octane or cyclohexane, we which is non polar or less polar than water and automatically it will try to spread on the surface of a pointer rather than aggregate. So the delta H of absorption is much higher than the delta H of condensation. So here you will get linearity, here you will get an exponential plot. And that's basically the definition of how an isotherm takes shape. It's not due to the solvent and it's not due to the sample is actually due to the interaction between the solvent and the sample itself. To give you an idea of this type of interaction, here is an example using lactose, you see here the molecular water, the absorption of water is clearly exponential. So obviously we cannot use the data of water to measure surface area because it's clearly a type of one isotherm. But if we move to Less polar solvents. So methanol, ethanol, isopropanol and butanol. The isoterm drops and automatically you can see there is a linearity in our plot. And we can use this data to calculate the surface area. So we are talking about using organic solvent to measure the property of the material. I haven't told you how we measure organic solvent for this type of characterization. So obviously we needed a sensor that allows us to measure a concentration of a different organic solvent in the presence of a carrier gas. We couldn't find one on the market, so we developed one on our own. And our sensor, which is called speed of sound sensor, actually use time of flight. Use the time of flight of a wave that we bounce between an emitter and a transducer. And what we do measure is the time of life of a carrier gas and a time of life of a carrier gas plus solvent. Obviously if you think about the presence of extra molecule in a chamber, automatically you will imagine that in introducing more molecule of a solvent with increase the time of flight, which consequentially can be measure and retro calibrate it. So what we do to measure the concentration of organic solvent is measure the time of flight of a carrier gas. And then measure the time of flight of a carrier gas plus solvent and use that change in value to calculate the relative humidity or partial pressure of that specific solvent. Now by using this process, we build up a series of calibration for for specific solvent plus carrier gas completion. So we have octane, non and acetone. We have about 22 different organic solvent that we can use in different combination with our specific carrier gas to perform our experiment. Again, this is not a limited library. We can always expand our library in our system and we can use it to collect more data and run more experiments. So we can provide you with a full list of solvent that we can use in our system. But we can also provide you extra calibration for solvent that might not be part of our library if needed. So let's have a look at an experiment entirely performed in organic solvent. So this is a methanolsorption on a porous material, in this case a zeolite. What we are doing here is exposing the material to methanol. And we are doing a full sorption and desorption. So what we are looking here is a microporous material that has a high surface area and high ability to capture methanol. As you can see over here, the material has about 12% mass change as soon as we expose it to methanol and then the material maintain a high capacity. When we are looking at this material, we are looking at the material as a dry form. So it has been storage under vacuum, has been perfectly dry, and then we do the full experiment under nitrogen. Those are defined as the ideal condition, the perfect condition in which this material can perform with a higher capacity of absorption. However, whenever we purchase this material from a provider, it's not provided under vacuum, it's not provided as activated form. It will be present as a certain amount of water will be trapped inside the material. So we wanted to simulate also what's the difference in the uptake of this material when it is exposed to water. So the next stage, the next experiment that we did was take the same exact material, dry it in the same way, which is the initial condition over here. The first stage that we did, which is this green line over here, is, is exposed to 10% relative humidity. And in this case what you see here is the mass of the sample increases to 16% mass change. So most of the surface area of the material is actually occupied by water. As soon as we put it in, only 10% of water takes away 60% mass change on the sample. When we actually introduce methanol, which is the blue line that you see over here, our sample only uptake about 2%. So this is an example of a CO absorption or two component absorption experiment in which we start from a material that by itself can uptake about 12% mass change. But then when we introduce water, we actually have only a 2% mass change available for the absorption of metamorphosis at that really helps you understand the difference between a theoretical performance of a material like this and a more practical performance of a material during an application study. So I'm going to move towards the end of our presentation talking about the Raman and the Raman application for a CO absorption study. So how do we perform Raman experiment? The data that I'm going to show you right now has been collected using DVS resolution which allows us to perform experiment with water, organic solvent, water plus organic solvent, or 2 organic solvent at the same time. And this is what I'm going to show you right now. Moreover, this system also allows you to associate the machine with a separate Raman spectrometer that allows us to collect a spectra of the sample at the end of each stage of the experiment. And how do we do that? We have a Raman probe that is mounted on the chamber of the DVS that allows us to measure and collect the Raman spectra directly from the pan of the dvs. So what we do basically is collect the DBS data, wait for the sample to reach equilibrium and then the software automatically trigger the collection of Arama spectra at the end of the experiment. Very, very simple, but allows us also to follow potential transition or potential change in structure of the surface or the bulk of the sample. So let's look at this experiment from a simple point of view and then we're going to look at the CO absorption study. A very simple experiment that we can do is something like this water absorption on a food sample material. Here we start from a dry, not a dry condition, we start from a storage condition, which is this material is usually stored at 50% relative humidity. And we are doing here a two cycle experiment. We are doing an assertion and a desertion and we are repeating the experiment twice. And what we want to see is, is the material reversible and can we see any different change in the structure of the material? So from the TVS data we can see that the material is perfectly reversible. We can do an absorption, desorption, absorption and desertion. No change changes from that point of view. Does the Raman give us any extra information? So we can collect Raman spectra at each partial pressure stage, as you can see over here, and obviously we can overlap them. So what happens if we overlap the initial stages of the experiment? So any stage that we look at here that contains water, as you can see from the Raman data, there is a perfect overlap with all the Raman spectra whenever there is any residue of water in the sample, which is quite interesting. So it means the material is very stable whenever there is water presence. If we look at the data at the end of the drying stage. So at the end of this stage. At the end of this stage, however, we actually notice that there are shifts, specific shifts in the Raman spectra itself. Now this is quite interesting specifically for this manufacturer, because if they want to know if their sample is perfectly dry, they don't need to wait hours and hours and hours. They can just collect a 30 second Raman spectra of the sample and know if the sample contains any residual water or if the sample is perfectly dry. But just simply look at the position and the presence of specific peak in the Raman spectra. Now this is a very simple experiment. Now we're going to have a look at a more complex study on coabsorption. So the experiment that we are going to carry out here is on a single sample, titanium oxide. And what we are going to do is water absorption by self with the Raman data. X insorption by self. With the Raman data, butanolsorption by self. And then we are going to do a study of 50, 50 and 8020x and Butanol. And we're going to look at the DBS data and the Raman data itself. So let's start from water. So our sample absorbed about 5% mass change. It has a fairly simple absorption and desorption and is not reversible. As you can see over here, there is a small residue of water trapping the sample at the end of the experiment. The total uptake is about 5%. And I'm gonna refer to this 5% later because it tells, it's gonna tell me information about the stability of the sample and if our data are correct. So if I look at the isoton plot, you can see here there is a nice gap of hysteresis in the center area. There is a little bit of linearity in this section. And this is my gap of hysteresis at the end of the experiment. Now if I look at the Raman data collected during this experiment, the first thing that I can notice is that the spectra don't show any specific change. So Raman, the DVS uptake is about 5% and the Raman data show only a shift upwards of my Raman spectra, but no generation of new peak, no shift in the position of existing peak. So the Raman data are not particularly interesting whenever we look at the water resolution itself. Now we are going to move to single component organic solvent experiment. So here we have exane and as you can see here, the mass change is particularly higher compared to water. It's about 13% mass change. And the small hiccups in the mass reading that you see over here are actually the Raman data. The Raman comes on and shines a laser on top of the sample which can locally heat up the sample and potentially reduce the mass locally because the sample is locally drying up. So here we have a study of full absorption and desertion. Exon is perfectly reversible. It goes back to the initial mass and it has about 13% mass change. And the isotherm change looks like this. So it's perfectly reversible. It has a gap of hysteresis in this section, but it goes back to the initial value. If we compare it with butanol. This is your XN in blue and your butanol in red. What you can see here is the fact that butanol has a much higher uptake about 16% mass change and it is non reversible, so it doesn't go back to the initial value. And if we look at the isoterm plot, you can see here that exane sits over here. Butanol has an initial uptake right here. So monolayer formation and then a multi layer formation gap of hysteresis right here, 14% mass change and chemisorption at the end. So what you can see here is basically that the sample has uptake butanol and it doesn't release it. Butanol stays on the surface of the sample. About 3% of Butanol is trapped in the sample at the end of the experiment right there. So what happens if we look at the Raman data? So here is the databutton which we said doesn't change, is constant no matter how much water we put in. Here's the data at the end of the absorption of butanol. So you can see here that there are shift is in position of the peaks that are appearing on new peaks, especially in the aromatic region. And Hexen is particularly interesting because it gives very very intense peak, the generation of extra peak compared to butanol, especially in the aromatic region, but also in the lower Raman shift level. And we can obviously zoom in and identify the difference in the position of the peak and the instancy part of the peak that we wanna analyze. Especially when we are going to do the CO absorption experiment. Obviously our software allows us to do peak peaking and identify the position of each peak one by one. The last stage of our study will compare the CO absorption with the single component. So hexane B itself in green, butanol by itself in red, 20% x and 80% butanol and then 50, 50. As you can see over here, the absorption study, sorry, the absorption study over here showed that whenever we add butanol to the sample, the shape of the isotherm is very similar to the one of pure butanol. No matter how much BUTANOL we have, even 50, 50, the the shape of the isotherm is very consistent, is very repeatable. In fact, if we look at the desorption data, EXN by itself is the only one that goes back to the initial mass. All the other sample, whenever there is butanol, butanol remains chemis or on the surface of the sample. And if we look at the Raman data, it actually confirmed the prediction of the DVS. EXN stays up here. Butanol is in green, butanol 80% sorry, 20, 80, butanol accent basically overlap perfectly with butanol and 5050 is slightly below that. So whenever we introduce any percentage of butanol, the Raman and the DVS data basically confirm that butanol is the factor that absorbs the most on the sample and it affects the most the isotherm shape and it affects the most the Rama data itself. So my point of view of predicting what solvent is actually on the surface of the sample when we are in a 5050 mixture, we can probably predict that most of the sample is actually covered in butanol rather than exane. The reason why we perform the initial Raman data and DBS data with water is to we always have to assume that there is a small residue of water in our sample and we wanted to be sure that it wouldn't affect the performance of the single component and multi component solption. As you can see, water is much lower in the uptake and it doesn't affect the Raman beta itself. So we can exclude the effect of water in this study. We can basically say that the data from the data provided from the Raman and the dbs, when we put a mixture of Exon and butanol, butanol is on the surface, Exon is probably not on the surface of the sample. And again, the Raman data basically allows us to confirm these especially because they match up perfectly. They point at the same type of shape and the same position of the peaks. So this is basically an overview of potential study that we can do with single and multi component absorption and how the Raman can integrate the data of DDS to perform and understand the solvent sample interaction. So that concludes the presentation that I wanted to show you today and I would like to thank you all for your attention and I would like to know if you have any question for me in regards to this presentation.
Thank you very much Damiano for that informative presentation and we are now open to accept questions. Actually we already have some questions raised in the chat box. Two questions from John. The first one is for hysteresis. Is it possible that equilibrium has not been reached on each adsorption or desorption step?
It is possible if you design an experiment to have shorter stages that the data of the plot of the isothermic are not represented in the equilibrium. However, it's very important for example to check that all your data are in equilibrium by looking at the kinetic part of your data. So whenever we do a study, the first thing we do is we plot the kinetic data and we look at every stage, every Equilibrium, all the mass are flat out. There is no point on for example, looking at the isoton plot if we don't know if the mass reading that we're plotting in the isotherm are actually representative of the equilibrium condition of the sample. So it's possible that they are not at equilibrium. However, you can adapt the method and guarantee that the sample will reach equilibrium in this stage. It's important to check obviously when you're doing the study, but it's possible.
The second question again from John is for solvent sorption, can a pore size distribution be extracted as well as the BET surface area as is done with nitrogen sorption at 77 Kelvin?
Yes. So the main requirement is to measure the BET surface area first. Then you can do the micro and meson porosity calculation and also the pore site distribution. The type of calculation that we are doing, the equation that we use for the calculation are the same one that are applied for nitrogen sorption in the same way that we do it for dbs. There is no difference. So the type of calculation that you do over there, you can do it over here the same way.
Okay, thank you. Thank you John for that question. I hope we answered that. The third one is from Judith. In the zeolite example with water and methanol is the decrease in mass during the stage highlighted in the blue oval due to solvent exchange where methanol is replaced by water.
Potentially the main important thing is we have seen a non perfect equilibrium. For example in this experiment. I'm not plotting the isotherm plot specifically because I just want to show the kinetic data. And in this kinetic data you see that some of the stages are basically tailoring down rather than reaching an equilibrium. So it could be potentially due to an exchange. It will need to be proven probably by a single, a more advanced study on spectroscopy on the sample itself to see if we are replacing molecular water with molecule of methanol. From this data is potentially true, but it needs to be is an assumption more than anything at this point. I want to highlight it because it's a specific phenomenon that we've seen in some specific material. And a more advanced study could potentially highlight if there is a solvent exchange happening here. But it's a good point. Yes.
Okay, thanks Damiano. And thanks as well Judith. I hope we answered that Another one from the chat box from Sridhar. What is the maximum temperature for absorption studies?
So the experiment can be carried out in a DBs from 5 to 85 degrees C, which is the temperature which we can move the incubator temperature. The incubator step. We do have a preheating stage so we can activate our sample to higher temperature if required. For example, for zeolite or metal organic frameworks we can have a local pre treatment of the sample at highest temperature. But the experimental temperature is limited by the incubator itself. So the maximum temperature will be 85 degrees Celsius.
Okay, thank you. Follow up, I think. Did you say from 5 degrees?
Yes, from 5 to 85.
Another question for hexane isotherm. Between 10 and 30% rhythm desorption. It's lower than sorption. Any reason for that?
Excellent. Let me go back. Oh, right here. You're saying right here, right? Yes. So this is. If you look at the. If you look at the data is more or less almost overlap between the absorption and desorption. The. The point that overlap perfectly is probably due to condition of equilibrium which might be due to the fact that the sample is still desorbing in some of the desorption stage compared to the absorption. I don't expect this sample specifically to have a value of desorption higher than the absorption cycle. However, you can have phenomena in which the desorption stage are lower than the absorption stage. It's not uncommon, probably not for this sample, but for other type of sample. You can see this type of phenomenon and is usually related to a transition or a change in destruction of the sample. So this destruction property of the sample has changed during the experiment itself. And consequentially the material does not have a lot of molecule on the surface. When you go back during the desorption stages, most of transition stages happen during the absorption cycle. And then you see the effect during the desorption cycle. This sample specifically does not have that phenomenon. So these stages are more of an equilibrium condition rather than an actual physical change in the structure of the sample. If you think about for example a recrystallization stage where or a glass transition phenomena, you can see phenomena in which the sample or decomposition. You can see a sample in which the desorption line is lower than the absorption line. And in that case it won't be reversible. Which means that they don't go back to zero. They don't go back to the initial value. But it will go much lower than that and that causes the transition, the shift.
I have another question. What type of Raman do we use with dbs?
Yes. So the Raman that I use to collect this specific set of data that I present to you today is A, B and WTECH Raman. We are not manufacturer of Raman. We purchase it from an American company called BNWTech. In this specific case we are using an I Raman with an in situ probe. That's the in situ probe that you see over here. The Raman sits right next to the incubator, this side. And what we actually do is we integrate it with DVS software, with the Raman software itself. So whenever the mass of the sample reach equilibrium, it automatically trigger the Raman spectra. So it's a fully integrated process between the two software. The analysis part of the data is controlled by the DVS on the side of the DBS set and on the Raman side is controlled by the BMWTech software itself.
GN asks, can other Raman probes be used like from Kaiser or Tornado?
Potentially. So the main factor that we are interested in is the size of the probe because the size and the shape of the probe will determine how close you can get to the sample. So if you have an existing Raman you can discuss with Bob and we can see if we can fit the Raman specifically in a position that allows to align with the sample pan itself. Obviously the main factor that we need to focus on is the fact that we need to reach a certain distance between the tip of the probe itself and the sample. The closer we are, we are attaching the sample itself and we are interfering with the balance and the better it is the type of data that we can collect. The other parameter that I have to mention is the fact that the BMWtech Raman that we use is fully integrated with the DBS. So right now we can basically create a method and run the DBS data. And the DBS software controls both the Raman and the dbs. But if we use a third party supplier, a different Raman, the software will only control the dbs. It will not communicate with a different supplier of ram. Because there is no connection between the two software, it will be need to be developed separately. So from a point of view of the probe depends on the size and shape of the probe. From the point of view of the software, it really depends on the software itself.
All right, thanks Damiano. Another one is from Philip. Does hysteresis happen to absorption?
Okay, I'm not sure I understand that question. So just to clarify, the hysteresis is the gap between the absorption and dissoption. So this is absorption line, this is a desorption line. The hysteresis is literally the difference between the absorption and desorption. So to Measure hysteresis. You need to fully measure the absorption and then measure the desorption and then see the difference between the two value that you obtain of the equilibrium.
Philip said that the example that you gave was an absorption. You can unmute your mic, Philip, if you want to clarify it for Damiano, if that's okay as well for you.
Can you guys hear me?
Yes, we can hear you.
Okay, like say the zeolite example that you gave is on the. I call it adsorption, right? Absorption. But if you have a material that your probe that goes into the material absorption, do you observe the same thing? I mean, I think that's always my question. So you're asking if, if we could measure the difference here using Raman or using dbs. Dbs? What I'm saying, like the example now you're talking about is zeolite, right? That the things only stay on the surface. And then you, you're talking about a hysteresis. However, if you have a sample that your probe really go into the materials, not on the surface, would you observe the same hysteresis? That's, I think that's my questions. Well, the hysteresis, for example, in your zeolite example here, the gap of hysteresis is non existent because obviously it's all on the surface. If a solvent goes through the bulk, for example, in this example over here, usually what you see, if there is a penetration through the bulk of the material, there is always a gap between the absorption and desorption. Because the molecule are not ready on the surface to be dissolved immediately, they need to migrate from this inside of the sample to the surface and then migrate. So in that case, when they go into the sample, they will have a gap of hysteresis. Okay, thank you. Okay, no problem.
Okay, thanks Philip. Are there any other questions from our participants for Damiana? Okay, I think that concludes our webinar for this morning. Thank you very much for joining us today. And if you have questions later on, you can email us@scienceurfacemeasurementsystems.com thank you so much again, Damiano. Thank you so much to all participants for your time today.
Thank you.
Bye bye, bye bye.
Sa.
More from Prof.

Webinar: Advances in Measuring Gas and Vapor Permeation Through Membranes and Barrier Polymers

Webinar: Determining Solubility Parameters of Bacterial Cellouse Through Energy of Adsorption

Online Webinar: Recent Technological Advances in Adsorption Based Direct Air Capture

Online Webinar: Surface Area of Pharmaceutical Ingredients at Real World Conditions by IGC



Hybrid Workshop: Measuring Material Vapour Pressure Properties Using Advanced Sorption Technique

PCL Hybrid Workshop: Recent Advances in the Characterisation of Pharmaceutical Powders


Using Advanced Techniques to Test the Performance of Recycled Bathroom Tissue | A video summary
