Webinar: Measuring co-diffusion kinetics on thin films & asphaltic components using DVS
Prof. Sorption explains Dynamic Vapor Sorption, an instrument that measures how molecules diffuse into and adsorb on materials. The webinar covers thin-film diffusion in bitumen, co-adsorption of water and methanol, and how to predict whether bitumen sticks to aggregate using surface energy calculations.
Questions this video answers
0.1 microgram
25°C and 45°C
~170 micron bitumen on 70 micron Kapton film
Ramped to 20% RH and then to 40% RH after ~720 minutes
June 4, 2019
Chapters
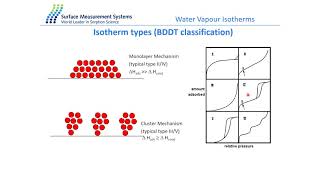
Hello everyone and thank you for joining in. It's my pleasure today to have this webinar on diffusion and permeability measurements by dvs. I'll start by comparing the technique with other characterization techniques and describe the different types of absorption processes and then move to introduce the system before going over some applications and case studies on vapor diffusion and permeability measurements on thin films and packaging materials, organic and water vapor co adsorption on thin films, water diffusion through bitumen film and minerals affinity to bitumen by measuring surface energy and adhesion properties. So for characterization techniques generally we either use energy as a probe or heat as a probe. And and these are for spectroscopic techniques where we can get analytical and structural information or in the case of heat like calorimetry and TGA where we get thermodynamic information. Here for the dvs we use molecules as a probe. It is adsorption technique and by measuring the isotherms we can get thermodynamic, chemical and and structural information. The way molecules interact with solids, they either are adsorbed onto the surface or absorbed into the bulk of the material. The speed they interact with the material and the speed they come out of the diffuse out of the material. All this gives us information about the material's behavior. And by studying the isotherms and the absorption mechanism, we can predict the material's behavior, the shelf life, the stability of the material and whether the material is porous. Whether molecules condense, paper molecules condense or interact with the material, go into the bulk of the material, cause phase changes. All this information we can get from the isotherms and the DBS data. Here's the schematic diagram of the system. The incubator accommodates the balance stand where there is a micro balance with an accuracy of 0.1 microgram at the top of the stand and then hang down wires coming down through these channels to the sample chamber here on the left and the reference side on the right. You don't have to open both chambers to put sample in and out and take the pan out. And only the sample site can be open and closed. So that basically saves you time and effort opening both chambers. Video options Preheater can be attached to the bottom of this chamber and the Raman probe UV probe can be attached to the top of this chamber on the sample side as well. You'll see exhaust line on the side of the incubator which can be connected to mass spec or any or GC in case you want to analyze any gases coming off of your Material. So basically the system consists of a series of very accurate mass flow controllers for two reservoirs in the one behind it, behind the reference chamber, one behind the sample chamber there, and sensor for the, for the moisture electronic probe and for the organic vapor ultrasonic sensor, or it can have two ultrasonic sensor in case you wanted to run two organic vapors. So what sort of information we get from the system here is the mass plot, the red line, basically change of mass against time. This gives you information about the kinetics, how fast the sample is drying at 0% relative humidity, and how quickly it reaches equilibrium at different RH steps. And finally, when it gets to the highest relative humidity and start coming up, coming down during the desorption steps, how different the desorption cycle is to the absorption cycle and whether at all it comes back to where it started from and whether the process is reversible or irreversible, and how much uptake there is, whether it's a surface option or whether it goes into the bulk of the material. And if we get the data at the end of each step and plot the mass against concentration against relative humidity, then you can plot the isotherms, absorption, desorption and the shape of the isotherm. You can analyze the shape of the isotherms and I'll show you that we have in the analysis software different macros, which allows you to apply different equations to the isotherms and analyze the isotherm. And that way get more information about the material's behavior and predict material interactions as well. One of the important aspects of the system is the fact that can generate the accurate, very accurate concentrations. And also when you ask for absolutely dry gas, that's what you get. Basically, if you're asking for 0% relative humidity at the beginning of the experiment and at the end of the experiment, that's exactly what you get, because that's. If he didn't, then the problem will be in some sensitive materials where they can scavenge the smallest amount of moisture. And here is a case where this pharmaceutical material, during the desorption, the pink desorption curve doesn't come back to zero because there is still moisture in the line. Whereas with our system, the DBS system, the blue line, the desorption curve comes back to zero because the gas is absolutely dry. And this is important because that could basically give the wrong information. As if the hysteresis gap here stays open and the sorption curve doesn't come back to zero, that indicates the material is actually holding on to moisture, whereas this is not true. In fact, if the gas was absolutely dry, the gap would close and it's a reversible process. So the shape of the isotherms, there are different shapes and according to the nature of the material and the degree of interactions between the probe molecules and the surface of the material, different shapes of the isotherms would give you different information. For example, type 1 typical of microporous materials, where very quickly vapor molecules are absorbed and they go to the micropores and the isotherm comes to a plateau very quickly. Type 2, type 4 isotherms, you have monolayer formation where monolayer of molecules interact with the surface of the material and then further layers build up on top of the monolayer. And as it can be seen in the type 2 type 4 isotherms, and the typical capillary condensation hysteresis gap is seen here as well. Type 3, Type 5 ICE terms, again typical of condensation or cluster formation, where molecules actually interact with each other rather than interacting with the surface of the material. So this type of interaction is not ideal for calculations like surface area, where you need monolayer interaction with the surface of the material in order to calculate the surface area. Different types of macros and equations are available in the analysis software. The standard analysis software typically allows you to plot the data. The mass data, plot the isotopes, calibrate the system through salt calibrations and then more importantly, the advanced macros allow you to do a series of more advanced calculations like PI E, spreading pressure, surface energy calculations, surface area calculations, heat absorption diffusion measurements and activation energy of diffusion. Basically the same experiment at different temperatures, which would allow you to calculate the activation energy and the energy barrier for any changes in the material. Nuts. And vapor pressure is for vapor pressure measurements of solids and other important macros. Amorphous content determination for pharma food industry permeability measurements, which we will have some more examples of later on and also more macros here. Isothermal analysis, some more equations for for inorganic porous materials, microporous mesoporous materials, and also Young and Nelson equation, which would allow you to deconvolute the terms and basically calculate how much monolayer, how much multilayer and there is present. And also the degree of interaction between the probe molecules and the surface of the material. Moving on to some examples. If you wanted to do some diffusion measurements on thin films, the most basic and simplest way would be just to hang the section of the film from the hang down wire in the sample chamber. And that way both sides of the film Both sides are exposed to the vapor. But it's the easiest and simplest way to measure diffusion. Diffusion coefficient and as you can see from the example here, as you increase the relative humidity, the diffusion coefficient increases as well. The next option would be for example, in the case of packaging material, this is a blister packaging for tablets. You can just hang the entire blister packaging material with the tablet inside and determine the diffusion of diffusion rate of moisture through the packaging material, which is then absorbed by the tablet. But a better way and a more sophisticated way of measuring diffusion and permeability would be through an accessory called the pain cell, which is basically a small cup with a top on. And the film is it can be sandwiched between the two sections of the cell. And then basically the whole cell is placed into the sample pan. And at different humidities, one side of the film obviously is exposed to the relative humidity or vapor concentrations. There are different configurations that you can use this cell. One is that you can put some moisture getting materials like zeolite in the cup and encourage moisture from outside to be absorbed by the zeolite through the film. Or you can just simply put some water in the cup and allow water to escape through the film the outside and measure the mass loss. So these two combinations depending on the nature of your material and how you like to see the moisture uptake or desorption, you can either have moisture gather material in the cup and cover it with the film and see how moisture is absorbed by the zeolite or water in the cup and see how quickly water escapes through the film here. Just an example to show you the difference that it makes by having zeolite or not having zeolite in the cup. The blue line shows a film material at different concentrations of moisture without zeolite in the cup. And the red line shows the the same film in the presence of zeolite in the cup, which basically shows more uptake, which is due to the zeolite pellets. Here's another example. Due to two different types of films, one is thicker than the other. And as you can see here, the diffusion rate for the thinner sample thinner membrane is much faster and greater than the thicker film. And the software can then calculate the diffusion rate and permeability or water vapor flux. And as you can see here, the polyurethane membrane shows much faster diffusion rate. Here's another experiment where you have two vapor being generated. Moisture, water and methanol. Methanol could represent any organic vapor, really could be a flavor molecule escaping through packaging material. Or in the case of depending on the nature of the material you're dealing with, any solvent coming of solvates. So basically we use the captain film just for this experiment, just plain film. And by having zeolite inside the cup, encourage moisture to go through the film and encourage the organic vapor as well. So to begin with we applied only methanol and then only water and then followed by water and methanol. So basically water provided a background humidity and we studied the absorption of methanol molecules. To investigate the absorption process more, we treated the experiment at higher temperature as well. So 25 degrees and 45 degrees here. And to begin with, methanol diffusion for 50% purp naught at 0% relative humidity. You don't see any differences at the two different temperatures. So the diffusion is the same. But as you move on to water at 20% relative humidity in the absence of methanol, you'll see that higher temperatures encourages molecular mobility and the diffusion for water at higher temperature is greater. However, when you have both methanol and water present, the temperature makes the biggest difference. And you can see here 50% partial pressure P over P0 and 20% relative humidity, there is a greater diffusion rate for the methanolsorption. In another experiment we used the captain film as a support for for some bitumen sample. Generally, moisture diffusion in mineral bitumen systems is the main cause for degradation. The adhesive bond between the aggregate and bitumen will change, which results in the separation of the aggregates from the asphalt mixture. So it's important to measure the permeability rate of moisture and adhesion properties of mineral and bitumen. So to test the thin layer of bitumen we would need a support as without the support, bitumen will deform with time, especially at high temperatures. So Kapton film, after trying different films, Kapton film proved to be the best, the most stable one. So bitumen films were prepared by film casting using toluene as a solvent. So a thin layer of bitumen was placed on the support, the Kapton film. And then we Solution coated about 170 micron of bitumen on a 70 micron Kapton film, which were then sealed into a pain cell. Zeolite again was used in the pain cell. And we then ramped up the humidity to 20% and and then to 40% RH after 720 minutes. At this stage zeolite was fully saturated and basically any more data after that wasn't really of any use. So we stopped here. At 40% the permeability rates for 20% and 40% RH look good. They are in good agreement with literature data. And it shows that basically the permeability rate doubles as you double the relative humidity concentration. I must say that this experiment only measures diffusion and permeability constants for bitumen film. And the uptake is for zeolite. So this, this uptake there's no way is for the bitumen or for the film is so high that it's just for the the amount of water that goes into the zeolite. So basically the mass data at the end of each step and is used to calculate diffusion rate. So then at equilibrium conditions at around 720 minutes, considering the thickness of the film, we were then able to calculate the diffusion coefficient, which is again in agreement with the literature data for the bitumen sample. Moving on to something a little bit different, still on the bitumen and asphalt materials, but considering that physical and chemical properties of minerals and bitumen also affect the affinity between bitumen and aggregate, we can investigate these properties using dvs. These properties include surface energy, surface chemistry, surface area. And we can use DVS to measure all these properties. Of course, these properties can be used to select combination of bitumen and aggregates that are more resistant to moisture damage and also to select additives that can be used to improve the performance of asphalt mixtures. Based on the physicochemical nature of the bitumen and aggregate. Also using these properties, we can predict the resistance of the mixture to moisture induced damage. To measure the surface energy, we would need to measure isotems for an alkane like octane here and two polar probe molecules like ethyl acetate and chloroform which have different acid base Lewis acid base properties, electron donor electron acceptor properties. Here the isotherms show a small uptake due to surface absorption only. And again, type 2 isotherms indicate monolayer formation here, which are ideal for the kind of calculations we want to do. Then use the analysis software to calculate the surface energy and work of adhesion for the sample. So how do we predict the interaction between the aggregate and the bitumen? The adhesive strength depends really on the properties of the mineral and the bitumen, which is related to the asphalt quality. And this can be considered as work of adhesion. And we can measure work of adhesion through measuring the surface energy. Surface modifications can affect the work of adhesion. For example, greater surface roughness of minerals will increase work of adhesion and increase mechanical strength, whereas impurities or different additives can affect the work of adhesion too, and can, for example, acid base properties of minerals may affect work of adhesion and decrease mechanical strength. So to do the experiment, we want to measure dispersive and polar surface energies for the minerals and measure dispersive and polar surface energies for the bitumen. So that involves basically doing the absorption measurement for an alkane molecule and two polar molecules on each sample and calculate work of adhesion using surface energy values of minerals and bitumen. And then we can compare work of adhesion with work of cohesion values. High work of adhesion, of course means a stronger mineral bitumen bonding strength, and higher work of cohesion means mineral interactions or bitumen interaction. So basically clumping effects. So the ultimate goal is to predict mineral bitumen interactions without any mechanical tests. So here are the results for a series of minerals, aggregates, Dispersive surface energy shows that quartz sand and calcite sand have relatively higher surface energy and calcite sand is the highest surface energy. So would probably give the best interaction with bitumen and quart pure and pot felt spares. Similarly sort of low interactions is expected from these two. And then looking at the acid base properties of these materials, we did a series of probe molecules, dichromethane, ethyl acetate, butanol and toluene, each one representing an acid and base probe molecules which would be targeting the acid base sites on the surface of the material. In conclusion, EVS is a very versatile tool for studying the moisture absorption behavior of a wide range of materials. It can be used to measure work of adhesion, work of cohesion, which would give us information about the interaction between two different bodies like bitumen and aggregate. So the affinity between the bitumen and aggregate can be calculated. The VS pain cell can be used to measure diffusion rate and permeability of moisture for bitumen. And also DBS can be coupled with different microscopic and spectroscopic techniques. Like we can have video camera and also RAM and UV probes attached to the system. And it's a very sensitive characterization tool which can be used for a wide range of materials to study batch to batch variation and processing problems. It can also be used to measure vapor pressure and porosity, inorganic solids, heat absorption, gas sorption, CO2, H2S, SO2 sorption, and also of course coadsorption and vacuum drying as well. Thank you very much for listening and I'd like to thank all my colleagues at Surface Measurement Systems and also especially would like to thank our collaborators and Dr. Katerina Varveri and her team at Delft University for lending us the bitumen samples. Thank you very much.
More from Prof.

Webinar: Advances in Measuring Gas and Vapor Permeation Through Membranes and Barrier Polymers

Webinar: Determining Solubility Parameters of Bacterial Cellouse Through Energy of Adsorption

Online Webinar: Recent Technological Advances in Adsorption Based Direct Air Capture

Online Webinar: Surface Area of Pharmaceutical Ingredients at Real World Conditions by IGC



Hybrid Workshop: Measuring Material Vapour Pressure Properties Using Advanced Sorption Technique

PCL Hybrid Workshop: Recent Advances in the Characterisation of Pharmaceutical Powders


Using Advanced Techniques to Test the Performance of Recycled Bathroom Tissue | A video summary
