Webinar: Moisture Sorption and Drying Kinetics by DVS Analysis
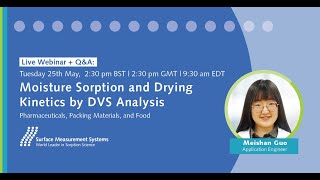
Meishan Gao demonstrates Dynamic Vapor Sorption (DVS) for measuring how solids absorb and release moisture. The webinar covers experimental methods, interpreting isotherms and glass transitions, and how gas flow and temperature affect drying speed, with case studies on starch, lactose, and pharmaceutical compounds.
Questions this video answers
Meishan Gao, Application Engineer at Surface Measurement Systems (at company since 2018); MSc Chemical Engineering, Imperial College London (2017).
0.1 microgram.
Incubator range 5°C to 85°C; optional in‑situ preheater up to 200°C.
200 sccm (continuous flow).
Low‑mass balance: ~1 mg to 150 mg (up to ~1 g with counterweights); high‑mass balance: up to ~5 g. For good signal use <10 mg if uptake ≥~1–5%; use 100s mg if uptake <1%.
Chapters
Hello everyone and thank you for joining us for today's Surface Measurement Systems Online webinar. The title of today's session is Moisture Absorption and Drying Kinetics by DBS Analysis. Today we are lucky enough to have our own expert, Meishan Gao, our application engineer of Surface Measurement Systems, here to deliver today's presentation. Mei Shan, as I mentioned, is an application engineer at Surface Measurement Systems and has been working here since 2018, in which time she has been working on surface characterization of solid materials, including fiber, powder and film samples, using dynamic VAP absorption and inverse gas chromatography as our main techniques. Meijan obtained her Master's Degree in Chemical Engineering at the Imperial College of London in 2017. Her research project was focused on investigating the properties of fragrance molecules with solid substrates by diffusion and absorption. She has also received a Bachelor's Degree in Chemical Technology at the Hong Kong Polytechnic University and in Chemistry at the Sun Yat Sen University in June. Just before we proceed to today's presentation, I would like to remind our audience about some of the housekeeping rules for the session. We do request that all attendees keep their microphones muted for the duration of the initial presentation, just so we don't have any feedback or background noise interrupting the session. And for those of you who would like to take part in the live Q and A with Meshan at the end of today's presentation, there are two ways you can do this. You can use the questions panel, which you can see in the control panel to your right to submit the question in writing. At which point I will submit this question to Meijan at the end of the presentation. Or alternatively, if you would like to expand on the question or it's quite a complicated question you want to ask yourself over the microphone, please raise your hand during the Q and A session and I will let you know when you can unmute your microphone and ask your question directly. So without further ado, I would like to pass over now to Mei Shan to begin her presentation. Thank you everyone.
So good morning, good afternoon, and good evening everyone around the world. I'm Mei Xian and thank you for joining today's workshop. So in my presentation today we will focus on the moisture sorption and the drying kinetics by the DBS analysis. And here is my outline, the outline of my presentation. So I will first introduce a little bit about the background of the DBS instrument. Then we can go through different method we can use in the DBS systems. And last part we will discuss something about the factors that will affect the kinetics of Sorption and desorption, with some examples in the food and pharmaceutical industries. So moisture is everywhere in the real world and the relative humidity can vary in different areas. The interaction of the moisture with the solid material will have a great impact over a wide range of industries, especially in the food industry. Moisture will cause lots of different problems. For example, the powder caking that will affect the powder flowability as well as the instability of the material both physically and chemically. And moisture can also induce the phase change for some food material. So for example, the dissolution or deliquescence of the sugar at higher humidity range. So it's very important to study the moisture absorption behavior for the prediction of shelf life or the stability of the food products. And DBS can be a very useful tool here to study this kind of moisture sorption behavior. So DBS is short for the dynamic wave perception, which is basically a gravimetric method to measure the mass change of the sample at different concentrations of moisture and organic vapor. It has ultra balance in the system with a very high sensitivity. So we just need to use a very small amount of sample for the analysis, usually just less than 10 milligrams. And compared to the static method. DVS has a continuous flow of the probe molecule to the sample. So we can achieve a much faster equilibrium compared to the static method. And we can perform the experiment both at ambient temperature and the pressure as well as we also have the system to perform the vacuum conditions during the experiment for some porous material. And here I have an example with one of our system, the DVS resolution, which can perform the sorption of both water and organic vapor as well as the competitive sorption of two different components. So in the middle of the system here we have our macro balance with the resolution of 0.1 microgram. It's connected to both the sample pan and the reference pan. And there are two bottles at the back of the system, one for water, the other side for the organic vapors. The carrier gas for the system could be nitrogen or dry air. And the mass flow controllers inside the system will control the flow of the carrier gas with the saturated vapor in ratio to get a certain level of humidity. And this mixture will be detected by our sensor here. So the speed of sound sensor for the organic vapors and the rotonic probe for the humidities. This sensor will ensure the generation of the humidity or partial pressure is matching with the target values. And then this mixture will flow to both the sample chamber and the reference chamber at a constant rate. The sample inside the chamber Here will pick up the moisture and the mass change will be detected by the balance here. So the whole stand like this one will be sit in an incubator with the temperature range from 5 to 85 degree. That means we can perform the experiment between 5 to 85 degree. And in case, if you want to preheated your sample at a higher temperature, we also have an optional preheater that can be located under the sample chamber here that allows you to precondition the sample up to 200 degree before the experiment in situ for the samples. And the system can also be integrated with some other techniques, for example the Raman spectroscopy, the NIR or some video functions. An example with the dvs, with video that we can take the sample images and at the end of each humidity step to study the change in the color for this case, or the swelling and the shrinking of the sample at different humidity conditions. An example with the DBS with the RAM spectra. So on the right hand side is our DBS data. So we use the amorphous lactose sample at 25 degree, we change the humidity from the 0 to 90% RH, which is the blue line here, and the red line is for the change of mass for the sample. So at each humidity step, the sample is picking up the moisture, it's reaching a perfect equilibrium and then jump to the next stage automatically. And at a specific step here, which is 60% RH, the red line is dropping a lot, which is due to the amorphous to the crystalline phase change. And this phase change didn't show in the second cycle. So it's a kind of irreversible phase change. That's something information we can get from the DVS data here. And then we did the Raman spec at the end of each humidity step. So we collected the Raman spectra along with the DBS data. So at 0 and 40% RH, the Raman spec shows an amorphous state. And exactly above 60% RH there are some new peaks showing up here, just indicating of the crystalline state. So this Raman spec just confirming with our observations in the DBS data that at 60% RH, this amorphous lactose sample will go through the amorphous to the crystalline phase change. And the same you can see in the video images as well. So the combination of the video image, the Raman spectra as well as our DBS technique can give a very good understanding about the solid characterization for different kind of samples. Then I would like to go through some different methods we can perform in the DBS system. So the first very typical method is the step method that we can change the humidity step by step. So here's the example with the rice starch sample for the moisture absorption that we introduced the water vapor at different concentrations and we changed the relative humidity from 0 to 90% RH with 10% different steps. And the red line is for the change of mass for the red starch sample. So it's picking up the moisture, it didn't go through any phase change. And that's the second cycle, exactly the same as the first cycle. So that means this kind of moisture sorption and desorption is a perfectly reversible process. There is nothing happening during this kind of sorption desorption. And the first step is just the drying of the sample with the flow of the carry gas. It will give you the original water content inside the sample from the time zero, the mass at time zero. And this is the mass plot between the change of mass changing as a function of time. And this will give you some kinetics information. And if you take the change of mass at the end of each humidity stage and plotting against the relative humidity, then you will get these isotherm plot with both sorption and branches with target relative humidity and change of mass. So isotherm is a very important parameter to interpret the moisture absorption mechanism from the shape of the isotherm. Some information you can get from this isotherm plot, for example, at 90% RH the sample can pick up about 20% change in the mass. That means the red starch sample has a very good affinity with water. And those water molecules are not just on the surface, but also go to the bulk of the material. So it's a bulk sorption dominated mechanism. And this is also confirming with the hysteresis gap between sorption and desorption. So the gap here just showing when the water molecule diffusion from the bulk to the surface it has a different kinetics. So the diffuser, the desorption is a diffusion limited process that results in the hysteresis gap between sorption and desorption. And if we are also using some organic vapors and do the isotherm for some organic vapor like hexane, octane or ethanol, we can get a type 2 or type 4 isotherm. We can also use the isotherm to calculate the the BET surface area of the material. So for example, here we have different types of the isotherm. The type 1 isotherm is typical for some macroporous material and the type 2 and type 4 isotherm is for the monolayer formation of the PRO molecule on the surface and then multiple layer on the top of the monolayer. And in case of some of the water molecules, they will have strong interaction with the water molecule itself, so it will form some cluster on the surface. And this kind of mechanism will result into the type 3 and type 5 isotherm. And it's not good for the bet calculation. And type II isotherm is considered as the most stable state of the PRO molecule on the surface. And it's quite important for the sample characterization. The other method I would like to introduce here is the ramping method, which is a much quicker and easier way to study the stability of the solid material. And it's very similar to the DSC temperature ramp. So in case of DBS we ramp the humidity from 0 to 90% RH at a concentrate. And here's the result for the lactose sample. And it's quite clear that the water solption first is losing the mass cause just the flow of the carrier gas. And the sample mass is increasing slowly due to the surface option of the water molecules. And after a certain point of humidity the sample will increase dramatically because the water molecule here is not only on the surface, but also penetrating the surface and go to the bulk of the material. So it's a bulk dominated mechanism. And the transformation between the surface option and the bulk option can be taken as the glass transition. And from the slope before and after this point we can get the glass transition point. And we can also calculate the glass transition humidity for this sample at certain temperature. And as the humidity keeps increasing, we can also notice there is a point that the sample will decrease the mass dramatically. And this is due to the recrystallization of the sample that the crystalline state has smaller surface area as well as less soption capacity. So with this single plot we can get one point for the blast transition and another point for the crystallization for the material at certain temperature. And here is 25 degrees. And if we do a series of ramping experiments at different temperature, we can then get this kind of stability mapping between the temperature and relative humidity. So here the blue line is for the blast transition for the sample and the red line is the crystallization of the sample. And from this stability mapping we can easily predict at a combination of the temperature and humidity is the sample at a very stable amorphous state or the crystalline state material or just unstable to change the structure anytime during the experiment or the performance A case Study related to the ramping method here is about the coffee granule that we. Using the ramping method on the coffee granule exposed the humidity from 0 to 90% RH and then desorption back to 40% RH. So during the sorption process up to 60% RH, the sample didn't pick up lots of moisture. It's quite stable before 60% RH. But after 60% rhythm there is a dramatically increase in the mass change. And for the sample image taken at the end of 90% RH you can see a clearly transformation or the color changes for the sample compared to 60% RH. And during the desorption we can also see the increase of the mass and the mass rich equilibrium or the maximum at 75% rhythm. So the delinquency point is something between 90% RH and 75% RH here. And this is a very useful plot to study the stability of this coffee granule at certain temperature. And the third method I would like to show here is a cosorption method with two different vapors. It can be either two organic vapors or one organic vapor with some background humidity. And here we want to use the example of a packaging material to mirror the permeability of the moisture with the help of the pencil. So the pencil is an accessory you put in the middle of the sample pen. And then you can use this pen cell to study the vapor transmission rate, water activity, diffusion or permeability for some thin film or some packaging material. So this pincel is composed of three different parts. The top of the cell, we have two different rubber O rings here and also the cup of the cell. And we can put the thin film sample in the middle of two rubber O rings and seal the film with the rubber with the cup with the top. We can either put some drying agent just inside the cup here and the drying agent will keep 0% humidity throughout the experiment. And then we can change the oxide concentration with our DVS instrument. So the vapor molecule will just go through the film sample from the top to the bottom with one direction only. Then we can calculate the one way diffusion coefficient or the permeability for the film sample. And according to the Fick's law, we have the thickness of the film sample, we have the mass at equilibrium state. Then we can do the plot and from the slope we can calculate the diffusion constant of the material as well as the permeability of the molecules. So here we have the case study with the Kapton film sample and we perform the sorption of both water and methanol as well as the cosorption of two different vapors. And this methanol molecule just represent any organic vapor or even a kind of flavor molecules escaping from the packaging material. So we set up the experiment mainly for three different stages. The green one is the partial pressure of methanol. So the first stage is the methanol only stage with 50% partial pressure. And the second stage is the water only stage with 20% water. And the last stage is 50% methanol in the presence of 20% water as the background. And we perform the same experiment at both 25 and 45 degree to study the effect of temperature on those molecule diffusion. So the blue line here is for 25 degree and the red line here is for 45 degree. So for the first stage which is the methanol only stage, the two plots are very similar to each other. And also the calculated result which is the permission rate for the methanol molecules has the same values at two different temperatures, which means temperature has very little impact on the methanol diffusion. However, for the second stage which is the water only stage. So this time the values for the water only stage at 45 degree is almost five times larger than 25 degree. This is probably due to higher temperature encourages the molecular mobility that results in a higher diffusion for the water molecule. And for the last stage here, which is the methanol with the background humidity. So the permission rate at 45 degree is also increased a little bit compared to 25 degree. And there is a huge difference in the plot as well. So this means the background humidity helps the math normality diffusion at higher temperature. And here just demonstrates the potential to measure the influence of temperature and background humidity on the vapor transmission rate for some thin film or packaging materials with the help of the cosorption method. And we can also apply the cold suction method to study the red humidity effect on the surface area of the material. That how the surface area will changes with the increasing of background humidity. And the last part I will talk about today is the factors that will affect the sorption kinetics. So with the DBS technique we can change the environment condition of the sample inside the chamber here. And then we weight the sample to each reach equilibrium at each step. From the equilibrium mass, we can then plot this isotherm. So the mass plot in the middle here will give us the kinetics information about the moisture sorption and desorption, Just how quickly the sample is picking up the vapor and how fast the sample Mass is reaching equilibrium. And this sorption kinetics of a solid material is basically dominated by three factors here. So first is the mass transport in the gas phase which is just the vapor flow inside the system. And also the morphology of the sample for the measurement as well as the temperature for the experiment. So for the first factor the mass transport in the gas phase is about how quickly the moisture is supplied to the sample. And in the DDS system this is optimized by having a dynamic flow of 200 sccm of vapor to the sample to ensure a very quick delivery of moisture to the surface of the material. And this is one of the advantage of the dynamic system that in the DBS we have a continuous flow of the PRO molecules to the sample that makes a fast equilibrium during at each stage. For example, in the DBS experiment we can reach a full soption desorption experiment within three days compared to several weeks or even months for the single point in the jar method. And the actual humidity or partial pressure is always measured by the sensor inside the system. And this will make sure the performance of the system with a very good and accurate measurement. So for example, the generation of humidity at 20 to 50 degree, we generate the humidity from 0 to 90% RH. Sorry, 50, 90% rhythm. The red line is for the actual or merit value for the partial pressure and the green line is the target value we want to generate it. And the lines are just overlapping here that means the two values have very good agreement with each other. And here just shows the system has a very excellent humidity performance within a long time, like over 24 hours or even longer time. And the second factor will affect the sorption kinetics is the sample morphology. And this is primarily a function of the total sample mass as well as the average particle size. That will affect the moisture transmission or the moisture diffusion into the sample. And this will lead to different time for the equilibrium. And here we have two examples. One is with the base case sample and the other with the polymer sample. So in the first case study we have the biscuit from the market and we cut two different pieces for the biscuit with different sample mass. One weighs about 12 milligram and another biscuit about 800 or 900 milligram. And we we perform the watersoption experiment at 25 degree with the full sorption and desorption from 0 to to 95% RH with 5% different steps. And here's the result for the larger piece about 800 milligram. And because the larger piece of sample is quite large. We cannot put the sample inside our sample pen. Then we can just use a very little piece of wire in the middle of this sample. And then we can put the sample directly on the hand down wire inside the system or inside the sample chamber. And as you can see, the total experiment time is about 10 days. But still the sample mass did reach equilibrium almost for all the different stages. And this sample, the larger piece of sample can picks up about 27% change in the mass at 95% RH step, but it can probably pick up much higher than that because it didn't show the equilibrium at all. So this set of data is basically a set of non equilibrium data with the maximum stage, maximum time for each of the stages. And what we can improve for this method is we can increase the maximum stage time, but in this case the experiment will probably take forever to complete. So we just perform another experiment with the same method but smaller sample mass which is about 10 milligram. So here the blue line is for the 10 milligram sample and the right line is for the 800 milligram sample. And this time, as you can see, the equilibrium is much better at each humidity step apart from the top stage. And the total uptake for the sample is more than 45% mass change in at 95% step in this case. So with the smallest sample mass we can get a much better quality data with faster sorption kinetics. And that's the result of the base case sample. And we also perform, we also have another example with the water soluble polymer which is the PVPK25. And this time we perform the experiment with even smaller masses. One is about 26 milligrams, another is just half milligram. And since this sample is a very hycroscopic sample and the balance inside the system has a very good performance. The resolution is 0.1 microgram. So even the sample mass is less than 1 milligram, we can still get a reasonable data and good comparison between different masses. So here we call the half milligram sample as micro PVP sample and the other sample as normal PVP sample. And here's the result for the two PvP samples that we performed the experiment at 25 degree from 0 to 95% RH. The blue line is for the macro PVP sample and and the red line is for the normal PVP sample. And this data just clearly demonstrate the effect of the sample size very dramatically affect the overall speed of analysis. So in this case we decrease the sample mass about 50 times for the macro PVP sample. Then the analysis time for the macro PVP sample is almost 10 times faster than the normal PVP sample. And this is the table. Summarize all the equilibrium content at different humidity for two different samples. And these two different samples shows very good agreement for the equilibrium content during the soption and desorption and especially in the lower humidity range the values are almost the same. So the sample size in this case didn't affect the moisture uptake capacity for the sample but will significantly improve the sorption kinetics for the sample with smaller amount of the sample for the measurement. And the last factor will improve the sorption kinetics is the temperature of the experiment. So generally the higher temperature will give more energy input for the moisture diffusion. Therefore it will result a faster kinetics for the moisture sorption. And here we have two different examples with macrocellulose material and carbamazepine for the dissolvation kinetics. So the first study is about the macrocellulose for the sorption at different temperatures from 5 to 60 degree, we use around 10 to 20 milligrams of MCC sample and we perform exactly the same water solution experiment from 0 to 95% RH with 10% and 5% steps. And here are the results for different temperatures. So different colors for different temperatures and between 5 to 25 degree, the moisture uptake at a particular relative humidity doesn't show a significant difference. But the time for reaching the equilibrium is much longer in the 5 degree experiment compared to the 25 degree one. And for the result at higher temperature the 40 degree, 50 degree and 60 degree one. So with the increasing of the temperature the water absorption capacity decreases which is probably due to a structural rearrangement inside the macrocellulose material. However for the kinetics it still keeps increasing with elevated temperature. So the experiment time for 60 degree run which is about one day is about three times faster compared to the 5 degree one which is about three times in this. And then we also calculate the diffusion constant for the water molecules at different temperatures. The diffusion is calculated with average particle size for the macrocellulose material of 50 micrometers. And this diffusion constant also shows a trend of increasing with increasing of the temperature. And another observation is about the hysteresis gap between salt and desorption. So here the 25°1 is the blue lines. We also have the blue, sorry the red lines for 25 degree, the blue line is for 50 degree and the green line is for the 60 degree. So as the temperature increases, the water molecules move more freely out of the bulk structure, which results in a smaller hysteresis gap, like a smaller hysteresis gap here, and also an increase in the diffusion constant in the previous slide. And this study just demonstrates the effect of the temperature on the moisture sorption kinetics at a range of humidity within the temperature stability of the material. And we recently released the technical notes for this study. So if you're interested in this study, we are happy to share the note with you after the workshop. And the last example is a very simple study with the carbamazepine that we use around 20 milligrams of the sample with acetone vapor at a range of temperature from 15 to 30 degree to study the temperature effect on the dissolvation kinetics of carbamazepine sample. So we initially dry the carbamazepine sample at 0% partial pressure of acetone for about 60 minutes and then we expose the sample to 95% acetone vapor about 10 hours. And then we change the partial pressure of acetone back to zero and wait the sample until equilibrium. So the second stage is for the solid formation of acetone and the last stage is the loss of the solute. And we want to study the effect of the temperature on the loss of the solute. So we perform the same experiment at a series temperature and here we plot the fraction dehydrated as a function of the time. So with the increasing of the temperature we can see a clearly trend about the dissolvation process is much faster than at higher temperature. The sample can reach equilibrium much faster at 30 degree compared to the blue line for the 15 degree one. So the previous two examples just demonstrate to you how the temperature will affect the sorption and desorption kinetics and all these three different temperatures, the vapor flow rate, the sample morphology as well as the temperature are very useful parameters to develop the DBS experiments with faster kinetics as well as better quality data. And that's the end of my presentation today. So DBS is a very versatile tool for the material characterization. It can be used to characterize lots of different samples. And for the food industry it can use to study the stability and the shelf life of the material at different conditions. And we can also measure some other properties of the material, for example the BET surface area, the porosity of the material or even the heat absorption for different vapors. So I hope you will find DBS useful in your future Research and thank you very much for your listening today. Thank you. And let me know if you have any questions. Thank you.
Mei Shen, that was a fantastic presentation. And yes, just a quick reminder to our audience, there are two ways to submit questions for the Q and A section. You can either submit these in the questions panel in writing, or you can raise your hand and we will prompt you to unmute your microphone and you can ask the question directly. So the instructions are there on your screen now as well. So please do submit your questions. And I can see we've already got a few questions come in already, so let's get around to them. So our first question from John Zielinski and he asks, you showed diffusion coefficient versus temperature in example 2, did you observe concentration dependence in the diffusion coefficient?
Yes, that's right. Exactly. I think maybe as you mean for the example for the axle at different temperature and show the diffusion is increasing with the temperature. And in that table we also specified the previous partial pressure step and the target partial pressure step. So it's from 70 to 80 partial pressure. So the humidity will affect the diffusion, of course, and the difference for the partial pressure or the right humidity will affect the diffusion coefficients at different temperatures as well as. So we need to set up what's the previous step for the humidity and the last step or the target step for the humidity. We can share with you this technical note about the diffusion. Thank you.
A question from Stefano Campo and they ask, what kind of solvent can I use instead of water?
I'm not quite sure what kind of parameter you're interested in. So with our system we can perform both water and organic vapors. So we have a list of the solvent already calibrated for the sensors. So most of the common solvent like ethanol, octane, nonin, there is no problem to perform them at a wide range of temperature. And we can even perform the generation of two components like the corsoption method I introduced previously. So with organic vapors we can also perform the experiment and maybe additional one, we also have the vacuum system that we can perform with the gas like CO2 so 2, the solption of those gases as well.
Thank you. Annette Larson has asked, can you say anything more or refer to the literature on how you calculate the diffusion constant from the DBS ramping experiment?
Yes, we calculated according to the fixed law, so we have an application note, especially on the calculation about the diffusion constant. So maybe if you contact us after the meeting, we can share with you those application notes. So basically it's from the thickness in case of the film sample or the particle size in case of the powder sample. And from the mass at equilibrium state and the mass begin with the increasing. Then from the slope we can calculate the diffusion constant for those samples. Yes.
And we'll follow up with you after this call just to make sure you have anything you could need to look at or want to look at. Another question here from Sara Otoboni and they ask how can I calibrate the system if I want to use a different solvent?
So we already have a large list of the different solvents calibrated with our speed of sound sensor. And in case if you have any specific solvent you want to perform, I think you can now calibrate the system yourself. We need to calibrate the sensor on site in our lab and then we can update the configuration files in your system and then you can use the solvent inside your system.
Thank you. Sara goes on to also ask do you have examples where you have used DVs in combination with other PAT like IR or Rahman?
Yes, we have the combination of the Raman or IR with the DBS technique. So. So I showed an example before with the morphers to the crystalline phase change. And we also did some Raman experiment before for some cellulose sample that at a certain step of the humidity it will show some peaks like in the Raman spec and with the ir. I think we may also have some examples maybe after the meeting we can share with you.
Thank you.
Robin Nielsen asks in one of your early plots you have vertical lines indicating monolayer multiple layers and free water. Could you explain how you concluded the position of them?
So those monolayer is regarding to the BET theory that we can form the monolayer range like the linear range is for the monolayers and then after that the increasing that is a curvy one is for the multiple layers. So that's for the type 2 isotherm. And then we can use those kind of monolayers for the BET surface area calculation. And for the free waters it's basically just the deliquids point at higher humidity range and those for the free waters in isotherms like some condensation of the water on the ice on the surface of the material.
Thank you. We have another question here. What would be the minimum sample mass for a DBS experiment?
Like we have two different configurations of the balance, so the low mass balance have a high resolution that we can use smaller amount of the sample. So between like 1 milligram of the sample up to 150 milligram and up to 1 gram of the sample with some counterweights. And we also have a high mass balance with a little bit lower resolution. But we can put up to 5 gram of the sample for the measurement. And the mass of the sample is just depending on the uptake of the sample that the sample has good uptake, more than maybe 1% or 5%. You just need to use about 10 milligram or less than 10 milligrams of the sample. But in case of the sample has very low uptake, just surface option like below zero point, just below 1% of mass change then you need to use larger amount of the sample like 100 milligram or or several hundreds of milligram samples to get a good signal to the noise ratio.
Thank you. Annette Larson has asked as well. We have a polymer system that goes through TG swelling and probably water clustering. How can we separate these events in the best way?
So I think if you already have a TG values then if you perform the experiments just get a quick scan with the ranking method then you can also get a TG humidity for the sample at certain temperatures. And if you want to get a good quality of the data then you can set up the step method with smaller steps like 5% step or even 2% step. Then you can see at exactly which percent of humidity the sample goes through this kind of phase change. And if you want to measure any kind of sample like the property, the BT surface area of the material, you need to avoid those kind of phase change. Just mirror it before the phase change of the humidity of the sample. Sorry.
That's great. Thank you. Alex Monaghan has asked is there any available literature or guidance that details how the flow rate in the DVS compares to a static test or real world?
I think so. There should be lots of different literatures comparing the dynamic system with the static method. Basically the static method will take a long time for the equilibrium. And also the control inside the jar or inside the static method is not under control. And the flow system or the dynamic system has a much faster flow rate and a very accurate control of the concentration. I think maybe if you contact us after the meeting we can share with you some comparison between the static method and the dynamic method. The literature.
Yes, please do get in touch after the meeting and we will be happy to provide these the literature for you. There a question here from. Excuse me, a question here from Ilham Lashkari. First off they thank you for the presentation. Meyshan. Their question is considering multiple examples that we provided the sorption and desorption isotherms of the films when comparing different morphology were quite, quite different compared to other examples you provided based on your observations. Does this observation result in specific recommendations for sample preparation when using this technique in relation to sample size?
The plot for that film sample example, the cosorption one, that change of mass is basically the change of mass for the zeolite inside the sample. So it can pick us up, picks up lots of moisture for the zeolite sample. And we basically use that data to calculate the permission rate of the water molecules through the film. So let me show you. I think I can't show here, but for the zeolite of course it can pick up lots of samples and in case of some powder sample, the uptake will be much lower. It will show some different kind of plots, maybe magit. Do you have anything to add?
Yes, thank you Michelin. Of course, as mission mentioned, the zeolite is just used to encourage the transport of vapor molecules through the film. And we have to distinguish between the transport of vapor through the film and going into the bulk of the sample. So basically we can do the experiment once with zeolite and once without zeolite and then basically offset the effect of diffusion into the bulk of the sample and the diffusion through the sample. That's one way of basically adjusting the data. And in terms of sample preparation, again you have to take into account that the diffusion into the bulk and diffusion through the sample is a separate issue. Preparation of powders, for example, you spread this powder well on the surface of this sample panel and depending on the uptake, the minimum amount of the sample you can basically use to get the fastest experiment. And again, whether the sample is compact like a tablet and whether it's powder, that makes a difference as well. So if you are using a compact sample, again that's, you know, you can take, depending on the uptake, you can take the smallest piece of the compacted sample. So these are the parameters you can play with. As Mishan explained, the mass of the sample, the flow of the gas and the temperature to improve the kinetics.
Thank you. Oh, sorry, go ahead.
Sorry. I'm just saying is that hopefully that has answered your question, but we can discuss this further offline if you are interested.
Thank you, Najeeb. Well, that nearly brings us up to the end of our time and that seems to be the last of our questions, so maybe we'll wrap it up there for today. And just again a quick reminder to our audience, you can get in contact with our science team to discuss these details on quest literature in more detail at the email address. Scienceurfacemeasurementsystems.com Mei Chen, is there anything you'd like to add before we finish for the day?
No, that's all from me. And thank you very much for listening today. And thank you.
Yes, just to further that, thank you again to Mayeshan. I'm sure I speak on behalf of everyone when I say that was a fantastic presentation, so thank you so much. Just to let you all know about an upcoming workshop we have next week. This has been organized in coordination with the University of British Columbia. The title of this workshop is Zorchin Cyclops Innovations in Cellulosic Materials Characterization, and we are lucky enough to have Professor Orlando Rojas from the University of British Columbia here to present some of his own findings along with some of our own research. This is taking place on Tuesday 1st June next week at 5pm BST, which for those of you around the world is 6pm in Central European Time or 12pm in the Eastern Daylight Time, which is the time zone. The workshop will be taking place for the US So once again please we invite you all to join us for our online workshop with the University of British Columbia next week on the 1st of June Tuesday. So thank you all again for joining us this week. If anyone does have any more questions, please do send them through to scienceurfacemeasurementsystems.com or if you have any other queries, you can send them to myself@marketingurfacemeasurementsystems.com com thank you all again for joining us and wherever you are, have a wonderful remainder of your day. Thank you.
More from Prof.

Webinar: Advances in Measuring Gas and Vapor Permeation Through Membranes and Barrier Polymers

Webinar: Determining Solubility Parameters of Bacterial Cellouse Through Energy of Adsorption

Online Webinar: Recent Technological Advances in Adsorption Based Direct Air Capture

Online Webinar: Surface Area of Pharmaceutical Ingredients at Real World Conditions by IGC



Hybrid Workshop: Measuring Material Vapour Pressure Properties Using Advanced Sorption Technique

PCL Hybrid Workshop: Recent Advances in the Characterisation of Pharmaceutical Powders


Using Advanced Techniques to Test the Performance of Recycled Bathroom Tissue | A video summary
