Webinar on co-adsorption by Dr. Daniel J. Burnett
Dr. Daniel J. Burnett walks through vapor sorption techniques for drug materials, using a DVS instrument to measure how water and organic solvents like acetone absorb into polymers. He shows how carbamazepine forms different hydrates or solvates, how mannitol polymorphs shift, and how in situ Raman spectroscopy identifies which crystal form crystallizes under different solvents.
Questions this video answers
July 27, 2018
Dr. Daniel J. (Dan) Burnett — Director of Science Strategy, Surface Measurement Systems Ltd.
BSc in Professional Chemistry (Eastern Michigan University, 1997); PhD in Chemical Engineering (University of Michigan, 2001).
Allentown, Pennsylvania
science@surfacemeasurementsystems.com and info@surfacemeasurementsystems.com
Chapters
Good morning all participants. I wanted to welcome you all to today's webinar on advanced vapor sorption applications for pharmaceutical materials, utilization of coabsorption, isotherms and Raman Spectroscopy brought to you by Surface Measurement Systems. Today, our presenter will give a brief introduction about our DVS equipment, coabsorption experiments and in situ Raman spectroscopy. Our presenter is Dr. Dan Burnett. He's the Director of Science Strategy for surface Measurement Systems Ltd. Located in North American Headquarters, Allentown, Pennsylvania. His team works on research studies and science applications for many prominent companies. He has received his Bachelor degree in Professional Chemistry from Eastern Michigan University in 1997 and and a PhD degree in chemical Engineering from the University of Michigan in 2001. Since joining Surface Measurement Systems in 2001, he has continued his interest in sorption science and surface chemistry on a range of materials including pharmaceutical powders, natural and man made fibers, polymers, films and food flavor systems. Dr. Burnett has authorized or co co authored over 25 papers in peer reviewed journals and presented at numerous national and international conferences. During this presentation you may send us chat messages with your questions. Then at the end of the presentation Dr. Burnett will try and answer all your questions or if we don't answer your questions and we run out of time, we will contact you via email. Please welcome Dr. Dan Burnett.
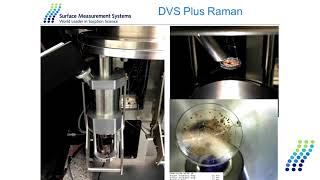
Hello everyone. Thanks for joining the webinar today and thanks Brad for the introduction. I'm going to move to my presentation and hopefully if there's any technical problems or questions as Brad mentioned, please use the chat feature in the gotomeeting and we'll address those in due course. So the outline of my presentation I will spend only one or two slides introducing DBs because this is not the focus of this talk and most people here are familiar with the technique. But what I'd like to focus on today is some of the non standard or non trivial applications in using some of the more advanced features, in particular co adsorption experiments looking at water solvents and dual solvent systems and also looking at the use of utilizing in situ Raman spectroscopy and more, further understanding how moisture or vapor interacts with pharmaceutical materials. So just as a very brief introduction to dbs, this is a schematic of the system. The heart of the instrument is a microbalance which can essentially measure very small changes in weight as we expose the sample to a steady and constant flow of air or nitrogen that is humidified or saturated to different levels with different solvents. In particular, the DBS Resolution Instrument has two solvent solvent generation channels. Each are independently Controlled with their own feedback loop with their own sensor. If it's for water, we have a humidity sensor. If it's for organic solvents, we use an ultrasonic sensor to measure and control in real time organic vapor concentration and delivery. So the vapor, whether it's water or organic solvents, is generated upstream, then delivered to the sample while the balance is constantly monitoring the mass gain or mass loss as we expose to increasing or decreasing levels of vapor concentration. And the typical result, and the typical isotherm is something that I have here with this overlay graph. So those of you familiar with DBS instrumentation, the solid red line is the kinetics or the mass change as a function of time. Typically what's done in an isotherm experiment is the humidity or vapor concentration is increased in discrete steps and then until equilibrium is established. And then from the equilibrium points on the adsorption or desorption, we can then calculate the adsorption in solid blue and desorption in dash blue isotherm. So this is the standard experiment that most people are very familiar running. In particular this happens to be water absorption on a polymer film. Looking at water coming on, water coming off, and then you get the water content as a function of relative humidity. So to expand on the let's say routine or typical applications of the dbs, I'd like to focus on a couple case studies. In particular, the first one is going to look at some common pharmaceutical polymers or excipients that may be used as a spray dry matrix. And very often with new spray dry applications. These solvent systems can be quite complex. Not just spray drying in water, but spray drying in organic solvents or even a mixture of organic solvents in order to get the desired properties of the final formulation. In particular perhaps stabilizing an amorphous API in the various polymers. So what this I'm going to walk you through is a series of experiments. This happens to be on a BA64 or a type of collidome. And this is your standard water absorption experiment. So here is the kinetics, water absorption on water, desorption water off. From the adsorption desorption kinetics we obtain the adsorption in red and desorption in blue. This is the water absorption for this VA 64 polymer. One thing we can note is that the polymer is fairly hydrophilic, has a maximum weight gain of about 30 weight percent when exposed to 90% relative humidity at 25 degrees C. Same experiment was done on the same polymer for acetone. And we can see that acetone vapor Isotherm, adsorption, desorption. We certainly note on the desorption side, the kinetics are significantly slower and in fact significant amount of acetone is trapped within the sample and does not come out under the conditions that were done here at 25 degrees C in flow and nitrogen. And here we can see the acetone absorption, desorption isotherm. And again there is a significant amount of acetone that is remaining dissolved or trapped inside the polymer. So we wanted to look at, in a competitive situation, how would the presence of water affect the acetone absorption properties for this material? Most likely you can see acetone at the low end is relatively low until we get to about 40 to 50 above 50% P over P naught, you see a large increase, maybe due to a solvent induced glass transition or some phase change is most likely occurring as the acetone penetrates the bulk and then gets trapped inside the polymer. So this series of experiments is now we have in a co adsorption situation. So what's done in these experiments is there's a background relative humidity and then acetone vapor is introduced on top of the background relative humidity. So for instance, in this red experiment, the background relative humidity is maintained at 10% relative humidity. Then the acetone vapor is increased in 10% steps until we get the adsorption isotherm. And that's done at 10% relative humidity. Another experiment at 20% relative humidity in blue, and a third experiment at 30% relative humidity in green. And what we can see is that when we compare this to just the raw isotherms, and this is a little bit busy, but let me just remind you, this red line is water absorption. The blue line is pure acetone absorption. And then the green, lighter blue or cyan and pink are now acetone absorption in the presence of water. So when we have pure acetone, let's say at 20% P over P naught, the sample only picks up maybe 3, 4 weight percent. But then when we have acetone present, we can see that. I'm sorry, when we have water vapor present at let's say 10% relative humidity, we can see now the acetone uptake increases significantly and so on and so on. When we get to 20%, it even goes higher. At 30% relative humidity, the uptake decreases a little bit, most likely because you're competing for the same sites. So by having water present, you're most likely making the material more plasticized and it's able to pick up more acetone vapor in the presence of moisture than in not the presence of moisture. So this is on this VA 64, which is a relatively hydrophilic polymer. Similar experiments were done with an HPMCAS polymer, another relatively common pharmaceutical type of polymer. And the same exact experiments were done again. This is at 10% relative humidity, this is at 20% relative humidity, and this is at 30% relative humidity. So we're looking at the acetone isotherm in the presence of moisture. And if we compare that, we see that the pure water isotherm for this HPMCAS is much lower. So it's only about a 5% uptake. So it's much less hydrophilic. We don't see a big phase change or anything like that. When exposed to water vapor, the cyan is the. I apologize, it's a little bit off here. This one is the pure acetone, this is pure water. And we can see that. And when we add water, we actually decrease the acetone because we're not seeing that water is introducing a phase change which is allowing swelling or other things to happen. We're now looking at water and acetone competing for the same parts of the polymer. And by actually having some moisture present, we see a slight decrease in the acetone uptake. So we can see that by changing the relative concentration or the different vapors and different solvents. We can further investigate more complex spray drying applications when you might have dual solvent systems present. Switching gears to another type of dual solvent or competitive solvent application. Here we're looking at carbamazepine, a very common API. And it's well known when you can produce it in the anhydrous phase. It will form a hydrate when exposed to water vapor. So this red line is water absorption, this blue line is desorption. This hysteresis is due to the formation of a stoichiometric hydrate. Acetone will also form when you can produce carbamazepine in the anhydrous form, we expose it to acetone, it can form a solvate. So acetone can form a one to one solvate when exposed to acetone vapor. So the question we wanted to look at to see is which one might be preferable if both acetone and water were present at the same time. So we utilize the use of in situ Raman spectroscopy to help us learn a little bit more about the hydrate formation, the solvate formation, and which one might be preferred when both are present. So the in situ Raman is a linocyte Raman. So we can, using a fiber optic probe inside the DBS Instrument, we can get direct line of sight to the sample. So while the sample is being exposed to different vapors, we can then measure the in situ Raman spectra. So we did that. This is just the dried carbamazepine sample as a baseline. This is the anhydrous from 0 to 30% water absorption. A little bit of difference. You see some increasing just due to most likely water surface water. And we can look at the full 0 to 90% relative humidity. And we do see some changes in the Raman spectra, but we don't see any shifts, let's say in the bands or the peaks. So we do see an increase due to perhaps the hydrate formation, but we don't see any shifts in the location of these peaks or the presence of any new peaks. The same experiment was done for acetone. And then this is again the dry acetone on the dry carbamazepine sample. And then when we expose it to high acetone concentrations, to the naked eye you might not see it, but we do see some shifts in the Raman spectra, particularly in this range here and up here. So if we blow these areas up, we can look at the different spectra between carbamazepine at 0% acetone partial pressure and at 90% partial pressure. And we do see some different peaks that begin to form with or without the solvate being formed. And it'll become a bit more clear in the 2900-3100 range in the Raman spectra. And we can see a clear and distinct shift in some of these peaks. So the blue line is at 0% partial pressure of acetone and the green line is at 90% partial pressure of acetone. So we can certainly see in particular this range here and over here the formation of some unique Raman spectra peaks due to the formation of the solvate. So that was with pure water and pure acetone. So we wanted to see if we created one and then exposed it to another vapor, which one might be preferable. So we first created the acetone solvate and then we. So we form the solvate. We confirmed that the acetone does the acetone does form the solvate. And we see that here. And then again, just a word. If anyone's online, they might want to mute their microphone, so that would be helpful. So again, we have the acetone solvate formation here. We have confirmation of that in the Raman spectra. Then we took the same sample, still exposed to the acetone vapor, and then expose it to water vapor. And what we see is when we expose it to 10 or 20% relative humidity, we see a large decrease in mass, most likely from the gravimetric data. This might suggest that the hydrate is replacing the acetone solvate. So acetone has a higher molecular weight than water. So if we're replacing the solvate with a hydrate, we would expect a net loss in mass. And in fact we see that here. But what we can then do is look at the Raman spectra to help confirm or deny or support this, this gravimetric data. And that's what we do. In fact, C is that when we have for reference again, it's a little bit busy. I'll show a slide or two in a bit that'll make this a bit more clear. When we have the acetone vapor present, we can see the formation of the solvate. But then when we expose it to water, we can see it goes back to what looks like the hydrate form. So we can see again this is when we have the solvate formed. We take that example and we expose it to the acid, to the water vapor. And the Raman spectra does support that the hydrate is preferred when both are present. So this might suggest that the hydrate is more stable or thermodynamically preferred versus the solvates. So this is an example of where the gravimetric data shows you some information, but the combination of the in situ Raman helps confirm what you think is happening. So I wanted to move on to another example of using Raman spectroscopy and again looking at polymorph conversion. We were looking at some mannitol. Mannitol is able to be formed in three different polymorphs. The beta form is considered the most stable. We did the water absorption and in situ Raman on beta mannitol and we can see we did not see any structural changes. As we go from 0% humidity up to 90 back down to 0, all the spectra look the same. So we didn't see any polymorphic change due to water absorption on the beta mannitol, a mixture of alpha and beta mannitol. The gravimetric data again doesn't suggest any visible changes in it. And the Raman spectra does show the formation, does show the location and the presence of the alpha form and the beta form. But we don't see any structural changes as we go from 0 to 90 back down to 0% relative humidity. The alpha and the beta are both relatively stable. They're not converted just due to water vapor at 25 degrees C. So the delta form is known to be the least stable form of mannitol. And when we expose it to 95% relative humidity, we did start to see some instability that may suggest a slow transformation when exposed to 95% RH. However, in the Raman spectra it's very difficult. We did not see the strong formation of the beta present, we just saw the delta. So we wanted to see if we chose a different solvent, could we force this transformation to occur faster or more pronounced. So we used some ethanol. We expose the Delta mannitol to 95% partial pressure of ethanol at a higher temperature at 45 degrees C. The gravimetric data suggests this might be a bit faster transition. And then in fact, when we looked at the Raman spectra, we do see when we look at time resolved spectra. So we exposed it to 95% partial pressure of ethanol at 45 degrees C, took spectra over time. We do see that the distinct beta peak, this black spectra is the reference beta spectrum. We can see the growth in the beta phase. We do see that the Raman spectra, although the gravimetric data maybe hints or suggests at that, the Raman data is able to confirm that we're converting the unstable delta form to the more stable beta form at these conditions. So my final example, before I pause for any questions and wrap up in this relatively short webinar, is to look at crystallization phenomena using the in situ Raman. So what was this experiment was a. This happens to be on a catalyst material what is put into a solution of ethanol. And the then we dried the sample and this particular catalyst has the ability to form four different polymorphs when it crystallizes. So what we did just for reference, again, the sample was in liquid form. So the sample was completely in a ethanol liquid form. And then we stepped down the ethanol concentration going from 95% or wet all the way down to dry. And we looked at both the video images. You can see as this solvent evaporates, we're left with a powder material or a residue at the end. And what we then did during this experiment was also collected in situ Raman data as the solvent dried and looked at the spectra of the resulting residue after the sample crystallized. So again, here's just an overview a little bit better view. This is 95% ethanol. What you're seeing here is the Raman probe that's in line of sight. So we're looking at taking pictures from below the sample and this is the Raman probe above it. But here at 95% partial pressure ethanol 60%, 55 you really see it start to dry. And then at 0% partial pressure of ethanol, we then see a residue is left on the sample pan. And we did look at the reference spectra of pure ethanol for comparison. And we can see as the Raman spectra indicates, we go from a 95% partial pressure of ethanol. The signal looks mostly like ethanol at the beginning of the experiment. Then at the end of the experiment, we see all of those ethanol peaks and features are removed from this spectra. And although this may look to the naked eye as just noise, at the end we can do some background subtraction and correction to get an actual Raman spectra of the final residue that remained after the sample crystallized. And if we blow up in this area here, we were actually able to identify a distinct peak. And this peak was able to be compared to the reference spectra of the four different polymorphs for this particular catalyst. And we were able to identify again, the sample is known to crystallize into four different polymorphs. And due to the spectra in the 2200-2300 range, we were able to identify which polymorph was crystallized under these conditions. So again, the combination of the Raman experiment was quite useful to identify the preferred polymorph to crystallize under the conditions that were measured in this experiment. So to wrap up this brief webinar, the DVS is more than simply water absorption isotherms, although that is the main application for the instrument and is used quite readily for that. The combination of co adsorption to solvents or water and solvents, we can look at solvent anti solvent crystallization, spray dry solvents, hydrate, solvate, stability or formation. And then if we combine that with in situ Raman spectroscopy, we can confirm or rule out different hydrates or solvates that are formed, look at polymorphic identifications, look at crystallization and kinetics of crystallization, and also look at more subtle phase changes that might not be directly measured by the gravimetric data. So with that, I thank you for your time. And if there are any questions that I can answer, maybe Brad could help me out with that or we can certainly provide any answers. You can email me directly or you can email us at scienceurfacemeasurementsystems.com or our general email, which is inforsurfacemeasurementsystems dot com so I'm going to go back to the gotomeeting and Brad, if there's anything that I need to answer at this point, I will let you Take over.
All right, so I haven't gotten any questions throughout the meeting, but if there's any questions, now would be the time to ask. Is there any questions from anyone?
You can use the chat feature here or you could potentially unmute your microphone and ask a question. That would be acceptable as well.
So it looks like there's nothing coming through as of yet. So not related to pharmaceuticals. Is that okay?
Any question at. I'm just posting, you know, scienceurfacemeasurementsystems.com if there are any questions offline. But yeah, Aaron, if you do have a question that's not related to pharmaceuticals, go ahead. What can we answer for you? The question is, sure, I have some spikes that appear in my absorption curve. What could be the cause? They haven't seen spikes before. This is. Without seeing the data, it'd be a little bit hard for me to answer off the cuff. But you know, obviously there can at times with some materials, some materials can be more static prone than others, which can look like noisy data at times. Obviously if it's, you know, someone bumps the instrument, that could cause that as well. My suggestion, if you are able to, and your IT department and legal department will allow, if you want to email the data file to our science team, we could look at it in detail and then get back to you with some suggestions. I mean, if it's because we can tell if the noise looks random or if it's something due to the sample or static or if there is an increase followed by a decrease, sometimes that's related to a phase change. But I would recommend you email us the data file so we could perhaps, or maybe if you can't send a data file, maybe at least some screenshots of what the data looks like, we could help you out with that.
Are there any other questions? If there are no other questions, I want to thank everyone for joining us today. We hope you found today's topic useful. If you wish to know more about surface energy and DVS products or any of our other products, please visit our website at www.surfacemeasurementsystems.com for more info or email us at inforsurfacemeasurementsystems.Com do you have.
Any thoughts.
Do you have any thoughts on quantifying the relative amounts of water and organic solvents in your sample?
Yeah, that's a very good question. Obviously all we are measuring in just a regular DBS is a mass change. So when we have two solvents present, there's no way to know if it's one solvent versus the other, what we typically do when we're doing these experiments is keep one solvent constant and then we vary the other solvent. So we would keep a background of the solvent 1 and increase or decrease the solvent 2. So that way we could get a better understanding of which one is causing the increase or decrease. It depends. I mean, some of the times if you combine it with Raman spectroscopy, you can see some gradual increase in some of the peaks as you pick up water vapor or other thing else. But water is pretty Raman inactive. So if the solvent is Raman active, you might be able to use the Raman spectra to help look to see what is causing the mass change or mass loss and which solvent it's related to. Obviously, quantifying Raman spectra to amounts typically uses some chemometrics to get to that, but it is possible, but not as direct. So it's a very good question, and I don't have a perfect answer for you, but if the solvents are Raman active, that could give you an indication of which ones are on the surface. If not, we would just typically only bury one solvent at a time.
All right, so that looks like it concludes our webinar today. So again, thank you everyone for your time and hopefully it was helpful. And if you need anything else, please email us.
All right, thank you guys. Have a good day. And feel free to email us any questions offline. We'll be happy to answer them. Bye.
More from Prof.

Webinar: Advances in Measuring Gas and Vapor Permeation Through Membranes and Barrier Polymers

Webinar: Determining Solubility Parameters of Bacterial Cellouse Through Energy of Adsorption

Online Webinar: Recent Technological Advances in Adsorption Based Direct Air Capture

Online Webinar: Surface Area of Pharmaceutical Ingredients at Real World Conditions by IGC



Hybrid Workshop: Measuring Material Vapour Pressure Properties Using Advanced Sorption Technique

PCL Hybrid Workshop: Recent Advances in the Characterisation of Pharmaceutical Powders


Using Advanced Techniques to Test the Performance of Recycled Bathroom Tissue | A video summary
