Webinar: Polymer characterization by Vapor Sorption Methods with Dr. Daniel Burnett
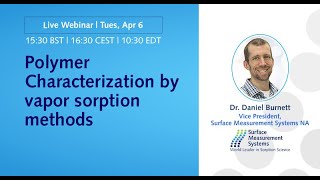
Dr. Daniel Burnett explains how vapor sorption methods measure polymer properties like moisture absorption, swelling, and glass transition. Dynamic vapor sorption and inverse gas chromatography reveal surface energy, diffusion rates, and how solvents change material behavior at small scales.
Questions this video answers
Typically from about 1 mg up to 5 g (commonly 1–100 mg for routine runs).
Instrument supports humidity generation up to ~95% RH and temperatures up to 85 °C (water reservoir limited to 85 °C).
Typical specification is 0 to ~90% (P/P0). Temperature must be at least ~15 °C below the solvent boiling point to operate safely; very low vapor-pressure solvents may be difficult to reach high concentrations.
Chapters
As the talk indicated, today I'll be focusing on using vapor absorption techniques to characterize polymers, both surface and bulk properties, using both gravimetric and chromatographic techniques for that. So the bulk of the presentation will be an applications focused session. I won't spend too much time going into instrumentation and or theory. If you have questions that arise, as John mentioned, please put them in the chat or ask me at the end of the talk. Just to set the stage of where vapor absorption techniques fill in the landscape in terms of solid characterization, I typically like to show a slide similar to this to just set the groundwork of where vapor absorption techniques fill in your characterization toolbox. This obviously does not cover all physical characterization techniques, but in general you can use energy as a probe, like X ray, light, lasers, etc. Heat as a probe, where you're looking at heat gain, heat loss, heat transfer. This is all energy transfer. Where vapor absorption techniques fall into a line is where we're using molecules as a probe. So we're going to use the interaction of a vapor in our case of what I'll talk about today. But this could also be gas or option techniques, whether they're volumetric or gravimetric or chromatographic or whatever they may be. But we're looking at mass transfer. So we're going to use how a molecule interacts with the material to learn about the thermodynamic, chemical and structural information about the material of interest. So just to get some terminology here, we're going to use in my little cartoon here we have our sample. This could be a fiber, a powder, a film, a granule, a monolith, whatever it may be. But we're going to introduce some vapor molecules. They are going to interact with the surface. They can either adsorb, which means they are located only on the surface of the material, or they can absorb, which is basically they're going into kind of a pseudo solution where they dissolve into the bulk of the material and then eventually they may or may not desorb. So we're looking at how a molecule adsorbs or absorbs. There's different types of adsorption and absorption. I won't get into that. And then how they can then be released or not released. And that's how we're going to probe and investigate both surface and bulk properties of polymer materials. So SMS does this in two main techniques. One of those is a gravimetric technique that is based on a microbalance. And essentially what we do is we introduce a vapor to a sample that Is suspended on a microbalance in a fixed temperature enclosure. Typically, what's done is you have a carrier gas like dry air or dry nitrogen that continuously flows across the sample. And then that carrier gas is humidified or partially humidified to the desired levels or partially saturated. If we're using organic solvents, this is showing a schematic where we're looking at water vapor, which is the predominant vapor that people study in this gravimetric technique. But we can use organic solvents such as octane, acetone, benzene, toluene, Any wide range of organic solvents. But typically a step change is made in the concentration in the flow of the particular vapor of interest. And then we're measuring a mass change as we change the vapor environment survey surrounding the sample. So the primary measurement that we're actually doing is a mass over time. And then we change the conditions that the sample is exposed to. And in general, most of the experiments what people are doing is what this graph is showing here. It's a little bit busy, but I'll show you. This is on a nafion proton exchange membrane, Just a polymer film. Typically, what's done is you have the solid red line, which is the mass response as a function of time, and then the dashed orange line is showing the relative humidity that the sample is exposed to. So we dry the sample, expose it to a certain relative humidity, measure the mass change, and so on and so on. When we're doing an isothermic, we want to wait until the mass reaches equilibrium, and then from these equilibrium points, we can construct the absorption isotherm, which is in solid blue, and the desorption, which is in the dashed blue line. So from this single experiment, we can fully characterize the vapor absorption properties of this material at these conditions. And then the isotherm shape, size, location and or hysteresis, which is the difference between the adsorption or the adsorption and desorption branches of the isotherm can give us structural, chemical, and stability information of the material of interest. So in addition to the gravimetric data, it is possible to hyphenate the DVS instrument with a variety of other orthogonal techniques. So, for instance, this is showing a Raman probe and a in situ video camera. So we can get spectroscopic data and visual data during the vapor absorption experiment. So although the primary measurement is the mass, we can couple these other techniques to hyphenate the technique, the measurements, to get more information as you expose it to different vapors. So here is just showing a pellet at 0% relative humidity. This is at 95% relative humidity. And you can see, whoops. You can see that it is swelled and you can see how this changes dimensions. And we can have calibrated scale markers and grid lines to actually quantify the degree of swelling or the dimensional change as we expose the sample to different vapors. Here we're looking at a PMMA on the right at 90% relative humidity after only 30 minutes. But after 18 hours you can see that it has changed significantly. We may see some responses in the mass change that might indicate some sort of phase change, but the visual data confirms that. And then also we can use it to quantify volume changes in addition to the mass changes. There are a few options that are fully integrated both hardware and software to the dbs. As I mentioned, we have video microscopy, Raman spectroscopy, we also have near IR spectroscopy and we have high temperature drying if you have to pre dry or pre treat or activate a sample up to 200 degrees C. In our flow based systems, we have other customers who have done some other hyphenization options. These are not fully integrated into software, but we can provide hardware integration in terms of IR temperature measurements. If you want to measure a physical temperature change in the sample as it's exposed to different vapors. If you want to look at UV light source to see if there's any degradation or activation that's necessary, you can integrate a UV light. We can restrict the flow to make a more narrow flow to increase the laminar flow rate if that's of interest. And we can also integrate a mass spec to not only get the mass change, but we can also look at the chemical nature of the species that might be adsorbing or desorbing from the material. We also offer a wide temperature range, so we can do water absorption experiments up to 85 degrees C. And this is just showing the temperature control or the humidity control in blue. When we have an additional heated reservoir that allows us for extended and full humidity range experiments all the way down from 5 degrees C all the way up to 85 degrees C. So it's possible to maintain and Control well above 90% RH up to 95% RH at high temperatures up to 85 degrees C with this temperature heated reservoir to extend the humidity generation range of the instrument. So now that I've briefly gone over the hardware, now moving on to the actual measurements, what you can learn from your materials by doing vapor absorption experiments. As I mentioned, the traditional or the classic experiment in these is to measure the Isothermic. From that isotherm shape, it is possible to learn about how that molecule is interacting with the material. These are the classic what's called the BDDT isotherm types. These have been updated more recently, but in reality these are really typically from. These really only describe surface adsorption. So it's only when the molecule lays on the surface and does not dissolve or swell or interact with the bulk of the material. It also assumes that the solid that you're investigating is not changing as you expose it to the gas, excuse me, or the vapor species. For polymer materials and amorphous materials, many of these models will not apply. Even though the isotherm shape may look similar, these models do not apply. And all of these surface adsorption models, although they are very common and they are used widely in particular things like the bet, which is for surface area and I'll talk a little bit more about that later, the gab, these are very common models that are used in particularly with water absorption. However, most of these models, or all of these are assuming that the vapor interacts with the surface only and the material is not changing as we expose it to moisture. In reality, most real world amorphous materials or polymeric materials, and I'm going to say broadly polymeric, to classify things like, or amorphous materials, you know, even things like proteins or amorphous disaccharides or food materials, cellulosic materials, most of these things essentially behave like a polymer. And although the water absorption curve, if we look here, this may look very similar to a type 2 isotherm. It has the classic shape, a knee with a plateau and then an upswing. However, this shape is misleading. This is not due to just surface sorption in particularly for some amorphous materials, the initial uptake is relatively low because the moisture is only interacting with the surface mostly or the first few layers. But then water is actually changing the material. Water can plasticize. It's a very strong plasticizer for in particular many low molecular weights or organic polymers. And now they can go from the glassy to rubbery transition. And you can get a very large uptake because now the moisture is deeply penetrating into the bulk of the sample. So we can get kind of this shape which may look like a type 2 isotherm. And unfortunately, if you apply a lot of those surface adsorption models, you can get results, but the numbers are not really indicative of what's really happening. Like a surface area you may get from that because it's a bulk absorption dominated Process, not a surface option, dominated process. So just a word of caution. Just because the isotherm looks like the right shape, it does not mean it's surface sorption only. In particular, with complex organic and or polymeric or amorphous materials, very often the material itself is not in equilibrium because the material is changing during the experiment. To combat that, there are several polymer solvent model isotherms that are available in the literature. Here's just a few of them. Some of these try to address these transitions, but all of them have pluses and minuses and certain assumptions. So as with any isotherm model, please use caution and make sure you're applying the correct model for the correct system. So just very briefly, in addition to the equilibrium data, so if we go back to my plot here. So the isotherm is really a measure of the quote unquote equilibrium data. So when the water is at equilibrium with the solid, we also get real time monitoring and measuring of the kinetic data. So each step change in relative humidity or partial pressure organic solvent, we can measure and investigate the kinetics or how fast or how slowly does the vapor go into or out of or onto or off of the sample. So in particular to polymer films, at each step change in relative humidity, it is possible to measure a diffusion coefficient. Here is just a summary of some data taken on a napion material. This is N117. It's a thin proton exchange membrane film. At each step change in relative humidity, we're able to determine the diffusion coefficient. This is the how slowly that vapor is going into the film, not across it, I'll get to that later. But into the film. And we can see this was done at several temperatures ranging from 30 degrees to 80 degrees C. As you would expect, you go up in temperature, you see the diffusion coefficients increase higher temperature, faster molecular mobility within the polymer. And we also see this overall shape. Whereas you typically get a critical maximum in diffusion coefficient. What happens when you it doesn't, you would think higher humidities, higher diffusion coefficients, bigger gradients. However, what happens is that as the polymer gets swelled, you actually get diffusion going down because the polymer is swelling and swelling and the void spaces are changing and the diffusion into it actually slows down. When you get to very high humidity because the material becomes saturated, there's nowhere for the water to go. Just showing some other data. This is looking at some other films over a broad range of temperatures. These are just 5 millimeter by 5 millimeter and 170 micron. Pardon my mistake there micron thickness of the Film. And you can see we can measure the kinetic adsorption, desorption and isotherms at 20, 40, 50 and 80 degrees C. And from that data we can construct the isotherms which you see here. So this is actually showing all the way down from 10 degrees C up to 80 degrees C. And we can see as you go up in temperature, you actually see an increase in the water uptake. Now if this was purely a surface sorption phenomena, then you would, as you go up in temperature, the uptake would go down. But this is a bulk dominated absorption phenomena because basically as you increase temperature, solubility goes up. So this is just to prove and it also highlights the fact that for polymeric materials and amorphous materials, you often have a very significant bulk absorption contribution. This just proves it because as you go up in temperature, the water uptake increases, whereas if it was surface sorption, water uptake would decrease. And here we're just looking at the complete isotherms for this, for the study. So we can use the fact that water or other solvents can act as plasticizers to actually look at the exact conditions that will cause this either glassy to rubbery transition or this amorphous to crystalline transition. As I mentioned previously, if you are well below the TG or the glass transition point of a material, the molecules will typically interact mostly with the surface of the first few layers. As you approach the glass transition, you see the molecules begin to dissolve and interact significantly with the bulk and you'll see slower kinetics and a larger uptake. If the material was able to be recrystallized, then you can see that it would again just go to surface adsorption from there. So to highlight that or as a way to pinpoint these transitions as you expose a sample to different relative humidity or vapor concentrations. We can see that by video analysis. So this is looking at an amorphous lactose and this is at 0% relative humidity. It's a fluffy powder. At 50% RH, it is now collapsed. And then if we expose it to further relative humidity conditions, you can see that it actually recrystallizes. And we can get that from the water absorption data as well. If you want to pinpoint an exact transition, instead of doing step changes in relative humidity, we often do a linear ramp in relative humidity. So we can draw an analogy if like a DSC experiment where you want to do a linear ramp in temperature to pinpoint the temperature at which different phase changes occur. Here we're doing kind of an orthogonal Experiment where we're at a constant temperature, so we keep the sample at a constant temperature. Then we do a linear ramp in relative humidity. That's this blue line. We can see that the mass response is nonlinear. Although this is a monotonic linear increase in relative humidity, we see a complex absorption behavior. And the reason for that is the material is changing at low relative humidities. For this amorphous material, we are dominated by surface orption. As the water plasticizes the material, we see this large increase in uptake, and that's due to the significant bulk absorption contribution. And we can pinpoint that exact transition point. And then for this particular material, water is such a strong plasticizer that it causes it to recrystallize. And that's shown by this net mass loss because the crystalline phase has a much lower water capacity than the amorphous phase. So we can do these experiments over a range of temperatures and we can kind of get a relative humidity and temperature phase diagram for the stability or relative stability for these amorphous materials. This was the moisture induced glass transition as a function of temperature. So at 20 degrees C, 35% RH was enough to plasticize and go through the glass transition. At 50 degrees C, it only needed about maybe 18% relative humidity to go through the glass transition. And then this is where it will spontaneously recrystallize. So at 30 degrees C, the sample will spontaneously recrystallize at around 56% relative humidity. In between these ranges, it's just kinetically limited by the material. So once I'm above the glass transition, it's only a matter of time. That time scale will significantly depend on how far apart these regions are and how close you are to the spontaneous recrystallization point. However, if I keep my material below the amorphous or the glassy to rubbery transition, the quote unquote stable amorphous region, the material could be quite stable for quite a long period of time. Because if you keep it below these temperatures and then below these humidities, molecular mobility will be so low that it's relatively stable for a longer period of time. As we all know, amorphous materials by nature are metastable. So, quickly finishing up the few more slides on the DVS portion of this. As I mentioned, we can get kinetic information based off of step changes in relative humidity. This is for diffusion into a material, whether it's a single sided or double sided film. We can get the diffusion coefficients. That's just by modeling the uptakes during this transition range as we go from one humidity to the next. We can fit it with a simple Fician first order diffusion and get the diffusion coefficients. We can do this at a wide range of temperatures. So if we're looking at microelectronics packaging, that might have to go to 85 degrees C and 85% RH. We can do that for both adhesive films and or packaging materials. We can also do it for other packaging applications. For instance, this is a blister package. This is one way to do it. You can put a zeolite or a moisture getter or some sort of desiccant on the inside of the blister pack, then make a step change in relative humidity and measure the flux going through the packaging material. And that's what's done here. If you want to do some more detailed flux experiments on some membranes or barrier materials or films, we do have what we call our pain cell, which is to measure flux or permeability across a film. So the previous results that I showed here is for diffusion into a film. That's into the film here. If I want to measure flux across a film, we have this little cell where we can put our material of interest. It's held between 2o rings. Then on the inside of this cup, we can put again a zeolite, a drying agent, a silica gel, carbon black, something with a high moisture capacity. Then we can expose the outside to a certain relative humidity and look at the flux across that. And we can measure that by the weight gain. And this can give us the moisture vapor transmission rate directly on a small scale, using relatively small samples that are easy to handle. We also can run this in what we call wet mode, where you put water on the inside or some other solvent on the inside. And then we're measuring mass loss. And this would be kind of like transepidermal water loss. You could use a skin sample. You could again use some sort of packaging. If maybe I'm looking at flavor loss through a packaging application, I could look at the mass loss over time as I exposed it to different conditions and temperatures. So this is just showing a couple examples on some different films. Like I said, you could use skin materials for looking at transepidermal water loss. Silicone, polyurethane, carbosil. Each of these will have different flux rates. And we can measure that directly since we know the cross sectional area of the exposed film. And then we can directly measure the mass change. And here we can see with this, it is a function of both the humidity, so we can see different water Vapor flux rates, as you would expect. As you go up in relative humidity, you see the increase, the driving force increases the flux rates. And we can also check different thicknesses. So this is looking at basically just one membrane and this is two membranes stacked on top of each other. To illustrate the effect of. Not only here we show the nature of the film, but also the thickness of the film can affect the results. I didn't get into it into the hardware section, but I wanted to briefly highlight. And as I mentioned, you can do water and or organic solvents. We can also do a combination of two solvents at the same time. In this particular study, we are looking at a Kapton film and we wanted to measure the flux of, of methanol whether we had dry conditions. So we first exposed it to a certain methanol concentration. While we're at 0% relative humidity, we can measure the flux of methanol under dry conditions. Then we increase the relative humidity to let's say 20% RH, then measure the flux again. So we can see if moisture is plasticizing the material or affecting the the barrier properties of this particular film. So we can see this is methanol diffusion under dry conditions at 0% relative humidity. So we put methanol on, put methanol off, then we put water on and we keep the water constant. Then we put methanol on again. And we can see here that the flux when we are just in dry conditions versus when we have moisture present, we can see that the flux increases significantly in particularly when we're at higher temperatures, when we have moisture present. So clearly water is plasticizing the material. So when we have water present, we can see here in particular, from 25 to 45 degrees C, we see a significant increase in the water flux rate. That's because water is plasticized in the material these conditions. And that leads to a higher methanol diffusion or permeation rate at these conditions. This is just looking at some other packaging film blends, so doing different blends of different polymers. And then we can again measure the flux or the diffusion of the moisture through or across these films. We can also look at some coating applications. This is taken from the pharmaceutical area. So here we're looking at a tablet with different coatings and different thicknesses of coatings. And I won't get into all the details here. We have this as a separate study if you want some information. But essentially what we did is we just took a step change in relative humidity, so from 0 to 60% RH and we measured the Mass change. Here we can see this is the raw tablet that was uncoated. We can see the moisture comes up very quickly, then reaches equilibrium. And then these are different coatings with different types and or thicknesses of coatings. And as you can see, the rate at which moisture is taken up or absorbed by the tablet changes significantly. The slopes of these lines is directly correlated to the different coatings or thicknesses of coatings that are on these tablets. And since we know the exposed surface area of the tablet, we can calculate diffusion coefficients into the tablet based on the different barrier properties of the different coatings. So clearly these coatings have a strong effect on moisture absorption into these tablets. We could also do it on capsules or other types of coatings or packaging or encapsulation products. So I'm going to switch gears to inverse gas chromatography. I Hope the previous 20 minutes or so highlighted some of the applications, not all of them, that can be used to characterize polymeric materials by gravimetric techniques. I'm going to switch gears to the chromatic technique called inverse gas chromatography. It's still a flow based technique and we're still using vapors to characterize the material. In this case, we are going to take a column. It doesn't always have to be a column. I'll show you some film applications later as well. But there's a flow of gas, typically nitrogen or helium, that flows across the material of interest. Then we inject a vapor with known properties and we measure how long it takes that vapor to travel down that column. And from the retention time, we inject a small burst of vapor, see how long it takes to come down. And that retention time is based on how strongly that particular molecule interacts with that surface. And depending on what we change as the variable, we can vary the flow rate, we can vary the temperature, we can vary the chemical nature of the molecule. That will allow us to back calculate a wide range of properties of the material. Now, SMS didn't invent inverse gas chromatography. It's been around for quite a while. However, it is a relatively niche technique, but it is growing in significance. This is just a simple Google Scholar search of inverse gas chromatography citations from 1975 up until about a few years ago, 2019. So as you can see, it has grown and continues to grow in importance. There's well over 500 publications a year citing inverse gas chromatography in the literature today. So as I mentioned, it is a flow based system. Essentially we have Some sort of carrier gas. And then we inject a type of probe molecule, a vapor. We do a pulse injection of a small amount of that vapor that goes down to the column. We measure how long that takes to go through. And then it's all determined by a flame ionization detector. So here is a typical glass, cylinized glass column that we use. And you put in maybe 10 to 900 or 1000 milligrams. Between 10 milligrams and maybe 900 milligrams of materials typically used. We can put in fiber materials, granule materials, polymer beads, whatever we can fit into this. Our standard system has a 4 millimeter ID maximum. However, we do have configurations where we can get up to a 1cm ID column. If we have large, you know, chunks or rocks or for some reason need to put an extremely large amount of sample into the column, we can do that up to a 1cm diameter. Basically you put some small glass wool to hold in. If it's a powder or a granule or a bead. If it's a fiber, Typically that'll just stay in the column. But we can do things like glass fibers, hair fibers, carbon fibers, Anything we can fit into the column you can run. So by far, the inverse GC can measure a wide range of properties. And I will show you and highlight some of those today. By far the most commonly used one is inverse is surface energy. And that's related to the surface tension. Just like surface tension of a liquid, this gamma term is the surface energy of a solid. Solid. So why do I measure or what does surface energy affect? Why do we care about it? This cartoon I often show just to highlight some reasons why or what effects surface energy can have. If I have a model surface here and I put a drop out of a liquid or some other coating we can see, we can increase. As the surface energy of this material increases, I'll increase the wettability. If we're talking about a powder or a granule. If I increase the surface energy of this material, also increase the cohesive forces. So this could lead to things like powder flow or agglomeration or sticking. If I'm thinking of some sort of mechanical and or chemical treatment or blasting or some sort of process to a surface, not only do I make it rough, I will also increase the surface energy. Because I'm opening up buried defects, these have fewer nearest neighbors. I also opening up amorphous sites or other process induced disorder. So things like plasma treating or etching or grinding or milling, although they may be Used to reduce particle size or to do some other process to the material. They also can change the surface properties of the material as well. Then if we're looking at a formulation, we can look at how two materials stick to one another. One of the parameters is the surface energy that will determine the interfacial surface tension. So if everything else is kept the same, particle size is kept the same, morphology is kept the same. And if I increase the surface energy of these larger particles, I can overcome the cohesive forces of the smaller ones and I get to better surface to surface adhesion. In addition to those things, you have things like surface modification. You may want to do surface modifications for various reasons. You may have a low surface energy material, and I want something to stick to it, that could be a paint, that could be a coating, that could be something else. And I have to do some other chemical and or mechanical treatment to increase the surface energy. So therefore I get the desired surface. I want the other case. I might have a high surface energy system where it may agglomerate, it may stick. I don't want it to stick to something else. So therefore I have to passivate it by maybe silonizing or putting a low energy coating or silonizing it or something else to relax or lower the surface energy. So there isn't a good versus bad on a high energy versus a low energy material. So it really depends on what that surface is going to interact with and what the end process or performance of the material of interest. So in inverse gc, we can also get the not only a single value of our surface energy, we can also get a surface energy heterogeneity. As we know, real materials are energetically heterogeneous. So using a single value does not fully describe the energetic situation on the surface. Much like in particle size, a single particle size does not describe an entire powder. So in inverse gc, we can do a range of experiments over a range of surface coverages. And that allows us to get some energetic heterogeneity, which I'll show some examples of later. I won't go into the details of that now. If you have questions, you can certainly ask them at the end. So if we know the surface energy of a material, I can calculate the thermodynamic work of adhesion, which is the thermodynamic adhesion of that surface with another material, versus the work of cohesion, which is of that material with itself. And to highlight that adhesion to cohesion balance, I'm going to show you some example of Some nanomaterials, these are carbon nanotubes that have been as received or chemically modified, and some nanoclay as received and chemically modified and, excuse me, wanted to do some. The ultimate goal was to make some composites. This was done with our collaborations with partners at NIST several years ago. So they made the actual composites and tested the mechanical behavior. We tested the individual components to predict which nano fillers would be better fillers for a better composite. What the problem is with nanomaterials, they're very high energy. They have a tendency to agglomerate and stick, and they don't disperse well in the matrix. Therefore you don't make a good composite. So here we measured the surface energy. This is the nanoclay. This is the as received nanoclay. Very high surface energy, around 200 millijoules per meter squared. If it was functionalized with some isocyanate groups, you can see it significantly passivates the surface energy and decreases it significantly. For the carbon wall nanotubes, the AS received are relatively high. Again, 140. In this case, they're looking at an oxidation treatment. And the oxidation treatment actually increases the surface energy. And this is a surface energy of the polyurethane. So we measure the individual components, and from the individual components we can calculate the work of adhesion, which is a likelihood of the nano filler to stick to the polyurethane, versus the work of cohesion, which is a likelihood of the nano filler to stick to itself. And as we can see here, what's more important is this adhesion to cohesion ratio. The closer this is to one, theoretically the better that nanofiller would disperse within the matrix. So this is telling us that this functionalized nanoclay, because it has a much lower surface energy as it's been functionalized, and it's much closer to the surface energy of polyurethane. This should be a better nanofiller than the as received nanoclay. And based on the mechanical testing here, the tensile modulus and tensile strength of break, we can see in particular to this functionalized nanoclay, that we do see an increase in the tensile modulus and the tensile strength of break when we functionalize the nanoclay. So it disperses better and makes a better overall composite. So just to highlight, this is not work that we did. This is some work just taken from the literature. Just wanted to show you on some polymer fibers. This is on Kevlar and Xylon and wanted to investigate the oxygen plasmid treatment of the chemistry. Here you can see this is the full citation and I just pulled some data. I won't go into all the details, but this is basically looking again at some Kevlar and some Xylon with different amounts of plasma treatment. This is basically after one pass, this is after four passes and the same thing. And this is after was washed with ethanol. And the dispersive surface energy here increases and for both of these materials increases after it has been plasma treated. This is looking at the acid base properties as well. And you can see again, as I increase the plasma treatment as it goes through from zero to one to four passes, we do see an increase in the acid base treatment. It's just showing that plasma treatment increases the interaction with both the acidic and basic probes. So we're creating more functional groups. It's not surprising that we see an increase in the surface energy and the acid base functional groups on the surface. It is possible, as I mentioned previously, you don't have to just use a column. You can use a film. So if I have a planar material, whether it be, you know, paper, a polymer piece of metal, a macroscopic film, we have a film cell that allows us to clamp that material down, measure the gas interaction across the surface of that film, and then we can measure the surface properties of different film or planar materials. This is just looking at some Teflon that's been as is bleached and then treated with some nitric acid. And we can see this is the surface energy heterogeneity of both the dispersive and acid base components. And we can clearly see that the chemical treatment significantly affects the surface energy both on the dispersive component and the acid base component. In particular, we can see kind of as expected as we treat it with bleach or nitric acid, we significantly increase the acid base contribution to the surface energy. Moving away from surface energy. My last few minutes and hopefully have some time for some Q and A, we'll talk about a few other properties. I mentioned surface area in the very beginning when talking about DBS and most of those ways that people measure surface area. Water is a horrible molecule to use for surface area, particularly for polymer materials, because it doesn't just lay on the surface. Typically people use volumetric techniques because with nitrogen, nitrogen will lay on the surface and it's a good molecule for surface area measurements. However, you typically have to go down to cryogenic temperatures and very low temperature, cryogenic temperatures and very low pressures. Now, if you're using rigid materials like alumina, silica, activated carbon minerals like quartz or things like that, temperature and pressure really won't affect those materials. However, if you're doing polymers, amorphous materials, soft organic materials, the surface area and the these very low pressures and low temperatures can dramatically affect the morphology of the material. So we can do surface area measurements by IGC and dvs. I didn't show that. But the only thing you have to do is choose the right solvent. So we typically choose a non polar solvent that will lay on the surface. We have to find something that lays on the surface only and forms the right type of isotherm. So although this has its challenges with temperatures and pressures affecting material, we do have some method development to make sure we choose the right solvent so we get the right shaped isotherm. But the bottom line is we can do these at ambient conditions so we can do them at room temperature, room pressure. We don't have to go to these aggressive conditions that may affect. For some amorphous or polymeric materials where these conditions could dramatically affect the morphology of the material. And you can see we can get surface areas. This is on a bet. Standard 1.05 is the reference value. We get 1.01. So very well. Agree, good agreement. Same thing. A 2.95 meters squared per gram, we get 2.95. As I mentioned, we can do these at atmospheric conditions, so we can do them at room temperature. We can also do them as a function of relative humidity in the inverse GC. And here we can get a surface area at 0% RH, 50% RH, 80, 90% RH. So we can see how moisture may affect the, let's say the apparent surface area of the material. Water could coat certain sections of the material. Water could also change the morphology of the material. And then we can see how water may affect the apparent or the effective surface area of different materials. And very quickly I will finish up with two quick examples of some other applications. On polymers with inverse gc, it is possible to measure the glass transitions by igc. I wouldn't suggest that you go out and replace all your DSCs to do this. The only thing is that we are able to measure these as a function, a direct function of relative humidity. And we are measuring a pure surface tg. So if your surface is behaved differently from your bulk, since we're a surface dominated technique, we'll get the glass transition at the surface, maybe or a subtle glass transition that may be hard to pick up by dsc. We can pick that up. And secondly, we can do this as a function of relative humidity. So here, for instance, we're measuring the glass transition of a pvp directly at 45% RH. We don't have to seal a DSC pan and assume we're at the same conditions. We can directly control the relative humidity that the sample is exposed to and we can look at the plasticization effect of water. So here we're looking at the phase transit, the TG on a maltose sample as a function of relative humidity. And finally, we can determine solubility parameters by inverse gc. Again, I won't go into too much detail with that. I'm just going to just show, yes, we can do it. For those of you who are heavily interested in solubility parameters, we can provide some more information with that. But we can directly get both 1D and 3D Hansen solubility parameters by IGC. The critical value is the retention volume is directly related to the activity coefficient, which gives us access to the Florry Huggins interaction parameter, this chi value. And then from that we can get the Hildebrandt, which is considered the 1D solubility parameter, just gives you a single value, or the Hansen solubility parameters, which divides it into a dispersive, a polar and hydrogen bonding component. So we get three different values that add up to the total solubility parameter. And this is just showing it on. On a polymer. This was again just showing it. Here we inject different molecules with different types of interactions. We use dispersive molecules for dispersive component. For the polar component we use aromatic hydrocarbons, ketones, things like that. And then for hydrogen bondings, we typically use a range of alcohols. So we inject a range of molecules with a range of properties and that can then get us the hydrogen bonding component, dispersive component, and polar components of the solubility parameters. So I know I probably talked a little quicker than I would like, but I had a lot of information I wanted to get out to you today and I wanted to leave some time for some questions and answers. So I'd like to thank all of my SMS colleagues, both current and former, who have worked on these things. And this was a compilation of some data taken over many years and just to highlight some of the applications. Also some collaborators at NIST and collaborators at London Imperial College who helped contribute to the work I presented today. Finally want to thank you for your time and attention. And John, I'll pass the ball over to you so you can direct Me to any questions that may be at the end of the webinar.
We have a question here from Jamie Kropka and they ask what size that is. Mass and volume of sample can be assessed in the vapor sorption instruments.
Sure, that's a good question. Typically we don't use a lot of material. I mean, the balances that we use are very sensitive. So we can use small samples down to 1 milligram. We can accommodate samples up to 5 grams. So they're not for measuring at the moment. Large macroscopic 20, 40, 50 gram samples, we typically use a relatively small amount from down to about 1 milligram up to 5 grams. From a volume standpoint, the chambers have some different volumes and we can accommodate that. But roughly the chamber is about, I think it's about 30 centimeters in diameter and maybe 30 centimeters, not 30 centimeters, 30 millimeters in diameter and 30 millimeters high. So. But typically we're using relatively small samples from, you know, 1 milligram to maybe 100 milligrams. But we can go up to 5 grams for total total mass.
Okay, great question from Max Cementi. And they ask. You mentioned that the maximum temperature and relative humidity for your DVS instrument is 85 cel Celsius and 95% relative humidity. For the PEMFC research, it would be relevant to measure watersorption of proton exchange membranes at even higher temperatures, ideally even above 100 Celsius. Is there any option for. Any option for performing these even higher temperature absorption measurements?
Yeah, I mean, we do have requests for that and I didn't get into it. There is a possibility to locally heat just the area around the sample. We do have a sample preheater. We do it in some of our other instruments where that can be heated above 85 degrees C. However, we are limited in the current design of our instrument that the water reservoir, the maximum temperature for the water reservoir is 85 degrees C. So we generate moisture at. We generate humidity at 85 degrees C. We can deliver that at another temperature. But just be mindful that the upper end of the RH will be based on the saturated vapor pressure of water at 85 degrees C. So if I'm explaining this properly, you generate at 85 if the sample is above 80. If the sample's at 85, you can get the full range of humidity as the samples at higher and higher temperatures, let's say 110 degrees C, then the max RH, it will be lower because the absolute amount of water I'm generating is capped at whatever temperature the Water Reservoir is at 85 degrees C. Clearly we can't have the water reservoir above 100 degrees C because it wouldn't be water anymore. And for safety reasons we typically limit the solvents to be 15 degrees C below the boiling point of that particular solvent. So yes, it's possible, but we cannot get the full range in RH above 85 degrees C.
Thank you. A question from Daniel Shoukat. They ask, is it possible to measure the volume change of a polymer when we change the temperature by vapor sorption?
Absolutely. I mean one thing is to remember that with the camera we can get volume or dimensional changes. So if you recall back to the pellet example I showed you, you probably have to if you want to get absolute volume changes. Clearly we're only looking at one dimension. So this pellet has one dimension in the, let's say the radial, but also has a longitudinal. So you might have to do two experiments. You do one where if I have a material or maybe I can put two pellets on there at once. If I can, if they're small enough, one where I could get the X direction or the radial direction and the other one where I can get the L or the length direction to 100% get a better idea on volumetric changes. So number one, the changes would have to be significant enough that I can measure them with our microscope, which is not for, you know, it's only a 200x magnet, maximum magnification and we also have to be able to keep that sample in the field of view. So we've done things like, with like polymer films, like animation cells and looked at swelling rates. You could do swelling rates with other materials. As long as I can get it in the field of view of the camera, I can do it as a function of humidity and or temperature directly.
Thank you. A question from Abhijit IYA and they ask why do you use this method for the mass change method rather than something a technique such as quartz crystal micro balances related to frequency shifts.
We use a gravimetric technique like this because it can be widely used on powders, on fibers, on granules in general. The QCM microbalance with acoustic wave is typically used for a film coated on that. There are other ways to do that, but using a microbalance, although QCM can be more sensitive, I will give you that that it can typically pick up maybe lower mass changes, but it's typically not as directly related to or easy to run powders and other types of a wide range of morphologies and volumes of materials. Classically that's been limited to films, although there are other ways around it. But we use a microbalance way to measure mass change.
Okay. We have a request from Nassim Alakani to unmute themselves and ask a question. So, Nassim, if you would like to unmute yourself, you can ask your question to Dr. Burnett now. Hello.
Thank you so much for the presentation. I mean, for measuring the water vapor transmission rate using the cell that you call it like pencil. Yeah. Should we have a adsorbent like silica gel or something else inside the pencil? Because. Yeah, because. Because having a silica gel will change the equilibrium and other conditions. So how much silica gel or what is the details of using that? That's a good question. I mean, you are right. So we're effectively assuming that there's a 0% RH on the inside of the cell and we change the Rh on the outside of the cell. We found for a lot of materials, we typically like to use activated carbon if we can get away with it because it has a very high capacity. So due to the high absorption capacity, we often use some activated carbon on the inside such that effectively as soon as the moisture travels across the membrane, it's picked up by absorbent. We've also used some like 13x zeolite and some other things. They're a little bit kinder to use because they're beads and they don't get carbon black or activated carbon can sometimes be kind of messy. And I don't want that to touch the film. So that's. If you want, you know, directly, you can email us@scienceerpacemeasurementsystems.com and we can give you some suggestions of where we get some things out from Sigma Aldrich that we've used that are readily available. Thank you so much. And I didn't mention it, but it is possible to put that sample cup upside down. So if I actually wanted to measure water vapor transmission rates and I wanted or transepidermal water loss, I could have the water in contact or the solvent in contact with the film on the backside. So we have some customers in the contact lens area that are looking at hydrogels and they put water on the inside of that cell, turn it upside down, and then measure mass loss. So that way there's no gap or barrier. I don't have to worry about changing conditions on the backside of the film.
Yes.
Thank you so much. Thank you.
Thank you. Nissan. A question here from J. Werba and they ask, can The DVS instrument also be used to measure solubility parameters.
In theory? Yes, absolutely. I mean there are a couple different applications. I've seen a few papers in particular the Ventris theory has been able to do that. So yeah, you're absolutely right. The only downside of that is it's a relatively slow technique. So you have to get a full isotherm with a wide range of solvents typically. So you want to do, you know, several different types of solvents to get interaction parameters from a wide range of solvents. That can take time, but it is possible. It's not something we typically do or we promote just because it's over not all that easy. And there are a lot of assumptions in terms of the lot of input parameters that you typically need to know like molecular weight density and a bunch of other things that aren't always readily available. So yes, it is possible. There are a few papers out there where people use vapor absorption isotherms to back calculate solubility parameters or hints or cross link density or anything related to the Hildebrandt solubility parameters, Hildebrandt interaction parameter which you can directly get from an isotherm. It's just time consuming and there are some typically, some input parameters that may not be readily available unless it's a common, common property. So it's good question and yes it is possible, but it's not something as practical that we, that we do a lot of work with.
Great. I think we have time for just one last question from Rana Nair and they ask when using solvents, when. What is the conclusion please?
What's the conclusion? Maybe I don't quite understand the question, but I will just say that if I'm answering it correctly, you can use a wide range of solvents again as long as you're 15 degrees C below the boiling point. And it has to be a liquid at the measurement temperature. So it can't be a solid, it can't be a pseudosolid. It also has to have. Go ahead, John. Did I.
Yes, Rana has, Sorry, has clarified. They've extended saying when we use solvents, what is the concentration?
Gotcha. So the concentration for the solvents would be. We typically spec from 0 to 90% P over P naught. So and again the temperature range will be defined by the solvent. So we can only go up to 15 degrees C below the boiling point. So something like methanol which boils I think like 45 or 50, you would be limited. Or dichloromethane which boils at 45 degrees C. Your experiments be limited to 30 degrees C and below. So we can go from 0 to 90% relative partial pressure as long as the temperature is 15 degrees C below the boiling point of that solvent. On the flip side, we would be limited in very heavy or low vapor pressure solvents where the boiling point is above 200 degrees C because there's a simply not enough vapor, we bubble through a reservoir to generate saturated vapor streams. If this solvent is what I'll call a heavy solvent with very low vapor pressure, we would struggle to get high concentrations of that solvent just due to the low vapor pressure of that solvent. We have a list of approved solvents that we know work. If you have specific questions, we can address that.
Thank you. Daniel. I think that's all the time we have for today. Before we wrap up, is there anything else you'd like to add?
No, I just want to thank you for your time. I know it's a lot of information I threw at quickly. I believe the presentation is being recorded and John, just correct me if I'm wrong. You'll send out a link to the participants where they can review things that I may have gone over quickly. And also please reach out to US science surface measurementsystems.com if you have any questions, our science team will be happy to answer them for you. If you didn't have time to watch the whole thing or you had questions offline that come to you later. We do have most of the data that I showed today. We either have white papers or peer reviewed journals that we can share with you to give you more in depth information about the topics I cover today.
Brilliant. So yes, just to to further Daniel's statement there, please do email us@scienceurfacemeasurementsystems.com if you have any further queries. And we also invite you all to attend our next upcoming webinar which is taking place in two weeks time on Tuesday 20th April. The title of this will be Surface Energy Analysis for Measuring Physicochemical Properties of Materials. And this will be delivered by our very own Dr. Sabiyeh Ahmed.
More from Prof.

Webinar: Advances in Measuring Gas and Vapor Permeation Through Membranes and Barrier Polymers

Webinar: Determining Solubility Parameters of Bacterial Cellouse Through Energy of Adsorption

Online Webinar: Recent Technological Advances in Adsorption Based Direct Air Capture

Online Webinar: Surface Area of Pharmaceutical Ingredients at Real World Conditions by IGC



Hybrid Workshop: Measuring Material Vapour Pressure Properties Using Advanced Sorption Technique

PCL Hybrid Workshop: Recent Advances in the Characterisation of Pharmaceutical Powders


Using Advanced Techniques to Test the Performance of Recycled Bathroom Tissue | A video summary
