Webinar Session 1: Dynamic Vapor Sorption (DVS) for Materials Characterization
Dr. Majid Naderi explains dynamic vapor sorption, a technique that measures how materials absorb and release moisture. DVS tracks sorption isotherms, diffusion rates, and heat of adsorption across food, pharmaceuticals, packaging, and building materials. The webinar covers instrument design and software tools for analyzing material behavior at different humidity levels.
Chapters
Hello everyone. Thanks for joining us. At our material characterization webinar session today we'll discuss advances on dynamic vapor and surface characterization techniques in sorption science. This is our first session and we will focus on the dynamic vapor sorption technique in detail from theory to common applications. In our second session we will place more emphasis on the inverse gas chromatography technique and its application for the physicochemical characterization of materials. Our presenter today will be Dr. Majid Naderi. Majid is our Lab Manager and one of our senior application scientists at Surface Measurement Systems. His academic background includes a Master in petrochemicals and a PhD in physical chemistry with over 15 years of experience in material characterization. We will have a Q and A session at the end of the presentation, so please feel free to send us all the questions. We are ready to start. I'll pass it on to Maciej now. Thank you.
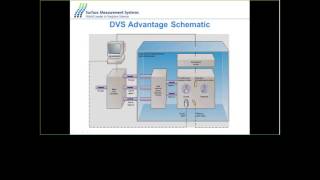
Thank you Daniel and good morning everyone. For this session I'll be going through an Introduction to dynamic Vapors option for materials characterization. For the first few slides I'll just go through the principles and introduction to the system followed by applications and examples. Generally, for the characterization of solids there are different methods characterization methods available. Common ones include spectroscopic techniques which use energy as a probe like x rays or lasers and these will give you analytical and structural information. Or you could use heat as a probe like a calorimetry which will give you thermodynamic information. But with the dynamic vapor absorption technique we use molecules as a probe and this is an absorption technique which will give you thermodynamic chemical as well as structural information. Now using molecules as a probe. Molecules can either be absorbed onto the surface or or be absorbed into the bulk and the way the molecules are absorbed and the way they come off the material will give you a wide range of information through sorption and desorption isotherms. So where can vapor absorption occur? Vaporsorption can be on the surface of the material in the pores, micropores, mesopores between the particles in the form of condensation, sorbed into the bulk of the material or chemically react to form, hydrate or solvate if you are using organic vapor. Generally, the kind of information you get from sorption processes include the stability of materials at different vapor concentrations. Vapor solid interactions in general are important for a wide range of industries including food pharma, proteins, fuel cells, packaging materials, high energy materials like explosives, personal care like shampoo conditioners and fabric conditioners as well as the interaction between fabrics and fragrances. So accurately determining what is oxygen isotherm is obviously a critical process for proper development and storage of the materials. Some of the older techniques available are generally used for measuring moisture content only and they wouldn't give you a full isother absorption desorption isotrope. And these methods include loss on drying, which basically involves weighing the sample, heating it and re weighing it to see how much water has been lost. Obviously there is a risk of contamination as well as sample loss and human error in this method. Karl Fischer technique is a titration method and determines water only and not the volatile substances or any other substances coming off the material. It's a destructive method and obviously samples can't be used after the analysis. And generally it's not ideal. An ideal method, especially for food materials, as water is released slowly and with difficulty. More common technique jar method is a static gravimetric method where different jars are used and a room full of jars sometimes are used with different saturated salt solutions in them to provide different percentage relative humidity. And this is a very slow technique. It could take months, weeks or months to get an isotherm. It's very labor intensive and large amount of sample is required and it involves obviously different types of errors, including baying errors and so contamination. So the difference now with the static methods and dynamic methods is that the way the molecules interact with the surface, with the static method you have a limited number of molecules interacting with the surface. And that's the reason why equilibrium is established slowly. And you also use a larger amount of sample. And obviously as you take the sample out and wait, there's the risk of contamination and error. Whereas with the dynamic vapor absorption technique, you achieve fast equilibrium through the flow of molecules over the sample. So you don't introduce a static volume of molecules to the material, but you have a flow of vapor over the material constantly and therefore achieving fast equilibrium. Better diffusion into the system, Only small amount of sample in the milligram range, sometimes depending on the uptake, as small as 1 milligram can be used. And the sample is in a sample chamber and there's no risk of contamination or sample loss. And the micro balance with a 0.1 microgram accuracy is used to monitor the changes in the mass of the sample. Here's a schematic diagram of the system. The dry gas is introduced to the system through a series of mass flow controllers, very accurate mass flow controllers. And the dry gas bubbles through the water reservoir or vapor reservoir and generates saturated vapor, which is then mixed with dry gas to Generate the required target concentration which is then introduced into the sample chamber and the reference time chamber. This is where the sample is introduced to the vapor generation. And a camera underneath the sample chamber can take images of the sample at different relatives humidities or vapor concentrations. The concentration of the vapor is monitored using a humidity vapor sensor. This is basically a chilled mirror detector. And also there are ports available on the side of the sample chamber for Raman or UV probes to be connected to the system. So you can do spectroscopy at the same of the gravimetric analysis of the sample. The micro balance obviously monitors the mass loss in the sample. There are different versions of the system available. The basic one includes the DBS intrinsic which has got a temperature range of 20 to 40 degrees and only does water. DBS advantage does both water and organic vapor temperature range 5 to 60 degrees. And this is the system which can be hooked to a Raman spectrometer as well. The DBS elevated temperature goes to higher temperatures for from 20 degrees to 35 degrees. And also we get higher temperature preheater. The DBS advantage has got a standard preheater which goes up to 200 degrees. Whereas the elevated DBS elevated temperature can be fitted with a higher temperature preheater which goes up to 300 degrees as well. The DBS vacuum instead of flow of gas, it works with vacuum. There are two pumps, rotary and turbo pump attached to the system so it can go down to the vacuum levels down to 10 to the minus 7 torr. And this is an ideal system for porous materials as well as measuring the vapor pressure of solids. In terms of regulatory requirements, the system has been recognized by US Pharmacopoeia as well as European pharmacopoeia. And due to the number of systems working in Japan and China, it is becoming a standard method in Japan and China as well. Just to compare the system with some of the other competitive systems, you can see here the green line for the competitive system and the blue line for our system. SMS system at higher temperatures you will notice that at above 60 degrees the competitive systems are unable to maintain the relative humidity. Whereas with our system you can even at higher temperatures. Obviously the higher the temperature, the lower the relative humidities that you can maximum relative humidity that you can achieve. But in the case of the SMS product at above 60 degrees you can still maintain relative humidities over 85% relative humidities. Also another advantage of the SMS product is the z true 0 RH where in this case on the right hand side with the poor quality, you can see an example for naloxone HCl where the drying the desorption curve doesn't return to zero during the drying process. Whereas in the case of SMS product the desorption curve comes back to zero where it started from due to the true 0rh property of the system. Also, the accuracy of the mass flow controllers mean that you can collect data at small intervals like 0.2% relative humidity steps. And here I'm trying to show low, medium high, but there is no reason why you can't collect smaller step relative humidity points all the way through the isotherm. And here is the table of classification for hygroscopic materials. So you can see at the very low levels of uptake down to 0.12% is classified for non hygroscopic material. So it is important for the balance to be able to register very low mass uptakes as well as the mass flow controllers being able to control the flow of vapor concentrations. System comes with a a camera at the bottom of the sample chamber. Obviously the camera, the colored camera is useful for processes any changes in the material including the swelling of pharmaceutical excipients or collapsing of structures as well as any degradation or color changes in the sample. Also hydrate formation and then equations events can be monitored as well. A typical example for phase changes and just using a combination of gravimetric method as well as the Raman spectroscopy and video images is for amorphous lactose. Typically for amorphous lactose you see a mass drop at a particular relative humidity. And in this case you can see at around 60% relative humidity the mass suddenly drops which is basically an indication of phase change, amorphous decrystalline phase change and in this case it is not reversible because during the second cycle you see that the profile is quite different to the first cycle. The Raman spectroscopy also shows similar events as the relative humidity increases. The broad hump for the Raman spectra you will see that it will change to well resolved peaks at above 60% relative humidity. The video images also show that the free flowing powder are basically changing as the material deliquescence goes to crystalline state. The analysis software offers we offer three suites of macros. The standard one which includes the plot manager for plotting all the MAS data and the isothermic analysis software basically plotting the isotherms, option disorption isotherms and baseline corrections. If you're running a long experiment and if there are any drifts in the baseline, you can correct that. And also if you want to monitor the partial pressure generation or vapor concentration generation. The macros allow you to compare the target against the actual concentrations. The more advanced macros will allow you to calculate spreading pressure, VAT surface area, heat absorption, diffusion coefficient and activation energy of diffusion, which is basically to show you the energy barrier for the vapor to get into the material and therefore the stability and shelf life of the material. Nuts and vapor pressure will allow the vapor pressure for solids to measure the vapor pressure for solids and the isoactivity plot is basically maintaining the relative humidity constant and changing the temperature. Amorphous content is a very popular macro for pharma and food materials. Obviously monitoring the amorphous content in these materials and permeability macro for packaging materials. Also the isotope analysis software offers a range of macros for analyzing and fitting different equations into the ISO specimens. BT again BT surface area GAB, which is an extension of the BET equation as well as the TEF. The Dr. Is basically the macro for volume determination. Micropore mesopore size distribution also possible with these macros with organic vapor option and a series of other equations including Langmuir and Young and Nelson which are basically ideal for determining the monolayer or multi layer processes. In terms of applications for food materials, Moisture induced morphology changes in food ingredients and products of course is an important process stability and shelf life of food materials. Rapid isotherms compared to the old techniques available like the jar method, you can quickly achieve full isotherms using the dbs moisture absorption and expulsion or drying effects for food materials and in terms of the packaging materials diffusion into food packaging materials pharma applications similar to food stability testing as well as formulation for the interaction between the drawback and the excipients. Characterization of amorphous content in the pharmaceutical material similar to food materials and moisture induced morphology changes too. And for personal care, moisture retention for hair and also moisture retention by skin and skin cream performance as well as contact lenses which include basically diffusion coefficient measurement and permeability measurement. Super absorbents like diapers are also we have many customers in this area too for a packaging material. Again, electronic components or pill capsules and listed packaging materials can be just used in the sample chamber as they come and any vapor going through the packaging material can be the diffusion and permeability can be measured. Other applications include fuel cells, proton exchange membrane fuel cells, fabrics and fibers, the interaction between fragrances and fabrics, washing powders for example, building materials, very popular cements, wood insulation materials and agriculture pesticides, vapor pressure of solids and also seeds and fertilizer release. They all have applications in tvs. A typical Mass data includes basically a drawing stage followed by steps, any intervals that you like, but typically 10% relative humidity and then coming down during the desorption. And the second cycle, which basically shows whether the process is reversible or irreversible. The isotherms are basically formed by using the concentration data and mass data. So the absorption and desorption isotherms and the difference between the gap between the adsorption desorption will give you a wide range of information. For example here that tells you that the water, the moisture get into the bulk of the material. And judging by the uptake, the vapor is getting into the bulk of the material, but the process is reversed as it comes back to zero. Different types of isotherms will obviously give you additional information here. Typically this type will show you microporous materials straight uptake and then comes to a plateau. Whereas these two, type 2 and type 4 will give you the information about the monolayer level as well as the multilayer level. And these are the ones that are used for Betsys area images. Type 3, Type 5 are sorry, typical of condensation on the surface of the material. And this is how basically the vapors, if the vapors are interacting with the surface of the material, they form a monolayer and then followed by multi layers. And this is where you can use the monolayer for BET surface area calculations. Whereas in the case of the condensation, the cluster formation on the surface, which is not ideal for BET surface area calculations. Typical capillary condensation for mesoporous materials. This is the kind of isotherm that you would see see for mesoporous materials with capillary condensation. And again for hydrate formation, a reversible hydrate, you see a sudden jump in uptake due to hydrate formation. And typically the isotherms form this rectangular shape hysteresis, which basically is reversible. And no matter how many times you repeat the experiment, you will see this effect if it wasn't reversible, the irreversible form, you'll see that the narrowing of the hysteresis. In this case, if you repeat it again for the third time, this will probably go narrower still. Or moisture retention during hydrate formation. Again for lactose, in this case, you can see that the hydrotherm doesn't come back to zero, some of the moisture is retained and other terms also show an open loop system where they don't come back to zero. Another method is the ramping method, where you can see any changes in the material by Ramping the relative humidity at a particular ramping rate, typically 5% per hour. And then you see an increase in water absorption due to surface absorption, followed by slowing down as the material goes from a glassy to a rubbery state. And then a sharper increase in the uptake followed by the loss in water due to the lowering of the water capacity and recrystallization. Here's another example for a stability of the material as sucrose at the crystallization relative humidity. For the crystallization of sucrose is typically at 50% relative humidity. But as you add protein BSA, the stability goes to higher relative humidity. So with 11% protein added to sucrose, the crystallization point moves from 50% RH to 70% RH. And as you increase the amount of protein, this moves further to the higher relative humidity as well. And the video images show that too. The free flowing powder at 0% relative humidity. Gradually the liquescence becomes crystallized and the requiescence at higher relative humidity. Different methods available. Cycling methods. For example, you keep increasing and decreasing the relative humidity and see the changes. Some of the moisture is retained as you every time you increase the relative humidity and come back to zero. And this is more obvious in the sorption desorptionizer terms where you see the free flowing powder shows an open loop hysteresis. But as the material cakes, this loop closes. Polymorph differences between polymorph A, polymorph B very obvious difference in the total uptake. Very low for polymorph B, but significantly higher for polymorph A going to over 4%. Heat absorption measurements will give you information about the absorption mechanism. And in this case you need to do the same experiment at two or three different temperatures. And from these results you can see for example here that the heat absorption is very close to the heat of condensation of water. Therefore, the conclusion is here, the water molecules are condensing on the surface rather than interacting with the surface of the material. Also, for some membranes, you'll see here that heat of adsorption for this type N112 membrane is greater than the NR112 membrane, indicating that the interaction with the surface is higher for this film compared to the other film. But at some stage, at higher relative humidities or higher coverages, both come to the same level, indicating the condensation of water on the surface. Amorphous content determination I won't spend much time on it, but just to show you one method, there are four methods available. Typically you measure the Uptake before and after the crystallization. So for that you would need to find a vapor that causes crystallization in the material. In this case, water doesn't seem to cause any changes in the material. Therefore, we move to organic vapor acetone where you can see that as you as a particular relative humidity vapor concentration, the mass drop shows the amorphous to crystalline phase transformation. Once the vapor that causes the crystallization is found, then you can use this method measuring the uptake before the crystallization stage and then taking the material through the crystallization process where the mass loss occurs and then measuring the uptake again at this level. So this is the crystalline and this is a mixture of amorphous and crystalline. Any difference in the uptake will basically correspond to the amorphous content of the material. The method is much more precise than XRD or DSC. So detection limit of 0.2% is much better than the other techniques available. And also you don't need a high level of sample mixing, homogeneity and sample preparation as required with other techniques. And you can just use the sample as it is. You only need an amorphous material as a standard to draw a calibration curve. Diffusion measurements for packaging material Blister packaging Just hanging the blister packaging as it is with the tablet in the sample chamber and you can see that diffusion increases, diffusion coefficient increases as the vapor concentration increases. Other accessories available for the system include a diffusion cell where you can sandwich a film material in between the seals in a cup where you can have moisture gather material like ceolite or you can have water. So if you have water in the cup, any water escaping through the field can be measured as mass loss. Or if you have moisture gather material in this of any moisture encouraged to pass through the film and be absorbed by the zeolite tablet will show an increase in mass. And therefore from there you can measure the diffusion rate and also the water vapor flux or permeability in the in the material. Typical example is limonene or ethyl acetate, amyl acetate. These are flavoring materials which can pass through the packaging materials for food stuff. And also the same technique can be used to measure the water activity or food materials too. And we've done a series of food materials including honey, corn, starch and ketchup and so on. And literature value and R value are in very good agreement. Hair differences, damaged hair or treated hair, bleached hair, heat treated hair. They all can be distinguished using the technique by the differences in mass uptake. Building materials one Cement you can see the it picks up moisture very late, whereas the other type of cement very quickly. Therefore, you can just find out the shelf life or stability of the different types of cement. For example, other building materials wood, a chunk of wood and difference between sawdust and chunk of wood. For example, chunk of wood, it's more difficult for water paper to get into, so water uptake would be relatively lower. Whereas in the same sort of wood, in a form of sawdust, the much higher uptake due to better diffusion through the powder form. Again, different sample geometries. In this case of wood material, different. The same biscuit can be either crushed or be used as a chunk of or different pieces of biscuit. And obviously when you have it as a powder, the diffusion is much better into the powder and the uptake would be higher. Again, the sample chamber allows you to hang large samples from the hang down wire as well as a bigger manifold which can be added as an accessory to the manifold and measure even larger samples than this. So if you have a bigger volume, we have an attachment for the sample chamber to allow you to measure even bigger volume samples as well. Other examples which I won't spend much time on, include the restoration of different materials, different projects. In this case is the Swedish warship Vasa, where you can basically compare any new materials that are being used for the restoration compared to the original material that were found in the original warship. Also, heavy water can be used in the system to monitor basically to trace the interaction or replacement of water with heavy water or to investigate the functional groups on the surface of the material. Building industry A lot of interest in the DBS building industry because building materials, building companies are obliged to reduce their carbon footprint and move to more biomaterials. And in this case we have a lot of different universities concentrating on straws and basically more natural materials. And they need to monitor the temperature changes in the humidity and insulation properties of these materials. And one of the other properties that can be measured for these materials include the porosity measurement as the straw and hem, they are porous materials. And with this system you can also measure the pore size distribution as it is for the straw sample here, which is typical microporous material isotherm. So I think with that I'll. I will end the presentation and go straight to the questions. We have a question. How do you get a faster equilibrium with high Rh values? There are different methods. Basically it depends on the nature of your material, really. If you have a powder available or a tablet, obviously, as you saw with the examples, the tablet. The diffusion into the tablet is much slower than the powder form. But one of the advantages of our system is the accuracy of the balance, the micro balance and the ability to use very small amount of sample. Therefore, basically increasing the kinetics and improving the kinetics. But at the same time, there are other parameters that you can change, including use of helium, the carrier gas, which will improve the diffusion into the material. That's the end of the questions and I thank you very much for listening to this presentation.
More from Prof.

Webinar: Advances in Measuring Gas and Vapor Permeation Through Membranes and Barrier Polymers

Webinar: Determining Solubility Parameters of Bacterial Cellouse Through Energy of Adsorption

Online Webinar: Recent Technological Advances in Adsorption Based Direct Air Capture

Online Webinar: Surface Area of Pharmaceutical Ingredients at Real World Conditions by IGC



Hybrid Workshop: Measuring Material Vapour Pressure Properties Using Advanced Sorption Technique

PCL Hybrid Workshop: Recent Advances in the Characterisation of Pharmaceutical Powders


Using Advanced Techniques to Test the Performance of Recycled Bathroom Tissue | A video summary
