Webinar Session 2: iGC for Materials Characterisation
Dr. Magi Naderi explains inverse gas chromatography, a technique that measures surface properties of powders, films, and fibers by exposing them to probe molecules. It works with milligram samples, takes hours to run, and reveals surface energy and heterogeneity that contact-angle and BET methods miss.
Chapters
Hello everyone. Thanks for joining us on our material Characterization webinar session today we'll discuss advances on dynamic vapor and surface characterization techniques in sorption science. This is our session two and we'll be focusing on the inverse gas chromatography technique in detail from theory to common applications. Researchers whose studies are in the field of pharmaceuticals, biopharma, food, building materials, porous and nanomaterials will gain better understanding on the uses and benefits of this technique. Our presenter today will be Dr. Magi Naderi. Majed is our lab Manager and one of our senior application scientists at Surface Measurement Systems. His academic background includes a Master in petrochemicals and a PhD in physical chemistry with over 15 years of experience in material characterization. We are ready to start. I'll pass it on to Madjid now. Thank you.
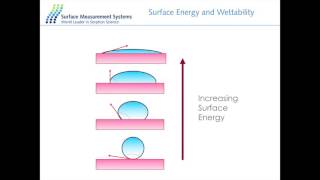
Hello everyone and welcome to this Inverse gas chromatography. Today's webinar will focus on the materials characterization by inverse gas chromatography and for this presentation I spend a few minutes on brief description of surface energy and why it is important and also the inverse gas chromatography technique, the experimental method and how it all works. We will then see examples or case studies to show how surface energy can help help us understand materials behavior. I will answer questions at the end of the presentation, but you may send in your questions at any time during the presentation. IGCSEA it is a gas phase sorption technique. The the principles have been around since 1950s, but we at SF Surface Measurement Systems we are the only manufacturer of the commercially available system. It is a powerful physical chemical characterization tool for powders, fibers, films, particulates, semi solids, viscous liquids and for a wide range of industries industries compared to the old analytical gas chromatography technique. Here are some cartoons to show the differences in the analytical gas chromatography. A column with a known stationary phase with known physico chemical properties is used to separate components of the mixture and the retention times for each component would identify the different components of the mixture. In the case of the inverse gas chromatography, the phases are reversed, the stationary phase is the unknown phase and a series of known vapors with known physicochemical properties are passed through the the sample, the stationary phase, the unknown stationary phase and according to the retention times, retention volumes are calculated which correspond to the different surface energetics of the material the system has. This is the second generation of the IGC system and it has a much smaller footprint and therefore takes up less space on the bench and it has 12 vapor reservoirs, each accommodating 50 milliliters of the solvent. And therefore there is again less need to change the solvents. There are two columns available to be fitted into the column oven which goes from 20 to 150 degrees C. There's a flame ionization detector to detect the organic vapor. And for the FIDs you would need obviously hydrogen gas as well as air. And the helium is used as a carrier gas. For safety features, hydrogen leak detector and also organic vapor leak detectors are available in the unlikely event of a leak in the system. The 12 solvent reservoir system would allow access easy access to the solvent compartment. And of course the solvent compartment is temperature control for vapor stability. And the new injection system means 1 to 4,000 injection ratio, which means injections as small as 15 milliseconds and as large as 60,000 millisecond, which in turn would allow a wider range of concentration, which translates into higher coverages and therefore you can achieve a complete monolayer coverage. Since we're using different vapor molecules and different cross sectional areas, therefore different amounts of the probe molecules would result in different coverages. And considering that we have the surface area of the material and you know the molecular size of the probe molecules, it is easy to calculate the amount of the probe molecule required to achieve a certain coverage. And therefore we can measure the surface energy at each surface coverage and in this manner have a map of the surface and the surface energy distribution for the entire surface. Sample preparation is easy enough. The traditional GC columns were loop columns, difficult to pack, whereas the sea column is a straight column, easy to pack in different diameters. The length of the column is 30 centimeter long, but there are different diameter columns. 2, 3, 4 diameter according to the size of the samples. Size of the sample depends very much on the type of the material, the nature of the material, and could vary between 10 milligrams to 1 gram. For a crystalline lactose, for example, you would need 1 gram which would fill up the column. Whereas for an active ingredient you may use 100 milligram or so. And for porous materials or active catalyst, you probably need about a few milligrams of the sample. So it all depends on the surface area of the material. And then once you pack the samples in the column, you cap it either end of the end of the columns with some glass wool. Type of properties measured by surface energy analyzer include dispersive and polar surface energies. As you are aware, surface energy has two components, dispersive and specific or polar surface energy. Dispersive component is measured Using a series of alkane probe molecules and polar surface synergy or a specific surface energy is measured using polar chrome molecules e.g. ethanol, acetone, ethyl acetate, acetonitrile and so on. Heat absorption measurements this is where certain probe molecule is injected at different temperatures which will give you information about the adsorption mechanism the material under investigation Acid base interactions this is Lewis acid base interactions Electron donor electron acceptor properties bet surface area calculations Phase transitions Again similar to heat absorption measurement One probe molecule injected at different temperatures Sorptionizer terms for different molecules Permeability for packaging materials, especially solubility parameter and diffusion coefficient measurements Competitive sorption the system allows for different humidities to be introduced into the system while the surface energy measurement is in progress and therefore in a way you can have competitive sorption at different humidities. Surface energy heterogeneity mapping, of course is the main feature of the system. Here some cartoons to show you the material's behavior as the surface energy changes and in this case a droplet of liquid wets the surface as the the surface energy is increased. So therefore the wettability increases as the surface energy is increasing. Similarly for surface energy between the particles solid particles cohesion strength increases as the surface energy increases and therefore result in agglomeration. By milling and introducing disorder material you would increase the surface energy and the more defect sites are present, the more the surface energy increases. Adhesion properties between two unlike bodies. Therefore, for example drug and excipient interactions. Here as you increase the surface energy, the interaction between the small and large particles increase and therefore the interactions between e.g. drug and excipient increases. So why do we measure surface energy? Basically, knowledge of surface energy is important in the formulation design of multi component systems and the prediction of processing performance. Also studying the adhesion cohesion process the interaction between solids and also solid vapour solid liquid. Therefore, adhesion properties is important in the prediction of processing performance. Generally, the SCA provides access to unique physicochemical properties for a wide range of industries including pharmaceuticals, cosmetics and personal care products like skin, eye creams, hair products, shampoos, conditioners, food products and ingredients. Similar experiments to pharmaceuticals e.g. amorphous to crystalline phase changes Minerals and coals Building materials including cements and wood materials insulation material, flavorings and perfumes Interaction of fragrances with different materials like in washing powders, natural and artificial fibers like carbon fibers, biopolymers, cellulose, for example Coatings and thin films Packaging materials, supported catalysts, polymers, fillers and composites and of course porous materials, microporous materials like zeolites. So almost all materials are heterogeneous and heterogeneity can be in the form of chemical heterogeneity or structural heterogeneity. Chemical heterogeneity could be as a result of surface contaminants or impurities, or different crystal planes can have different functional groups or different chemistry. Degree of crystallinity and amorphousicity of course makes a difference and different morphological states like different hydrates and solvates and of course surface groups in homogeneous surface modification can result in chemical heterogeneity. In the case of the structural heterogeneity, crystals may have different defect sites, growth steps, crystal edges, surface pores and irregularities of crystal lattice. Also pore structure and different pore size distribution can be result in structural heterogeneity. So basically heterogeneous properties can cause differences in adsorption properties and therefore vapor absorption capacity and surface energetics. Here is an example to show how the older IGC differs from the new generation of the igcse. In the older system we were only able to go as far as inject as far as the Henry region which is infinite dilution, which is basically covers the only small part of the isotherm and would target the high energy site sites and not necessarily the entire surface of the material. In the case of the new IGCSEA system, the injections are the higher concentration injections would mean that we can cover more of the isotherms and the wider region which is basically the monolayer region which is required for the beta surface area calculations and also to have a complete coverage of the surface and measure the heterogeneity of the surface energy. Just again to demonstrate this, here are some cartoons at infinite dilution, if you consider two surfaces with two different defect sites, with the infinite dilution with the older system we were only able to inject certain amount of the probe molecule and therefore only target the high energy sites and therefore the two sites would appear having the same mean surface energy. Whereas in the new system with the capability of higher concentration injections, we can cover the entire surface surface and differentiate between the two sides and the defect sites. The more defect sites which are available on the surface on the right hand side. Similarly, the results if you plot the surface energy against the surface coverage, you can see the surface, the red surface with less defect sites although has a higher surface energy but there isn't much variation, whereas the blue side starts with high surface energy and there is A much more variation of surface energy. And this is clearly shown in the normalized curves where the distribution the wider distribution curves shows greater variation of the surface energy for the blue surface compared to the high surface energy. But narrower distribution of the surface energy for the red surface. Different comparison with the contact angle measurements. In the contact angle measurement you would need to apply for high pressures to make a compact sample. This could cause surface deformation and also rough surface topography will influence the results as well as the porosity, which would lead to plantation of the liquid, swelling and also dissolution. They all make a difference in the results. And here at the bottom of the slide, you can see a droplet of water penetrating a mannitol sample very quickly. And therefore contact angle measurements would be difficult. In the case of the igcsea, this is a vapor gas phase interaction, no liquid solid interaction. This is where the interactions do not suffer. Limitations of the liquid based techniques like the contact angle and also a wider range of probe molecules can be used to study different surface groups. Wider range of measurement conditions, temperature and humidity can be used. And also wider range of sample morphologies without sample preparation can be used. Powders, films, fibers and granules. And you can measure the surface heterogeneity, which in the case of contact angle would require so many experiments to for example, measure the heterogeneity of the surface of the material. Main applications of the IGCSEA include Bt surface area measurements, surface treatment studies, formulation design like surface energy heterogeneity, work of cohesion, work of adhesion, batch to batch variation, investigation of pre treatment effects like milling, drawing, macronization, solubility, parameter measurements for the stability of the materials. In the case of the BET surface area measurements, the traditional volumetric technique, which is the nitrogen absorption measurements at 77 Kelvin. This can be difficult for some materials because at these temperatures it would change the nature of the material. And also surface areas below 0.5 square meter per gram cannot be measured as we would need a crypto gas to perform these measurements. And also the samples must be exposed to very low pressures. Vacuum drying, this again could affect the samples. For example, pharmaceutical hydrates are affected, some fragile crystals might collapse under these conditions and Bt. And if you wanted to basically measure the Bt surface area on a hydrated material, this wouldn't be possible. Whereas in the case of the igcsea you can use ambient temperatures and pressures with different relative humidities. The kind of probe molecules you can use include octane, cyclohexane or other alkanes which form type 2 or type 4. Isotopes surface areas as low as 0.1 square meter per gram can be measured. The only thing to bear in mind is that some probes may not access all the surfaces due to static effects. For example, if you have microporous materials, you have to be aware of what type of probe molecules you use and the cross sectional area of the probe molecule and also you have with your probe molecule would need to be surface option. Water in majority of cases is a poor vapor probe molecule for BET surface area measurements as it doesn't give you the type 2 type 4 isotherm. Here's an example of Alumina sample standard Sample Standard Material CRM170 for BET surface area standard and as you can see the surface area correlates well with the BET surface area and the literature value. Another example is the CRM171, the higher surface area material. Again, the surface area is in good agreement with the literature value of 2.95. If we take this sample as a standard at different humidities you can see that at 0% relative humidity surface area of 2.95 the literature value is achieved and as you increase the surface the relative humidity, the surface area drops. If you go further to 90% relative humidity, the surface area drops significantly which is due to the fact that the water molecules are occupying the active sites and therefore blocking their available surface area for the probe molecule to measure. Different ways of changing the surface energy include vaccine coating, salinization, hydrogenation, absorption, relaxation for lowering the surface area. Whereas if you wanted to increase the surface area, oxygen plasma treatment, chemical etching and sandblasting would be the way for increasing the surface area, basically creating rougher surfaces. Now moving on to some examples or application notes. This is an example where the flowability is correlated with the surface energy results. This work was done in collaboration with Imperial College and in this case two different types of Manitol samples have been used, large crystals grown and some powdered manitol and in both cases both materials are cylonized to investigate the effect of functional groups on the surface energy and eventually the results are used to correlate the behavior of the material, the flowability behavior of the material with surface energy. In the case of the large crystals with different facets, you can see that dispersive surface energy varies for different facets, but more significantly the polar surface energy or specific surface energy variation is greater for the different facets and this is due to the different concentration of the functional groups or hydroxyl groups on the different facets of the crystals with the same sample, the same large crystals. If we carry out salinization process and basically replace the hydroxyl groups with the methyl groups, we can see that the surface the distribution of surface energy is more uniform. And basically very similar surface energies are obtained for all the facets. We repeat the same experiments using the powder Manitol and the IGCSEA method. And you can see here that as you seep material, the powder manitol, there is a variation of the surface energy at different coverages. Here and basically at lower coverages, we start with high surface energy and as we increase the coverage, different energy sites are covered and therefore we get a variation in the surface. Whereas the cyanized material you see a more uniform surface energy for the entire surface coverage. Similarly, for the specific surface energy, the same sort of pattern you can see starts with high surface energy and as you increase the coverage it comes to lower surface energies, but generally see a variation in surface energy. Whereas in the case of the cyanide material you see a flat line indicating a uniform surface energy. Now, if you correlate the results with the probability behavior of the material, the as received material shows unstable flow behavior and low air velocities indicating the higher cohesive strength for this powder. Whereas the silonized the blue line cyanized D Mannitol shows a more stable material even at lower air velocities. And free flowing powder work of adhesion indicates the easy flow over stainless steel surfaces and therefore when it comes to the processing vessels, this material would flow easier. The flowability was measured using a FT4 powder rheumter from Freeman technology. Another example is the interaction of drugs and excipients. Here we have two drugs with this and sulbutamus sulfate and we use IGC to measure surface energetics of individual components drug and the excipient and correlate work of adhesion values to formulation performance. Here are the results for this dispersive surface energy for lactose and glutasonide and subutable sulfate. And here are the work of adhesion cohesion results for the drugs and the excipient lactose. In the case of lactose budezonide we see the work of adhesion is less than the work of cohesion for budazonide and therefore a weak affinity between drug and carrier and poor blending is expected. Whereas in the case of salbutamol sulfate and lactose, work of adhesion is greater than the work of cohesion for subbutamol sulfate and therefore a stronger affinity between the drug and carrier and also a good blending performance is expected. Another example is the influence of preparation like milling. Basically aspirations samples have been milled and the surface energy results have been correlated to the dissolution rate. And in this case two different particle sizes of fragments have been separated. So to eliminate the effect of particle size. And we can see here in both cases the milled samples. In both particle size fractions mean samples, the solution rate is faster. And as we measure the surface energy, the same behaviour can be observed here for the milled samples. In the case of both particle fractions, the higher surface energy is observed for the milled samples. But at higher surface coverages all materials show similar surface energies. Other parameters like solubility parameter. Here is an example of PMMA Hildenbrand solubility parameter measurements. These are basically two different methods of measuring solubility parameter. One is by varying the probe molecules at a constant temperature or varying temperature with using one probe molecule. In either case we get results very close to the literature value for pmma. And also in the case of the two dimensional hands on solubility parameter, similar agreement is observed between the literature values and IGCSEA results. There are accessories for the system as well, including this film cell where if the material under investigation cannot be fitted into a glass column, then we have film cell for planar samples, for example, where the film is placed in between two blocks, where the vapor is is introduced from one end and goes covers the surface of the material and comes out from the other end and goes back to the system. There are many advantages for this film cell. For example, compared to contact angle. If you wanted to measure the heterogeneity for a surface, you would need to measure surface energy at different points, which would would mean so many experiments here. In this case, the same experiment would give you the heterogeneity of the surface energy for the film sample. For this study we used two different aluminium metal as well as a Teflon sample. In the case of the aluminium, a sample was bleached as well as acid treated acid treated sample. You see a great variation in the surface energy and the sample was energetically more active and heterogeneous. And this is clearly shown in the distribution curve as well. In the case of the Teflon sample, Teflon sample has a higher surface energy, but the distribution of the surface energy is greater with the acid treated sample. And this is again shown with the distribution curves. Similar results are obtained with the specific or polar surface energies for both materials as well. In both cases, the wettability acid cleaning methods Increase the wet stability of the hydrophobic surfaces. LCA can be used to probe phase transition. For example by using single probe molecule and varying the temperature and studying the adsorption behavior of the material. Here we can see as you increase the temperature the and the material undergoes a change from glassy rubbery state to a rubbery state and there is a change in the behavior of the sorption behavior of the sample. And the curve changes from a linear sort of curve to a non linear curve where this is the start of the TG value basically. And similarly at different humidities you can see that the effect of humidity on the glass transition temperature. As you increase the humidity, you can see that the glass transition temperature drops and from 0 to 15% relative humidity, the decrease in the glass transition is clear. So to summarize, SCA is a versatile and sensitive gas phaserption technique and a good physical chemical characterization tool for powders, fibers, films, particulates, semi solids, viscous liquids and wide range of materials. You can study the surface and bulk properties of materials. And of course the main feature is the heterogeneity studies. SEA is specifically designed to measure surface energy, heterogeneity, applications in pharmaceutical, food, minerals, polymer catalysts, packaging materials, films, inorganic materials and so many other materials. And for this reason we are happy to do demonstration samples for different types of materials and perform collaboration work with industry and universities to explore the full potential of SCA systems. Thank you for your attention and I can now answer some questions. I've received some questions regarding how much materials we need. Well, the sample quantity is really small, depends on the surface area of the material and the nature of the material. But generally speaking, for high surface area materials we only need a few milligrams of the sample. And for low surface area materials we would need up to 1 gram. But in, in any case, in the milligram range sample, typically we use 100 to 250 milligrams of powder samples. The columns are basically cylonized. So basically the surfaces have been passivated and although they may be washed and used again, but we wouldn't recommend that as the cyanized coating might be washed away. So really the columns are disposable and you would need fresh columns for each measurements. I have a question on what kind of materials we can use. Well, there is a limit really. As we are working with our new customers, new potentials are discovered and basically any type of material, anything that you can fit into a glass column or you can fit into the film cell can be tested. The length of the experiment varies depending on again nature of the material and type of the experiment you are investigating, basically the number of injections. So for mean value surface energy you would only inject 10. You have 10 injections and therefore accordingly it's a short experiment, only a few hours experiment. Whereas for surfaced agility you would need much more probably 10 injections for each probe molecule. And therefore it is like a 10 to 12 hour experiment for surface ED heterogeneity. And it all depends on the really the elution time and how long you basically allow for each injection or each probe to elute. So I think that's all I have time for now. And thank you very much for your attention.
SA.
More from Prof.

Webinar: Advances in Measuring Gas and Vapor Permeation Through Membranes and Barrier Polymers

Webinar: Determining Solubility Parameters of Bacterial Cellouse Through Energy of Adsorption

Online Webinar: Recent Technological Advances in Adsorption Based Direct Air Capture

Online Webinar: Surface Area of Pharmaceutical Ingredients at Real World Conditions by IGC



Hybrid Workshop: Measuring Material Vapour Pressure Properties Using Advanced Sorption Technique

PCL Hybrid Workshop: Recent Advances in the Characterisation of Pharmaceutical Powders


Using Advanced Techniques to Test the Performance of Recycled Bathroom Tissue | A video summary
