Webinar: Surface Characterization of Nanomaterials by IGC
Dr. Dan Burnett explains how Inverse Gas Chromatography measures surface energy of powders and nanomaterials by tracking gas retention. The method reveals dispersive and acid-base components, energetic heterogeneity, and how surface treatments affect composite and filtration performance.
Chapters
Okay.
Good morning everyone. I want to welcome you all to Surface Measurement Systems webinar on surface characterization of nanomaterials by Inverse Gas Chromatography. Today our presenter will discuss surface and bulk properties and their importance in successfully developing nanomaterials. Dr. Dan Burnett will be our presenter. Dan is our Director of Science and he is based in our North American office in Allentown, Pennsylvania. He received his Bachelor's Degree in Professional Chemistry from Eastern Michigan University and his PhD in chemical engineering from the University of Michigan. Dan joined SMS in 2001 to pursue his interest in sorption science and surface chemistry. His research includes work on pharmaceutical powders, natural and man made fibers, polymers, films, food and flavoring. He has co authored and authored over 25 papers in peer reviewed journals and presented at numerous national and international conferences. At any time during the presentation you may send us chat messages or Q and A. At the end of the presentation we will have a Q and A session with Dan so he can answer any of your questions. So at this point I'd like to turn it over to Dan.
Thanks Bill. Just as a reminder, this webinar is being recorded and at the end of the webinar you will receive a link to the webinars and will be posted on our website. So you can review this later. If there's something that I've missed or if you don't have a chance to get your question answered now, you could review the webinar later and send us an email. You can contact me directly. D. Burnett urfacemeasurementsystems.com or you can email our science team. It's scienceurfacemeasurementsystems.Com and here's our website, it's just www.surfacemeasurementsystems.
Com.
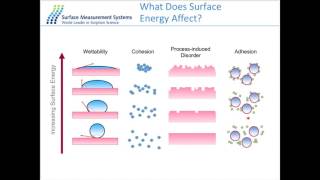
Without further ado, I will get started in the presentation. The presentation will be divided into two main components. The first component I will be talking about surface energy. Although we can do some bulk characterization, the dominance of this talk will focus on surface energy as that is the most commonly measured parameter by surface by inverse gas chromatography. I will briefly talk about the IGC concept and the instrument capabilities and then the second half of the presentation will be going through a few case studies of where surface energy has been used to look at both surface modification and functionalization of nanomaterials. So what is surface energy? Well first, surface energy is the most commonly measured property by inverse gas chromatography. So that's why I'm going to focus on that Today it is analogous to surface tension of a liquid and is defined as the excess energy at the surface of a material compared to the bulk. So the bulk has all these nearest neighbors, where at the surface they will have fewer nearest neighbors. So we'll have excess energy at the surface relative to the bulk. So in terms of composites, in particularly in nanomaterials, the surface energy is directly related to the thermodynamic work of adhesion. And the surface energy is often divided into two main components. A dispersive component, this is also called the non polar or London van der Waals Lipschitz component, and then a acid base component, which is sometimes also called a polar component. For the sake of this presentation, we will call this dispersive component of the surface energy and the acid base component of the surface energy. There are different nomenclatures in the literature, but for most part people call this gamma, which is surface energy, gamma dispersive and gamma AB for acid base. So as I mentioned, the adhesion between a filler material and the matrix is highly dependent on the interfacial adhesion. And that can be defined by the thermodynamic work of adhesion or work of cohesion, which is directly related to the surface energy of the components in the composite. Clearly there are other factors that affect adhesion, such as contact zone, capillary forces, swelling, loading. But one of the main properties that we can actually tune is the surface energy. So if we know the surface energy of material 1 and material 2, we can determine both the work of adhesion, which is between the two different surfaces, and the work of cohesion, which is between the surface itself. And I will show you some examples of how this can be used. In looking at nanocomposites, in addition to adhesion and cohesion, there are a wide range of applications and or uses of using surface energy. And why do people measure it and how is it related to other properties? So in this presentation there's just a very few references, we have quite a library of other references. If you have something specific you're interested in, please contact us. But adhesion and cohesion and composites, surface energy has been related to powder flow and powder mixing, static charge oil, triboelectric charging, milling or process induced disorder, batch to batch variability and surface modification. So the next slide is just going to illustrate visually what can affect the surface energy and why do people maybe are interested in it. So if I have my model surface, which is this pink rectangle, and if I increase the surface energy of this, I will increase the wettability of a liquid onto that surface. If I think of a powder or a particulate, if I increase the surface energy of this, I will increase the cohesive or attractive forces of this material. If I have a surface, and often when I mill or grind or do some sort of process, induce disorder, maybe plasma, treating it, in addition to making it rough, I will also increase the surface energy. Surface energy is not necessarily directly related to surface roughness, but these kink sites and defect sites will have fewer nearest neighbors than these flat planar sites. So these will have a higher surface energy. In addition, when you mill or grind or etch or sandblast a surface, you often create disorder in terms of maybe unstable sites. Amorphous sites open up varied interfaces. So that can all lead to an increase in surface energy. And finally, if I think of a composite, and if I look at these large particles as component one, these small particles as component two, and if I increase the surface energy of the larger particles, I can overcome the cohesive forces of the smaller particles and, and increase interfacial adhesion. Now, this is showing particle adhesion, but this could be fiber matrix adhesion. You know, fiber. Fiber adhesion. Basically, once I know the surface energy of any two surfaces, I can look at thermodynamic, adhesive and attractive forces, also. Surface treatment. If you want to surface treat a material, you need to know, first of all, what is its base surface energy, and what am I doing to the surface energy as I treat the sample. For some materials, in particularly high surface energy, nanomaterials, which typically do not disperse well when you put them in a polymer, due to their high energy and high cohesive nature, they tend to agglomerate and not disperse. So often people want to passivate or lower the surface energy of these materials by silanizing them, waxing, coating, annealing, maybe grafting on different functional groups to passivate the surface, thus lower the surface energy. On the flip side, when you have low surface energy materials, let's say polypropylene, and you want to paint it, for instance, the paint will have a higher, more polar surface energy, Whereas polypropylene is very low energy and dispersive, you often have to increase the functionality, increase the surface energy, maybe by oxygen, plasma, treating, chemical etching, sandblasting, grinding to activate the surface to make it more adhesive. So some systems you want to passivate or lower the energy, or other systems you might need to activate or increase the surface energy. What inverse DC allows you to do is to measure and then hopefully the ability to control and tailor the surface energy to the particular application. So inverse GC is not the only method to measure surface energy values. The most commonly used method in widely known method is the contact angle method, where you put a drop of liquid on the surface and measure the contact angle. This technique works quite well when you have flat, smooth, homogeneous and non porous surfaces. However, for powders, fibers, nanoparticulates, granules, semisolids, and porous materials, this technique does not work very well. And inverse DC is really the only technique that can give you accurate and reliable results when looking at these materials. There are other approaches such as making a compact on powders or using the Washburn technique. But for directly imagine the surface energy of fibers and granules and non homogeneous surfaces. Inverse CC is really the main method to do that. There is another technique like AFM which can measure directly surface energy, but this is typically on a molecular level. So you're looking at individual spots on a surface. It's difficult to get a global surface energy for the overall powder or fiber or surface. It is quite low and you typically have to do hundreds if not thousands of measurements to get an average value for the material. So although IGC is not the only technique, it is probably the most versatile in terms of sample geometry and also conditions. Because we can vary both the temperature and relative humidity to do these experiments. I apologize, my cartoon does not show up on the webex display, but it does have some animation and it's not working on the webex, at least on my screen. But the main difference between an inverse GC and an analytical GC is an inverse gc. You pack the column with your material that you want to investigate. A powder, a fiber, a film, a granule. And then you inject a single molecule down the column and we measure how long it takes to elute. The longer it takes to elute, the more that particular solvent interacts with the surface and the higher the surface energy. Now, the GC columns that we use are a straight 30 centimeter glass column with internal diameters between 2, 3 and 4 millimeters. We do have some larger diameters that can accommodate up to a 10 millimeter ID in our large column accessory. But to pack a sample, you simply put some silanized glass on the bottom, load your powder or your fiber or your granule, put some glass on the top to hold it in place. It's not necessary to fill the entire column, but you need a reasonable amount of surface so we can measure retention. This boils down to about 10 to 500 milligrams of material to get an average of about 0.5 meters squared of total surface area. That means if your surface area of Your material is 1 meter squared per gram, you might need half a gram. If it's 10 meters squared per gram, maybe 50 milligrams. For high surface area materials, as few as 5 to 10 milligrams is quite sufficient, as long as that material is representative of the bulk properties. This is a picture of one of our columns. You can see it's a glass tube that we salonized some glass wool to hold the sample in place, typically five to 10 minutes to pack a sample. If you want to use a flat planar sheet of material, we do have a film cell accessory that takes sample coupons approximately 5cm wide by 20cm long. And this allows us to do flat sheets of material where the gas comes in, gets injected, travels across the surface and then goes to the inverse GC instrument. As I mentioned, we do have the ability to control the relative humidity from 0 to 90% RH at 25 degrees C. And with the control software and analysis software, we have flexibility in terms of method generation and analysis properties that you want to measure. A recent study that we did in terms of reproducibility, I mentioned how inverse CC is one of the more reliable techniques for measuring surface energy of powders. This particular study is one of our technical notes. You can contact us if you'd like the full study, but we did both on one system, a multiple sample study, and then across, I believe, 67 different instruments. The reproducibility amongst instruments and we have the surface area which is able to be measured by inverse GC and the surface energy. And you can see the RSV values are quite low. And the absolute values are even more impressive considering the surface energy was about, I mean, the surface area around zero point and the standard deviation was 0.0027 to 0.006 meter squared per gram. And the surface energy was around 34 millijoules per meter squared, with the standard deviation around 0.15 to 0.38 millijoules per meter squared. So this is excellent reproducibility. And as I mentioned, we have a much larger study. If you're interested in instrument to instrument and experiment to experiment reproducibility, we can provide that for you offline. So to measure the surface energy by inverse gc, as I mentioned earlier, we break it up into a dispersive component. And to do that we inject a couple of dispersive molecules. So we use straight chain alkenes like decane, nonane, octane and heptane. Measure the retention times. Plot the retention volume times the R which is the gas constant times temperature versus the property of the solvent. There's different methods of what actually is on the x axis, but you get a straight line and the slope of this line is directly related to the dispersive surface energy gamma D. Then for the acid base portion of the surface energy, we inject polar or acid base probe molecules. What we directly measure is the Gibbs free energy of those polar probes. And then by applying various acid base theories, we can get acid base surface energy values. One thing to note, this is a Lewis acid base. All of these approaches are Lewis acid base, which is electron acceptor electron donor properties of the solid material. The SMS inverse DC has the unique ability to provide directly a measure of energetic heterogeneity of the surface. If we know the vet surface area of the sample and we know the molecular cross sectional area of the probe molecules, we can inject a number of molecules to theoretically cover a certain amount of the surface. So we can get one surface energy value for covering the first 30% of the surface. And this cartoon is just illustrating this. I'll show some real data later. And then we do another series of injections at a higher concentration to interact with a broader range of the surface, and so on and so on. Now clearly this is just an illustration. The molecules don't magically line up on the surface, but at low concentration, the retention times that we measure are going to be dominated by the most energetic sites in the surface. Then, as we inject more and more molecules to hopefully approach covering a monolayer of the surface, the surface energy values we get will be indicated or representative of an average surface of the entire material. So we can get surface energy values of the most energetic sites and then a wider and wider average value of the entire surface. And I'll show you an example of that with the first case study where we looked at some multiple walled nanotubes. This case study was done in conjunction with the Imperial College of London and we looked at some as received nanotubes from Arkema. These nanotubes were then annealed to a high temperature in Argonne in an inert environment. And then these address samples were oxidized to 240 degrees C in air for a few minutes. And then we measured the surface energy values. Our collaborators did some TEM of the as received annealed and oxidized. And as you can see, they all have similar sizes, similar Morphology. The SEM images again show similar texture and morphology of the three sets. So we're not drastically altering the physical state of the nanotube, just looking at the surface characterization surface properties. The BET surface area value show that as you anneal it, you decrease the surface energy slightly. But as you oxidize it, you increase the surface energy. I'm sorry, surface area slightly. Raman spectroscopy was used to as a measure of crystallinity. Annealing the surface does make it more crystalline. Oxidizing it does make it less crystalline. And as expected, as you oxidize the surface, you increase the surface oxygen content as measured by xps. So moving on to the surface energy data, let me walk you through this graph. If you're not familiar with this type of plot. We have dispersive surface energy on the Y axis and we have what's called fractional surface coverage on the X axis. This is essentially how much of the monolayer is covered or theoretically injected moles to cover x, y, z amount of the surface. So at zero or approaching zero. This is what's also called infinite dilution, where the surface energy values we measure are reflective of the most energetic sites in the surface. So we inject very few pro molecules. The retention time is going to be biased by the most energetic sites. And then we do another series of injections at a higher concentration to include more surface sites, and so on and so on and so on until hopefully these values level off when we approach an average surface energy of the surface. Now, looking at the actual samples, we can see the as received sample is moderately heterogeneous. We can see the surface energy values go from around 105 millijoules per meter squared down to about 90 millijoules per meter squared. When we anneal it, we make the surface lower in energy and more homogeneous. On the flip side, as we oxidize the sample, we increase the surface energy dramatically and we make it much more energetically heterogeneous. Dispersive surface energy values range from around 150 down to about 110 millijoules per meter squared. So just by doing some pretreatment on the surface, we can dramatically affect the surface properties. Now these surface energy profiles can be converted to a surface energy distribution. This is a very simple monomodal, simple distribution to visually represent the heterogeneity or homogeneity of the surface. And we can see the azure C sample in blue. And here would be the average or the mean surface energy. And then we can see when we anneal it, we make it more energetically homogeneous and slightly lower average. But when we oxidize it, we dramatically increase the average surface energy and make it more energetically heterogeneous. By the widespread in surface energy values you see here, the same measurements can be done for the acid base portion of the surface energy. And again, as you see here is the as received. When we anneal it, we make it more energetically homogeneous. When we oxidize it, we significantly increase the polar or acid base portion of the surface energy. Not surprising, because we're adding oxygen functional groups and we make it more energetically heterogeneous. If we know the acid base component and the dispersive component, we can get the total surface energy. And we can also get a plot of what we call surface polarity or surface wettability. This is essentially the acid base portion of the surface energy divided by the total surface energy in order to give an indication of how relatively polar the surfaces. We can see here that the AG received and annealed are fairly similar. But when we oxidize the surface, we increase the relative polarity or wettability of the surface significantly, and that's not surprising. So here we can clearly see how we can go from an as received. We can make it slightly less polar by annealing it, making it more uniform, or we can increase the surface polarity significantly by oxidizing the sample. So once we, as I mentioned previously, once we know the surface energy of individual components, we can calculate the thermodynamic work of adhesion, which would be, let's say, the particle to matrix adhesion. So surface energy component one, surface energy component two. And then we can compare that to the work of cohesion, which would be, let's say, the filler attracting to itself. So we can look at a balance between the filler material attracting to its health or cohesion, and then the filler attracting to a matrix. And then add. And this ratio will often tell us an indication of whether a material is going to be a good job dispersing into the matrix or a poor job. And that's what we'll talk about in the next case study. In this case study, we're looking at two different types of nanomaterials, a carbon nanotube and then a nanoclay. The carbon nanotube was oxidized to create functional groups and to activate the surface, whereas the nanoclay was passivated by grafting it with isocyanate groups. So we're going to look at two different materials and two different surface treatments. And then the polymer that we're going to use in the composite is the polyurethane matrix. So here are the surface energy values at infinite dilutions. This is at the low concentration range. And we can see that the nanoplay as received has a very high surface energy. Just to note, the dispersive surface energy is the solid bar and the acid base component is the shaded or lighter section. But the total surface energy for the NanoPlay is around 200 millijoules per meter squared. Very high surface energy, indicating this sample is going to be very cohesive. It will attract to itself. By functionalizing it with the isocyanate groups, we significantly decrease the surface energy or passivated the material. So we can see a large decrease in surface energy. That's for the nanoclay. When we look at the nanotubes, we can see that the nanotubes by themselves around 140 millijoules per meter squared. By oxidizing them, we increase the surface energy to about 180 millijoules per meter squared. So here we have done a surface treatment that's going to activate the surface, whereas this one we passivated the surface. And here's the surface energy of the polyurethane matrix. So now we have the surface energy values of the individual components and of the filler and of the matrix. We can calculate and work of adhesion and a work of cohesion. And that's what we see here. So as we see here, we have the nanotubes as received and we see the oxidized nanotubes. And what we can take a look at is both the work of adhesion and the work of cohesion. So this work of cohesion is the nanotube sticking to itself. And we take a ratio of adhesion versus cohesion. Ideally we want this to be high. Higher adhesion to cohesion ratio should lead to a better composite because you'll get a better dispersion of the nanomaterial. So based on the individual components, this one predicts that the oxidized nanotube will have a lower work of adhesion to cohesion ratio and will not make a good composite or as good a composite as the as received. And likewise for the nanoclays, because the isocyanate treatment significantly passivated the surface, made it lower in energy, we've dramatically lowered the cohesive forces. And we can see from here that the isocyanate functionalized nanoclay has a much higher adhesion to cohesion ratio, which would predict better dispersion of this nano filler into the matrix and make a better composite. So this is clearly on the individual components. Without even making a composite, we can predict which treatment might lead to a better or a poorer performing composite. So our collaborators at NIST actually made some composites in the polyurethane matrix with these nanofillers and tested the mechanical properties via dma. And if we look at the multiple wall nanotubes, we predicted from the surface energy data that the oxidized nanotube would not disperse as well because it had higher cohesive forces. And we can see that the tensile modulus decreases as we use the oxidized material, which had a higher surface energy. On the other side, we looked at the nano clay and we can see as we predicted the functionalized nanoclay, which was passivated and had a lower surface energy and a lower cohesive forces, we can see that that has an increased tensile modulus and a increased tensile strength of rate. Again, the predicted surface energy and work of cohesion values correlated with the actual composite performance. Now, as I mentioned earlier, there are other factors that affect adhesion, such as sample loading, capillary forces, swelling. But if you're just looking at surface energy and something that's easily tunable, we can see that we can change the surface energy of the material and thus affect ultimate composite performance. So my final case study is going to switch gears a little bit and look at a filtration case study where we're looking at activated carbon as a traditional filtration medium, a commercial grade nanoplatelet, and then a single wall carbon nanotube paper. And these are provided by Dr. Reginald Rogers Group at Rochester Institute of Technology. So we wanted to measure both the vapor absorption properties and the surface energies. These are vapor phase techniques to see how they correlate to an aqueous absorption result. As ultimately, we wanted to look at how these media will filter out a contaminant from a water stream. So we measured the vapor absorption by dbs, another one of our instruments, and we looked at the water absorption. These are normalized by surface area and water as a model polyprobe molecule. And that is the background medium in this filtration. In a liquid phase technique. We looked at octane as a model nonpolar vapor. Then we can look at the maximum water uptake and the maximum octane uptake. And we took a ratio of the octane uptake versus water uptake to see, relatively speaking, which material would have a higher affinity to for the nonpolar octane. Because, remember, we ultimately want to look at in a water environment, which sample would have a higher acidity to filter out the organic material that might be in this water based environment. And this is saying that the single walled nanotube sheets will have a much higher affinity for the organic material compared to the activated carbon and the graphene pellets in a water environment. We also did some surface energy experiments. At infinite dilution 0.06 surface coverage, we get a dispersive component and an acid base component. We calculate the surface polarity. Now it was actually the activated carbon was actually too high of an interaction with the polar surface groups that the probe didn't even come out. So this would predict it to have an even higher surface polarity or a higher affinity for the polar molecules relative to dispersive molecules, whereas the graphene pellets, you can see the ratio is 0.05, whereas the single wall nanotubes was even lower than that. So this is suggesting that the single wall carbon nanotubes have a higher affinity for the non polar components compared to the polar components. This is exactly the same thing we saw in the DBS results, because the single wall nanotube had a higher affinity for the non polar octane relative to the other three materials. So both vapor absorption and surface energy values suggest that the single wall carbon nanotube would do the best job of filtering out the non polar organic solvent from a liquid based medium. And we did. Some collaborators at Dr. Rogers Group did the actual aqueous filtration experiment using one pyrene butyric acid as a model contaminant. And they did some UV work to actually measure the absorption capacity of these solvents in a liquid based medium. And we can clearly see that the single wall carbon nanotube in red has a significantly higher absorption capacity and affinity for the contaminant in the aqueous medium than the graphene in the activated carbon, which is exactly the same trend as the vapor absorption results. So therefore, the vapor absorption and surface energy values agree with the liquid based aqueous filtration. So you could potentially use these vapor absorption techniques as a screening tool to see which surfaces will selectively filter out different molecules from a liquid based media. So, in conclusion, I want to say that surface energy is an important property for powders, fibers, films and granules. Supposed surface energy and wettability can be correlated to adhesion properties. Now, I didn't touch on it today, but we can measure other surface properties like heat absorption and isotherms, and even both properties like glass Transitions and solubility parameters. If you're interested in these techniques or these values and properties, please contact us so we can send you some application notes or we may have further webinars that would cover these topics. So my final slide would like to thank our collaborators who helped us with the case studies, my co workers, both current and past, at Surface Measurement Systems, and last but not least, your time and attention. And if we have some ability and some time, if there's any questions, please use the chat Q and A section and I'll turn it over to Bill to see if I've missed anything.
Okay, thank you, Dan. So this is the time. If you have any questions, please send them in using the Q and A or the chat windows. We do have one question. Do you have any data, information or references that correlate surface energy determined by IGC with that measure measured by contact angle using multiple fluids?
We do have some studies where we've looked at contact angle and inverse GC data. This is on planar flat surfaces. So we do have a case study, I believe, on flat aluminum surfaces where we looked at both contact angle and inverse dc. There are some other papers out there in the literature. If you look in traditional inverse DC data, most of that work is done at infinite dilution. And as I mentioned, infinite dilution is biased to the most energetic sites. So if I do a direct comparison between infinite dilution inverse DC data to contact angle data, the inverse DC data will typically be slightly higher in value. The surface energy values will be slightly higher. So it's important to know that looking at it. So just remember, you have to look at how the experiment was done, what concentration range was done, and see if that. But you would get the same trends in terms of one would be higher via IGC and one would be higher via contact angle. Contact angle gives you an average value of the entire surface, whereas if you're looking at inverse GC at infinite dilution, you will get a value bias by the high energy sites. So it's just important to make sure you're comparing apples to apples. But we can potentially get you some references. And I do know we do have one study where we looked at that ourselves.
Okay, thank you, Dan. One more question. How would the ideal adhesion to cohesion ratio differ between different composite matrix materials?
Okay. I mean, that's, that's a little bit more difficult question. And we didn't look at that. We only looked at one matrix. Ideally, you'd want that ratio as close to one if possible because you want the. You Want the sample close to one or even higher, you would want the filler material to be equally attracted to the matrix, well as to the filler material. So in order to get good dispersion, you want that ratio to be as close to one. So when I'm talking about putting in a powder or a nanomaterial or a particulate into a polymer matrix, ideally, that ratio should be closer to one. If you're looking at another indication, let's just say you have, like I mentioned, the car, car bumper. In that case, you don't have to worry about dispersion. In that case, the higher the surface energy, the better. So people often think higher the surface energy, the better adhesion. Well, it depends on the application. Like I mentioned, in these nano pillars, A very high surface energy actually leads to poor adhesion because the materials agglomerate and attract themselves and don't disperse. If you're just looking at wetting of a liquid onto a surface, then, yes, the higher the energy, the better it will wet. But for powders and fibers, when you actually put them into a matrix, not only the case. So my long answer, I apologize, was it depends a little bit on the application. But in general, you'd want the adhesion cohesion ratio to be at or near one for optimal dispersion.
Thank you, Dan.
One more question here.
How do you convert retention time into surface energy values?
Sure, I went over that rather quickly, and I didn't get into the details of that.
But.
Let me just go back to these slides in the beginning here. Okay, so we take the retention time. The time is directly remeasured from the chromatograph, the retention volume, which is the volume of helium that was required to push that molecule to the surface. So, based on retention time and flow rate and temperature, we can correlate that to a retention volume. And then we take rtlnv and from RTLNV is directly equal to delta T. That's your free energy. And there are a few methods in the literature. One is called the Schiltz method, where you plot RT lnv of these different alkenes versus A, which is the cross sectional area of the probe molecule times the square root of the liquid surface tension of the probe molecule. So these are of the probe molecule of the liquid. And that gives you a straight line. And the slope of that line is related to the dispersive surface energy. There's another technique called the Doris and Gray method with plots rtlnv versus alkene number, and that gives you a straight line and the Slope is related to the dispersive component of the surface energy. So in essence you're looking at the relative change in retention time and or volume as we change the size of the probe molecule. And we use non polar straight chain alkanes that only have dispersive forces to get dispersive surface energy. And the acid base portion is we plot it on the same line since they will have both dispersive and acid base interactions. Let's say ethanol would be somewhere up here and we subtract out the dispersive component and only get the acid base component. And then we have to use different acid base theories like the Guttmann or the good Van Os Chad theory or there's other concepts like the Drago concept to get acid base surface energy. So that's essentially how we convert retention time to surface energy values. The fundamental thing is RTLNV is equal to delta G or Gibbs free energy. And that's from chromatography theory.
Okay, thank you, Dan. I think we're going to wrap it up here. If you have any more questions, you can always send them to us@scienceurfacemeasurementsystems.com then our application science team will get back to you with an answer. I want to thank everyone for joining us. I hope it was informative and useful. If you want to learn more about IGC, you can visit our website www.surfacemeasurementsystems. and thank you Dan for presenting today.
All right, thank you. Have a good day everybody.
More from Prof.

Webinar: Advances in Measuring Gas and Vapor Permeation Through Membranes and Barrier Polymers

Webinar: Determining Solubility Parameters of Bacterial Cellouse Through Energy of Adsorption

Online Webinar: Recent Technological Advances in Adsorption Based Direct Air Capture

Online Webinar: Surface Area of Pharmaceutical Ingredients at Real World Conditions by IGC



Hybrid Workshop: Measuring Material Vapour Pressure Properties Using Advanced Sorption Technique

PCL Hybrid Workshop: Recent Advances in the Characterisation of Pharmaceutical Powders


Using Advanced Techniques to Test the Performance of Recycled Bathroom Tissue | A video summary
