Workshop (BOKU): Vapor Sorption Techniques for Characterization of Wood and Biomaterials
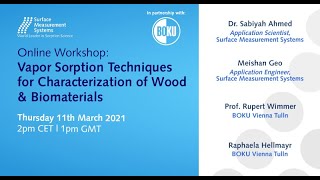
Tomas Schmidt from Surface Measurement Systems and John Wimmer from the University of Vienna explain how vapor sorption techniques characterize wood and biomaterials. The workshop covers technical methods for measuring how these materials absorb and release moisture.
Chapters
Thank you for joining us everyone for today's online workshop. Today Surface Measurement Systems have collaborated with beaucoup, the University of Vienna for today's session. We're really happy to have them on board and I really appreciate their collaboration on this on this event. The title of today's workshop is Vapor Sorption techniques for the characterization of Wood and Biomaterials. To kick us off today we have from Surface Measurement Systems Tomas Schmidt, our technical support and sales manager for the DAC region who will just be giving us a quick intro into Surface Measurement Systems and the machines and instruments and science used to carry out and find some of the results in this. Thomas, I'll pass over to you now.
I just would like to introduce you as Measurement System. Not everyone knows the company and all and I'm sales manager for Austria, Germany and Switzerland. Yeah, so we are Surface Measurement Systems what we are doing we are doing and manufacturing dynamic vapor absorption instruments called DVS Inverse Gas Chromatography I.e. iGC Surface Energy Analyzer, Vapor Pressure analyzers, Gas and vapor vacuum absorption instruments, EVS vacuum. We are of course doing in house all software and I will go through that topics during the next 10:15 minutes. So surface measurement System develops and engineers the techniques and the instrumentation for that Physico chemical characterization. I told you for dynamic vapor absorption and inverse gas chromatography. So we have a range of instruments to cover problems and specialty research in different markets establishing the pharmaceutical industry, biomaterials, polymer catalyst, porous materials, chemicals, cosmetics and food industries. So you see a broad range of different industries and this for the last 30 years and with that we have bundled 90 years of combined scientific experience in that area and that's a little our our strengths first we are pioneer in that sorption instruments and also our scientific expertise is our. Our strengths. Yeah, we have dedicated application size group so dedicated application scientists and product experts. Most PhD people having a PhD and a team of qualified also service engineers to assist you and to support you. And during the year we are doing some symposium webinars workshop as this one here at Bokovena. So the company was created in 1990 by Professor Darrell Williams. He's a very well known scientist professor at Imperial College. He was professor at different universities in the States that was earlier in Australia and he created 1990 surface measurement systems for making that first EVS dynamic vapor absorption analyzer. The customer at this time was Pfizer. There was no other product or system on the market for dynamic vapor sorption. So what else? In short we'll have presentations later with examples which are much more also interesting. DVS measure the uptake and loss of moisture and organic vapor. So you can do both with DVS water absorption and organic vapor sorption. The core focus of IGC is surface energy. But it allows also characterizing surface and bulk properties of powders, particulates, fibers, films and semisolids. As I told you, we have the vapor pressure Analyzer. It's to measure the vapor pressure of solids and liquids. Last but not least, that's a DVS vacuum instrument which is dedicated for more porous materials on trying experiments. So here you see a little of the range starting with the DVS watersorption between 20 and 40. The DVS adventure covering a broader temperature range between 5 and 85. Able to have some options as Raman spectroscopy. It's a in situ Raman spectrometer to look on the sample or a camera, a video camera to see some changes of the sample, optical or phase changes. The DVS resolution has the same options. It covers water and organic solvent. That's the big difference. And the DVS vacuum you see on the left side with this vacuum pump for all that drying experiments and sub ambiented experiments. And the DVS endeavor is more for high throughput means. You can measure five samples at the same time. Absorption, isotherms and also kinetics. Yeah, I just want to go through, I would say a few points you can measure with dvs. So the question is how does material interact with moisture or solvent? What is the stability of my material?
And.
It'S about performance and processing issues. Is that material reversible or non reversible? In absorbing water vapors or organic vapors, you can create moisture isotherms. You can see if how homogeneous is your sample measure or see the difference between different batches. For example, measure kinetics of uptake and diffusion. You can measure the moisture bonds, it means the heat absorption of water of organics. And characterize phase transitions, glass transition, recrystallization, polymorphism and other transitions. With DVs characterize hydrates and solvates, drying analysis, diffusion and activation energy, heat absorption and of course, last but not least, moisture uptake and content. Perhaps you have seen already things which are interesting for you and where you would like to ask questions later. And we have that surface energy analyzer igc. It is mainly used for formulation, design and also for pre prediction in the process performance of powers but also of solid materials. The IGC has a strength which is to measure or map surface energy and to measure the homogeneity of surface energy on the surface of your sample. So here are also a few points. If you are interested in dispersive or polar surface energies of your sample in heat absorption, in acid base interaction and acid base properties of your sample. If you're interested in the BET specific surface area. If you're interested in phase transition, especially on the surface of your sample here the IHC is very sensitive if you want to measure some sorption, isotherms, solubility parameters in water and other organics, competitive sorption and of course related to surface energy, the work of cohesion and adhesion. Last but not least, very important measure heterogeneity of the surface of the sample. So for all that instruments we are also having dedicated softwares and everyone knows how good it is to have a comprehensive, user friendly, intuitive software. All the software of all our products are made in house. The it, the software specialists are sitting in front of the application specialist and that allows us to have a really user friendly software. And those who know IT can also tell that. So in summary, we aim to expand the frontiers of particles with our instruments. We are pioneers in water absorption and organic sorption instruments. We put through innovation instruments and provide instruments on the market to be a technological leader for DVS and IGC instruments. And we are supporting and servicing more than servicing customers all around the world with also application note with publication and case studies. So here you see a little. The family was at a SACE meeting last year in 2019 and I hope it was not too long. I am happy to pass to Professor Dr. Wimmer. I know him since for many years we worked together at the university in Gottingen where he bought DVS Advantage. He bought also a DVS at Boku in Vienna. And I must say I have had that over 11 years, 12 years. A very good collaboration with Professor Wima. And I pass the word to John and to Rupert Wiener, please.
Good afternoon. Mr. Schmidt introduced me and now we have been knowing each other for many years. We have the second machine here at Boko and the feeling I need this, the update of it, the advantage really advanced a lot. What I picked up from Mr. Schmidt the information I received. So that's the disadvantage of a fast moving company like you that the machines always upgrade so fast. So you need a new machine after a few years. But it's still used a lot here and more people get involved of using it. Of course absorption isotherm is always on the front of interest and that's our advantage picture of it. And we had this camera initially Purchased which we changed to higher resolution one because you want to look at the wood structure more. The new one is not working with the software so there's an upgrade needed. So you always have to think about to to get the system moving ahead and so forth. What I have planned for you to present to show examples of things that we have done in the past couple of years. So it's kind of from the workplace to the workshop report. So it's not just one high sophisticated scientific presentation. It's more highlights from various applications that we have been using the machine. Actually I would wish to use it more and more sophisticated but often it just takes time to get the budgets and the people interested working on it as well. So I'm starting with the first example that we have been doing within a PhD study with quite a big food company here, international company who do also thermoplastic starch which is a big issue bioplastics. And you see on the right lower side there's a sorpt Schneiderm and I show a few things that we have been doing with that. This company is often coming and you know, they want to check. So we do services as well. Thermoplastic starch films. Sorption behavior is very important to know. And this is from the publications that we created with the PhD student at Dr. Van Gruber. She has been working with various techniques including the dvs. So you see basic absorption isotherm of that material. And that's always interesting when you run a material you are not familiar with. What will be the outcome? Do we see hysteresis? Do we see the lower and the higher part? Big differences. But this looks quite, I would say normal when you are used to look at wood isotherms. So we studied for example the effect of additives on the behavior on the sorption behavior of thermoplastic starch film. So like there is here a control, you see there's no hysteresis. And then we have, we added an additive and processing additive which helped better processing but also changed the slightly it looks very low change but even the change was visible. And so in that case potato fiber additions were added to the thermoplastic starch films to improve properties, including mechanical properties. And it increased the equilibrium water content at full saturation. You see that point is moving up a little bit. So that was changed. And also it triggered hysteresis because that addition created nanopores in the material. So that's something that's quite valuable from an industrial point of view to Understand the material because the customer experiences some properties. And of course you need to understand what you are developing. So that's one example that we published in 2019 with different contents of potato fibers in the thermoplastic starch, processed it to, you know, blow extrusion and then tested films that we cut out from those foils. Another one was malic acid addition as a processing aid to the same material. It's a little bit of a different type of thermoplastic starch because we had this PBAT copolymer included. And we measured here, you're seeing here the diffusion coefficient that we calculated. So the rate of moisture of vapor transfer through the film using the pan cell. You see here all kinds of results. I won't go into all the details, but what you see if you have basically three blocks of graphs like the one because we use different types of malic acid additive, the mixture, the racemate and the left handed enantiometric and the right handed malic acid additive. I would say this was not a very applied thing. It was more a curiosity thing because this is super expensive as an additive. But even if so, we wanted to know if it has an effect on the film properties of the resulting thermoplastic starch. And we also looked at the sorption behavior and you see here, just looking at the graphs and the lines that they are significantly different. And so they are basically that was the first thing we realized, a function of relative humidity of those films. And with the MA types, malic acid additive contents and types that we have added, we have seen overall that MA is capable of reducing hydrogen bonding. You see here when you go from Mar1 to 3, so there's a higher content at the number 3 type that the curves that the diffusion coefficients are going down in this case or lower, you see the high stereosis is changing as well. So this was valuable information for the industry in the discussion. You know what they want to change in future. Because that market is picking up at the moment greatly with the biopolymers. Another application that we have worked on with Swiss colleagues was looking at gluten based wood adhesives. So these adhesives have been used a lot in historical artifacts and in restoration. You have to use the same type of glue. So the understanding of that material and with all these bio movements at the moment they are more in favor of in addition to that historical application. So we compared different gluten based like fish glue, bone glue, hide glue, and they were responding quite similar always that up to 70% of relative humidity. You're picking up about 15% of moisture in the monolayer region. But in the poly layer region it greatly raise rises up to 60%. So beyond 70 we get a great huge absorption of vapor, which is not the new information. Just get the details on that. A comparison is a one component poorly urethane adhesive. This is this line at the bottom here which is almost, you know, non responsive to vapor changes. Just a few percentages are picked up as a comparison. So that was published 2014. In another study we looked at commercial adhesives that are used a lot in wood gluing, which were phenol, resourcinol, formaldehyde, melaminary formula height. So both are used in constructions and also composite materials. And the china's glue, the PVA polyvinyl acetate and two types of polyurethane. And the same thing, the polyurethane. There's no hysteresis and they're very lowly picking up the vapor. Whereas. And that was for me, I remember when I were looking at the graph first time, you know, the PRF are picking up moisture almost like wood or the mof. So when you look at the glued situation, you have wood and you have a glue line, moisture is migrating maybe from the one to the other side. There was a question, what happens to those boundaries, to this glue line boundaries? Is it passing through and to what rate or is it absorbed by the adhesive? Do we have any swelling and loss of mechanical adhesion strength? It's all important questions. PhDs studies have been done on that question actually with the authors that are on the bottom. Professor Nims at the ETH in Zurich, he worked a lot on that and I collaborated with him on that issue. So same thing with the 70% relative humidity, the this is the hysteresis. And you can pick, you can sort out those who are strongly responding to strongly different between absorbed adsorption and desorption where the others are more weak. And so you see here a great uptake in water and a strong hysteresis like with MOF and prf phenolic resource, no formaldehyde. And then I applied diffusion study like the rate of water uptake using Fick's law of diffusion, using actually the software provided by sms. So the rate of water uptake as a function of square root of time. I referred a lot, I remember on literature that people have published in the dentist area, like epoxy, teeth filling polymers, they have done a lot of studies on that. So I did the same thing with the adhesive films that I had. And the interesting, quite interesting result was there were slow diffusing ones and fast like fast water uptaking ones. And the ones that were slowly responding to water change like the. The dynamics of water uptake were those who tended to be here highly absorbing water. So when it comes to the historical fish glue actually behaving better in terms of slow slowly responding compared to the phenolic resolution of formaldehyde. So this. This was teaching me that it's not just how much water gets picked up because in a subs. I'm going back to that slide. You looking at the static curve like you always because all the points that create these lines lines where the whole the system is in equilibrium. Where this is the dynamics of uptake of water relative to the time that is spent on this. Okay, so that was that case. That publication was quite nice or well received by the scientific community because there were not many studies out. And I would still say this is still very an open area where you can publish a lot. And because there's not so much information available in the literature still even that is a few years back, there's lots of room to contribute which is always interesting for a scientist because you get discussions going A recent study at Boko here with a colleague from the chemistry neighboring institute here. And he works, the colleague works on aerogels. There are lots of types, these lightweight materials cellulose based. And they. They worked on tempo oxidized cellulose nanofibers. That's what they're using and producing the RHLs. And we were looking at the absorption behavior of that material. And I think I have seen Zwen in the list of attendees. So Swen who have worked a lot and he now left Oku worked on this material a lot. And there was a master student, Nadine and she worked on desorption in addition to the other things the has been doing. Like there's this monolayer content pmma this polymethyl metacrylate additive they are using to cover to coat those nanofibrils and they were looking like protecting them. Is there any. Do we see this in the absorption isotherm? And the answer is yes, we clearly see it. There was one thing and so there was clearly a trend that the expected trend. And we also could prove the higher capillary condensation was the reason because of the compression they were doing. They were comparing iron shells uncompressed and compressed. And we are looking at both materials. This is an example of the uncompressed one. And we had different denses as well. So lots of graphs. I'm showing this as one example of an application which worked really very nicely. And this is still up to get published hopefully during this year. So we just talked today on that. A few small things that I have been doing. I called it here industry application. I worked a number of years on granulates bio based granulates. And there's one brand name Fazal that the colleague has developed at his institute of Natural Materials Technology. This facade granulates that could be processed in injection molding to to components or an extrusion. You see here extrusion examples. And here we studied. You have those granules which is a compound of wood particles, natural resin and starch. Why is that? That's one of the recipes. And when you have those granules you have because there's quite a natural material picking up water absorbing. But after you running these granules through the injection molding machine to produce it and you see an extruded part extruder, it experiences a thermal history or the thermal treatment in the machine. And we will measure how strongly the thermal treatment during processing is affecting the sorption behavior. And that's quite, quite impressive change in the the properties. So thermal modification due to processing is something that we were able to show. This was in. This was just one experiment we did to discuss the issue with an industry partner. One very obvious questions. And this has been done in bigger studies people publish. That is like if you do steaming on this case, Rubenia pseudocatsia. And that's a wood that needs to be steamed because of warping risks. And so that's an often applied industrial treatment to the wood before it's used for a carpet, not a carpet for a flooring. Sorry. And you see here the unsteemed steam wood. There is a change. This change was not so traumatic. It was just one example of it. But there are publications out on that. But there's still open questions. How steam treatment or heat treatment. Of course, heat treatment is not a version of it. Steam would be moisture and heat treatment. How the absorption properties are changed. Another example. And if Gunter Bozeller is among the attendees, he knows these graphs because it was a collaboration with him. This is an interesting small study within a project that he was running. I won't tell any big details on it, but it was a polymer composite material where a mixture of a biopolymer and standard polymers with a natural fiber network included. So it would be a pyro polymer natural fiber compound. And because it Was necessary to equip that material also with a fire retardant agent. So the fibers were treated with a fire retardant agent components. Some specific treatment was necessary. And the question how is the behavior sorption behavior? And Rafaela has done all this analysis. How is it when you do sorption with and without that agent? And it showed when you look at the right picture with and without. There was big huge change. There was also a phase change that we picked up. But especially this fire retardant had a strong absorption behavior. And they changed the chemistry of it. And it was important information to know. Okay, now we come to work that Rafaela has done during her master thesis. Basically we're still looking at it, the numbers because we still want to publish it. And some of the results I want to present. And Rafael is available for a more detailed question. Or maybe she joins in if I say something stupid. She looked at different species, hardwood and softwood species. And you see them, you know, here maple, beech, oak, ash, eucalyptus. It was more. Of course we. We wanted to have the beech because it's known to be highly sortif and. But some other common species or some maybe not so common like eucalyptus and spruce large and pine as softwood species. She prepared this type of samples. She polished the surface and removed the dust with this grinding machine polishing with high grade paper. And we didn't use the quartz hanger that we had provided purchased from sms. We used actually by recommendation by the experts of sms. We produced self made by using a silver wire made our little hanger. Because we are looking from beneath with the video camera onto it, which we see in the next picture of our setup. The camera looks on the left side from below. So the lower side of the sample needs to be quite visible with the quartz angles. We always had reflections and problems. Here you see directly the surface. So that was quite handy and easy to get good pictures. I would say that our limitations was then the resolution of the video camera that we had. Probably because when the time we purchased the camera resolution was more moderate. You get much better cameras today I mentioned at the beginning. So you have to look at the resolution when you want to do wood analysis, structural analysis. So when we do all the pictures like these are 11 pictures. What you're looking at, I think or eight pictures. This is the beach. This is a steam beach. By the way. You see a little bit of the brownish color. This is a nice teaching tool. Actually videos too for the students. Because you see tangential radial swelling and shrinking could be demonstrated nicely. And you could see that potentially it's really twice the radial. These are little site products that are quite handy, which could be produced with the advantage that we have. Okay, so what I'm presenting some of the highlights that you found that are quite interesting to think about and like how long does it take to complete absorption cycle? So what she has done is she let the wood sorp at each stage a complete adsorption. You see like if you look at the red lines because they're quite well visible now, it goes from to 20, 20 to 40 and so forth to the maximum and then it does the whole thing back and then you just count up the complete duration of a complete sorption cycle. How long does it take and is there any difference between. And here we are looking at the three soft species we looked at. So Rafaela, she set up a criteria, mass over time for 10 minutes. When that is reached, he jumps to the next step, absorption to next humidity level. But she let the time because the time is limited. I think by standard 360 minutes, I might be wrong, but we extended that to 10 hours. So we really gave the machine the option to get the equilibrium. And so what the results quite interesting. If you compare large spruce, the larch took 50% longer than the spruce. And so novice spruce had the shortest duration where the European larch had the longest. Because then you start thinking about why is that the case? Because there's density differences and so forth. But the pine has quite a similar density. Larch is still different. So European larch is responding humidity changes much slower than Norway spruce. One detail that I haven't seen too much in other references, it was less clear with the hardwoods. You see the busy picture that they are presenting here. The European oak and ash had a slightly longer duration than the other species. So we got a few results here. But I think this is still a very interesting issue to look at and to work on. And you know, look at the time absorption. Another, another thing we, that Rafael has looked at to look at how long does it take at from 0 to 20, like step absorption step. So from 0 to 20 or 20 to 40. And look at the time that is required to reach that and compare adsorption with desorption. You see here, at the lower range the adsorption is faster than the desorption, whereas in the higher ranges it's the other way around. It's nothing outstanding finding, but it's something that you have to realize and the question is then the next step to look at the different Species how they behave differently. It could be extractive influences and structural influences that are all interesting to study. And next, quite interesting graph. My understanding is this one. And if you look at this picture at the upper left corner you see this is larix with the early wood and late wood quite well visible. And it was measured like the whole radial distance like that what it says radial. Then she measured individual rings like from the beginning to the early wood to the end of the late wood and looked at the swelling there by comparing look at the different humidity, moisture steps images that we have taken during the absorption course of absorption looking at the early wood only which of course is bigger than the lathwood. And lathwood, well this is a quite distinct lathwood here in that sample. But often latewood is from the percentage maybe 30% from the whole ring. So the late wood because it's quite tiny radially also experiences higher variability because the resolution of the video camera is limiting and giving you more variability obviously. So that's a measurement effect I would say. But so this is the radial distance of the late wood. What says here LW earlywood but all measured in radial direction. In addition she has measured in the gentle direction and measured the swelling there after late wood. So radial swelling in earlywood of zoftwood was one third of the swelling measured in latewood. You see here the earlywood and the late wood difference. It's quite a dramatic difference. So earlywood and the second finding highlight finding here was earlywood has anisotropic swelling properties while late wood is isotropic. If you compare the late wood with the tangential like this is the radial latewood measurement and the tangential measurement there's no difference. So isotropic whereas in the, in the the Earl wood lathe difference is this is big. So the anisotropic behavior is there where within the late route we see more isotopic behavior. This is interesting because when there's movement, so there's more movement in the later than the early wood. That's not something that we would have expected because there's a great density difference. But of course that's also the reason why it creates internal stresses. When you have those data you could calculate those entire stresses development and you could apply other methods. I want to refer to one method that we have tried and where my colleagues at the Mendel University in BRNO and some of them are in the auditorium listening what I'm saying right now. They are experts in digital image correlation. So that's a method. There's one slide Just mentioning it and not showing huge results on it. So this same type of presenting this graph resolved in individual species. We realized again that the largest kind of special it has the highest swelling in radial tangential directions, the late wood. Because of the variability resolution issue. I'm showing this here the greatest variability found in latewood. But the resolution we don't see the large here being highest. But that's a resolution issue. So high resolution of the video camera is important.
Okay.
Within ring swelling analysis. Now that's the one I have already mentioned. But if you want to know the within tissue movements during sorption digital image correlation is a very good supplementary method that you could add to a DBS that has also a good camera built in. Because you need to be able to realize a pattern at the surface. But the wood structure gives you enough pattern to get picked up. So when there is movement. When you think back on the little movie I was showing, the digital image correlation can give you stresses and strains pictures and analysis, we have tried some of it. I have all the results. But we are not at the stage that it could be communicated well. But I know that the colleagues at Mendel University are working on that and they also have a few days now. So they might be working already hard on it. If there's any comment from your side from my Menlo colleagues, it would be nice to share. Actually I'm about to finalize the examples I'm presenting to you. There's one other step who worked on the DBS and wood and structural issues. And this is a graph that wood scientists know that that is the case he calculated he picked up from the small samples differential shrinkage. So the shrinkage rate per percentage of of moisture change which is called differential shrinkage the swelling and then you laid it. You measure the density of the sample. And of course the higher density gives you the higher differential shrinkage. That was a DBS created image because I mentioned large a couple of times. I highlighted here the large and it says softwood. The lower density and the hardwood quite interesting that they are quite different because early wood and yeah are softer than hardwood. Not early with the late wood softer than hardwood. The hardwood extractive content of Phalarix can be very high. Is we have investigated a few years back because of arabinogalactans and phenolic extractives could be up to 30% of mass ratio in the hardwood. Not the case with these samples. But the hardwood extracted content could be very high. And this would be all contributing to the absorption behavior and other species like if you if you look at the oak, this is the oak softwood and the these dark purple ones, the pinky ones are the softwood and the purple ones are the hardwood. Also quite interesting how they, how they are distributed. So this is the radial shrinkage which had the highest correlation with the density. Another example is tangential shrinkage. Not as well correlated with density but still you see here the Larix softhood and hardwood also from density different but not so expressed in the tangential differential shrinkage because just not showing up because of structural reasons. Quite interesting to argue why that is the case. Okay, I am at the end of my presentation A few minutes before I started I wrote up this conclusion. So they're very spontaneous because this is what I think is the case when it comes to DBS and wood is one of my own conclusion is there are countless opportunities for wood and wood based materials. I mean I also did wood based materials, particle boards, single particle boards, fiber boards. I have not shown any results on that. There's so much work to do in here to understand disruption behavior. And so I say there are many challenging questions on sorption on. On our materials for those you know working on wood. And I would say natural materials on top or in addition they're simply undone. I'm thinking of fiber saturation point studies. If you look at literature it's know how to calculate measures fiber saturation point. I I experimented two years back a little bit and it it's still not done. And desorption speed still very open and interesting to look at. Time sorption issue of course modifications a thing that people have been doing a lot. When I look at the literature what gets published the people in Gottingen published some papers on that and others absorption dynamics. Also organic vapor sorption that Mr. Smithas mentioned beginning. So not just vapor water vapor but organic vapor. Question is is it interesting to wood? Answer yes, but maybe limited. But still I have tried like paints. When it comes to very industrial applications surfactants or some materials that you put on wood surface protection. Organic vapor absorption could be an interesting option. We also tried to study formaldehyde emission in particle boards. That's also possible I think with the newer type of machine the machine can handle that. And that's also a super option for the future. So. So option of wood is one of the oldest wood science question and issue. But wood go back decades and I always feel with the DBS options we have today available, the good machines it's kind of a revisiting that issue and expanding through a great new way of looking at these phenomenons and learn more how it behaves. So thank you for your attention. Yeah, we are ready for questions.
Thank you, Professor. That was a great presentation. We have two questions right away. And while the professor is answering these, we do invite you to submit your questions in the panel to the right. So we have two questions from Alexander Murr and the first one asks why do the steamed Robenia samples show such differences in the isotherms at 0% relative humidity?
Why does it show differences in the higher humidity levels but not in the lower ones? I don't know. I have not studied in detail that phenomenon. I have seen a recent paper on it, so I'm sorry, I cannot answer in great detail here. I think the Gttinger people have published recently something on it and I'm not sure if you're aware of that. The person who asked the question. If you want I can have a look at it since I'm in contact with them quite a bit.
Maybe a topic of future research possibly.
Oh yeah, for sure.
The next question from Alexander is what was the change of relative humidity for which the radial swelling of softwood was measured? Is it a mean over the whole range of relative humidity or one specific step change in relative humidity?
I know the answer, but maybe Rafaela can say something if she's able to switch on the audio. Rafaela?
I think she just needs to unmute herself. I think her mic is plugged in.
There's this little button that is red that needs to turn into green. Yeah, but she did smaller steps within the one. I'm not sure exactly which range she used. Maybe she's probably okay.
Hi, Rafaela.
Hi. So yes, I've used the whole range. So from 0 to 95% water shrinkage and swelling. Because the.
Yeah.
In the beginning it was the idea to also do it for the small to it for smaller steps. But yeah, the resolution of our old camera wasn't good enough to do that. So I combined it.
But we were looking at smaller ranges. But then you realize the movements were so tiny. So you need to like getting the maximum to get it picked up by the. By the image analysis. Right?
Yes.
Yeah.
Thank you. Just to go back to Alexander's first question, he's now entered. Additionally the question is why do the points at 0% relative humidity in the absorption and desorption isotherms not overlap?
Maybe I just look at the pictures myself because I included this today. It was not even a study. It was just a curiosity measurement that I want to. For demonstration. Yeah, I know what he was Alexander is referring to. And it could be due to the measurement like a technical or procedure problem. Often you start at the zero point and not coming back to the zero like it's the lower. Yeah, the one curve was actually going into the negative. And it could be that after one cycle that you are not returning to the same status of the material because something happened to the material. I know it probably could be like a hydrate formation or the water is bounded in a way and not able to get it removed. Maybe there's something in the steamed one that there could be an issue here which I don't know which we haven't looked in closer. We had this issue that you're not getting back to the same point where you started with other materials. And it's known to other materials. And that's an issue that you have to look at because things could go on that could be the reasons for that phenomenon. Rafila, we had that issue recently with something. It was an. And with that company that I was showing the starch, thermoplastic starch. They have additive material. They exactly behave that way. And they're also hydration phenomenon. So you're not coming back to the zero point where you have started to sort after the disruption. You're not returning to the same point. And wood, it could be the same thing with some treatments. That's the best of the answer I can deliver.
Thank you. I think we have time for one more question from Sophie Kolk. And she asks, how do you define precise early and late wood regions? What about transitional wood cell areas?
Rafaela, you did the work?
Yes. So we defined it by color because we only had the images. And yeah, it was not super precise for sure. But we tried our best to separate the transition wood into early wood and late wood. So there was no sharp line where we said okay, now is early wood or late wood? Because it was done by hand. And yeah, that's also the idea why we wanted to implement the digital image image correlation so that that can be done. Yeah, more precise.
You know, there's this. There are definitions at the cellular level where the lumen radial distance, it has the same size as one single cell wall in the same direction. Actually, literature is not clear on it. I remember I have worked closely to find out how to define the early with later transition. But as Rafael said, for this you need high resolution camera because then you see cell walls clearly, which we. Our pixel size didn't allow that. So I would say if the same person does the. You Know put the marker where the early wood goes into the late woods. Then I think even do a constant error because the one person might do it a little bit different the other person. But that that error would not be very significantly a problem. But again the higher resolution gives you more options to make it more accurate for sure. The surface treatment that Rafaela did, because we have a lot of experience here with surface polishing because we do all this dendrochronology and you need to, you see each cell wall under a high resolution magnifying stereo microscope for example, you really see each cell wall clearly. We used up to 2000, I think was 2000 the maximum grid paper and then you. So you could see everything very clearly and, and make super definition of. But the camera was the limitation. Again.
Brilliant. Well, thank you. Thank you Professor Umar and Rafalia. That was a fantastic presentation. And I think that's all the time we have for questions. Now if anyone does have any further questions for our speakers, please do send them through to marketingurfacemeasurementsystems.com for our next presentation we'll be going to Meishan Gao.
So hello everyone, I'm Mei Shen, the application scientist from sms. And in my presentation I will just focus on very basic part of the technique as well as the instrument and some kind of applications especially in the wood and bio materials. So first of all, moisture will always cause some problems in the real industries or the precise performance. For example, in the food industry, moisture is related directly to the stability of the shelf life of the material. Or in case of the wood applications, the moisture content in the wood material will affect the swelling behavior as well as the Britannis of the wood samples and exceeds moisture will not only reduce the thermal insulation but also promote the growth of bacteria. So it's very important to study the vapor behavior of different kind of solid material to understand their performance at specific conditions. So in particular to the wood industry there are many factors may affect the water sorption capacity or the diffusion behavior of the sample. For example, the different species of the wood, different geometry of the sample as well as different treatment on the wood sample. So here we can apply the DVS method to characterize all these kind of different samples at a wide range of temperatures and relative humidities. So for the characterization of the material we can either use energy or heat as a probe. And in case of both DVS and the IGC technique we are introducing today, we are using molecules as a probe and it's a sorption technique. So based on the Interaction between the probe molecule and solid material, we can get all the information related to chemistry, structure as well as thermodynamics for the solid material. So when we're talking a probe molecule interact with the solid, it will be either absorbed on the surface of the material or absorbed into the bulk of the material. So by studying the kinetics for both sorption and desorption, we can then easily predict some kind of behavior of the solid material in the bottom here, for example, the shelf life or the stability of the material at certain temperature and relative humidity. So in case of the molecules absorbed on the surface, it will be either by physics option or chemist option. So in this case we can measure all the surface related properties, for example the surface area of the material, the pore size of the material, and we can also get the surface energy or heat absorption from a set of DBS data as well. And in terms of the absorption, the probe molecule will not only on the surface, but also penetrate the surface and go to the bulk of the material. So in this case we can determine the vapor induced phase change. Where we can get the glass transition humidity from the set of data, or in case of the last kind of interaction is the absorption into the lactose structure, which means the sample will change the structure in the presence of water or organic vapor. And this will lead to the formation of hydrate or solvate. So by the DVS technique we can characterize all these kind of different properties of the solid material during the storage or precising. And the parameter we get from the DBS data is more close to the one we use in the real applications as well. So some just basic comparison between the static method and the tradition, the dynamic wafer method. So in the traditional method, which is known as the jar method, each jar here will represent one relative humidity. So you need to put the sample in the jar, waiting for a very long time and then taking the sample out for the measurement. During this process you will have the problem of like contamination for the sample or the loss of the sample. So the result will be not as accurate as the dynamic wave resorption. So with the DVS method the main difference is we have a continuous flow of the PRO molecule to the sample, so we can achieve a much faster equilibrium. So the whole sorption and the desorption experiment will take just a few days compared to the jar method. Just one single point will may take a few months of few weeks or months in case we have a very sensitive balance in the system. So we can use very small Sample for the measurement like 10 milligram of sample, as long as the sample is representative for the whole material. And we measure the sample continuously without taking out the sample, so we can get a more accurate result without any contamination or the loss of the sample. And from the DBS data we can get both isotherms of sorption and the desorption. And the gap between sorption desorption is called the hysteresis gap, also telling us some information about the system, the material itself. So in general, DVS dynamic vaporsorption is a kind of gradimetric method. You measure the change of mass for the sample at different concentrations of moisture or organic vapor. And we have different configurations of the balance which allows you to put as small as 10 milligrams of sample. Or you can also put up to maybe 5 gram of the sample depending on different configuration of the balance you use and the condition for the experiment. We can perform the experiment at real work condition during ambient temperature and pressure. And we also have the vacuum system which allow you to degassing the sample under vacuum and perform the experiment and the vacuum as well. And here I just want to use an example from the DVS resolution which can perform the soption of both moisture and organic vapor as well as the competitive sorption of two different components. So in the middle here we have the micro balance with the resolution of 0.1 microgram. It's connected to both the sample pane and the reference pen. The carrier gas for the CISO can be dry air and could be nitrogen. And there are two photos at the back here. One is for water and one is for organic vapors. So the mass flow controller inside the system will control the flow of the carrier gas and desaturated vapor in ratio to get a certain level of humidity or partial pressure. And then the sensor will detect this mixture. And the mixture will flow to both sample chamber and the reference chamber at a constant rate. So the sample inside the chamber here will pick up the moisture and the mass change will be recorded by the balance. The whole stand like this one will be sit in an incubator with a wide temperature range from 5 to 85 degree, which means you can perform the experiment from 5 to 85 degree. And under the sample chamber here we also have an option to put a preheater that allow you to precondition in the sample up to 200 degree before the experiment EC2 just to remove any moisture you don't want. And we also have the ability to install a Raman or IR spectroscopy at the top of chamber here, and also a camera at the bottom here that allows you to take the sample images as well as the Raman spectra at the end of each humidity stage and get a complete understanding about the solid characterization. So just for example, with a freestyling material like this one, we run the DVS experiment along with the camera and at a certain point of humidity the sample will just collapse free and then go to the liquid form. So with the video camera it's a very functional tool to compare any change in the color or change in different forms or the swelling or shrinkage behavior of sample. And another combination with DVS and the Raman. So on the left hand side is the DVS data which you can see the right line for the change of mass for the sample and is the amorphous lactose material at 25 degree. So at the previous humidity steps the sample is picking up the moisture. And exactly at 60% RH here there is a significant drop in the mass. And this is due to the amorphous to the crystalline phase change because the crystalline material has smaller surface area as well as less sorption capacity. And you see at the second cycle here it's an irreversible phase change because you didn't see the same effect in the second cycle. And from the Raman data on the right hand side, at lower humidity steps, it's quite broad peaks showing the amorphous state. And exactly above 60% RH there are some new peaks showing up here which indicates of the crystalline state. So this Raman data just confirming with the DBS data that there is a phase change from amorphous to the crease line at 60% rhythm, just like the DVS data showing here and the same as the video camera you can see from the image as well. So this combination is a very good understanding about the material changes along with different humidity or different temperatures. So here I just want to show a very typical data that you can perform in the DBS instrument. So the blue line here is for the target relative humidity that you increase from 0 to 90% RH with 10% intervals. And the right line is for change of mass for the sample. So at each stage the sample is picking up the moisture, reaching equilibrium and then it's jumped to next stage automatically. And the first stage here is just the flowing of the carrier gas for the drying of the material. And sometimes it's very interesting to study this kind of drying effect at different temperature as well as different degree of the drying. And it's a two cycle experiment with both sorption and desorption. And you can see the second cycle just exactly the same as the first cycle. That means there is no irreversible change. Along with the pore size is a perfectly reversible precise. And this is the mass plot between the change of mass as a function of time. And if you take the change of mass at the end of each humidity stage when it's reaching equilibrium and plotting against the relative humidity, then you can get the water isotherm of the sample with the target relative humidity and the change of mass. So some kind of information you can get from this plot. For example, at 90% RH, the change of mass is about 20%. That means the sample has very good affinity with the water and the red line for the absorption and the blue line for desorption. And there is a gap in the middle which is the hysteresis gap. Just confirming that during the desorption the water molecule is not only on the surface but going to the bulk. But when during desorption step is a diffusion limited process that gives different kinetics compared to sorption. And if the shape of the isotherm is very close to type 2 or type 4 isotherm, we can also use the bet theory and the BET equation to calculate the surface area of the material from the sorption isotherm as well. And then I would like to go to the application for the wood and bale materials. So first is for the wood material there is a very simple experiment we perform on some natural wood. And we would like to investigate the influence of particle size or sample geometry on the water diffusion. So here we measure the water sorption isotherm of both sawdust and the chunk of wood sample from the Same wood at 25 degree and the right line for sorption isotherm. And the blue one is for desorption. So the soda sample with the uptake around 18% is much higher than the solid wood sample around 11%. And the solid sample also has a wider hysteresis gap between the sorption and desorption isotherm. That means there is more water diffusion happening in the solder sample resulting in a higher degree of bulk sorption. So with the DBS technique we can easily characterize this kind of behavior of the wood. That different geometry of the sample or different particle size may affect the diffusion behavior or the sorption kinetics as well as the equilibrium uptake for the wood samples. So, apart from the water uptake and water diffusion. We can also set up a method starting directly from 90% RH and then drawing at 0% RH to study the dehydration kinetics. So we can compare the sample at different temperatures like this one. So here summarize the same sample at different temperatures and plotting against the time and fraction of dehydration. And here you can study by increasing the temperature, the dehydration kinetics will be faster as well on this kind of sample. So these are just some very typical moisture software experiments we can perform with the wood samples. And we also did some study on the hemp samples with the water sorption of both hemp sheath sample and also hemp lime composite. So the hemp sheath, the blue lime, is a kind of woody pore of the hemp plant that has very low density due to its high porosity. And it can absorb very large amount of water in the pores. And in case of the right line, a lamp is a kind of binder that will bond with the hemp sheath to improve the thermal insulation as well as the vapor permeability using as the construction material. So from the DBS data we can see that the hemp sheave sample has much higher kinetics than the hemp limb sample. And this hemplime is also faster in the kinetics as well. And from the isotherm it's also clear that the water capacity decreases almost 50% when the hemp is mixed with the lime binder. And this is because the binder will go to the pore of the hemp blocking the pores. This will result in the lower water capacity. So this kind of hemp lamp composite can also help to inhibit the growth of fungi or bacteria in the wall because of the less water capacity. And here just shows the moisture absorption of different temperatures on the same hemp lamp sample. And you can see at 15 degrees it has a much faster equilibrium compared to 5°1. And this also indicates the improving of the thermal insulation behavior of this kind of hemp lamp composite. The next application is about the wheat straw sample. So straw sample can be used as some kind of construction material in the building industry. Or we can also produce the biofuel from the weed straw sample to replace the fossil fuel. And one of the crucial step of producing the belt fuel is the pretreatment of the straw sample to increase the accessible chemical size on the straw. For example, to increase the surface area, the hydrophobicity of the material and also the amorphous content inside the material. So with the DBS technique, we can characterize different treatment of the straw sample to study the BET surface area as well as the water sorption kinetics. So here the experiment we perform is a very typical watersorption from 0 to 95 degree percentage RVH with 10% step at 25 degree. And here we have three different samples. The non treated straw sample, the treated straw sample with some alkaline solutions and another treated sample after alkaline. We have an additional washing step at the end and we compare the mass plot of three different samples. And from the mass plot we can generate the isotherm for three different samples as well. So from this comparison in the isotherm you can see the three samples has very similar behavior up to 50% RH. But there are some significant difference in case of the higher humidity range. So with the treated sample, which is the pink one like this one, it has the highest uptake around 60% change in the mass at 90% humidity. And this is due to the alkaline solution removed the wax layer on the surface of the straw sample and creating more amorphous phase inside the material. And the amorphous phase in the cellulose has faster hydrolysis rate than the crystalline phase. And this will result in a very high water capacity. And you can also notice that there is no hysteresis gap between the softgen and desorption isotherm for this kind of material. And this is due to the swelling of the pores inside the material and resulting in the less capillary force for the water diffusion. And this means the water molecule can travel freely between the bulk and the surface in case of this treated straw sample. However, after the washing for the other treated sample, it's more or less identical behavior to the non treated sample. So these two samples behave very similarly, very similar uptake as well as very similar hysteresis gap as well. And this is likely due to the additional washing step that removes most of the amorphous cellulose, which is more soluble than the crystalline cellulose. And the similar hysteresis gap also indicates that the modification to the pore size mainly takes place in the amorphous region of the cellulose. And because the shape of these isotherm is very similar to a type 2 isotherm, then we can also apply this equation, the bet equation, the same as the volumetric technique to calculate the monolayer volume as well as the sorption constant from the sorption isotherm. And then with the cross section area of the pro Molecule we can then get the BET line for the samples and then calculate the BET surface area of the material. So in this case we get the BET equation from we get a really perfect linear BT flow for all the three samples. And here shows after treatment the BET surface area of the material slightly increase. And for the water capacity it increased a lot. So this kind of treatment of the straw sample just increase lots of size on the surface of the straw and and the washing will and also increase the amorphous content inside the material as well. And actually DBS technique can also marry the amorphous content of the material. And this could be a further research for this case study. And the last application I want to introduce here is about the cellulose material. So here we have three different cellulose material from the same cotton fiber. And we use the DVS technique to investigate the vapor sorption behavior of three different cellulose material. And here shows that the cotton linter sample exhibits the lowest moisture content while the alpha cellulose sample has the highest water uptake. And this is due to the cotton linter contains more than 90% of cellulose and also a small amount of pectin and wax while the alpha cellulose sample was treated after alkene alkaline. So this will remove the crystalline material inside the cellulose. And there is more amorphous phase inside the alpha cellulose that result in the higher uptake. And you may also notice that the hysteresis gap for different cellulose sample are located in different humidity range as well. And this is due to the structure inside the sample like the collapse of the nanopores or the swelling of the internal structure. And also there is a possibility of the contribution from the capillary condensation as well. And these are just very straightforward experiments we can perform based the DBS technique for the characterization of the solid cellulose material. And as I mentioned, DBS can also be integrated with Raman spectra that we take those kind of spectra at the end of each humidity stage for the cellulose material. So in that case we can study the structure change along with the sorption data as well. So I think that's all for my presentation. DBS is a very versatile and sensitive technique for the material characterization and it can study the BTs of the area, the softgen kinetics as well as like process distribution if you apply some organic vapors for the material as well. So I hope you will find this technique useful in your future research. And thank you Very much for listening.
Our Next speaker is Dr. Sabiha Ahmed Zabiya is an application scientist for DVS and IGCSEA surface measurement systems. She has a Master's degree in Pharmaceutical chemistry which she gained at the Queen Mary University in London and a PhD in chemical engineering from the Imperial College London. After, after getting her PhD, she started working at SMS as an application scientist working on our two mainstreams of sorption instruments. I will hand over to Sabir now for the final presentation of the day.
So in this presentation I'm going to be discussing the applications and introduction for IGC sca. So this is inverse gas chromatography surface energy analyzer. So IGC was first developed in the 1950s. It used gas phase molecules and a technique used for separation. In 2009 a surface measurement system developed an IDC SEA. This is a surface energy analyzer and it was specifically designed to determine surface energy and heterogeneity. And alongside this we are also able to analyze material and obtain properties such as option isotherms, heat absorption, solubility parameters and a few others which I will expand to. So compared to the analytical gas chromatography, what you usually have in analytical gas chromatography is a mixture of gas phase probe molecules which you would inject into a column and depending on the interaction with the column you have a separation of these molecules. So in turn what you would see is some peaks here based on the retention time and you can go ahead and analyze this inverse gas chromatography. You're actually packing the column with your sample of interest. And then we would inject probe molecules, known probe molecules, so a mixture of some alkanes and some polar molecules. And upon interaction with your sample materials you would obtain different retention times and different peaks which you can go ahead and analyze and obtain some physical chemical properties from. This is what a typical IGC SCA system looks like. It has two drawers on either side and a door in the middle. When you open up each drawer we can accommodate six different reservoirs. So this is where your solvents would go in. So to measure surface energy we need a mixture of some alkyne non polar probes and some polar probes. The system has a carrier gas of either helium or nitrogen. When you open the door in the middle, what you would see is two column positions. So here's one and two and this is where you'd put your sample. And each column is surrounded by a column oven and the column oven can go from 20 degrees to 150 degrees. We also offer a background humidity controller. So if you were to want to analyze your materials based on different levels of humidity, you can also do this. And in this case, one of your reservoir will have to be water. We have a flame ionization detector and this is to accurately measure the concentration of the organic vapours. We also have some safety features, so hydrogen leak detectors and organic vapor leak detectors. And this can be found on the panel here. IGC is a very versatile technique. Here are some examples. At the bottom of what we have managed to pack into a column and analyze successfully. We have carbon fiber, cotton, hair, some granules, powders, and even some medical metal implants. So for sample preparation, what you usually have is a sample column which looks like this. And this is much more straightforward than packing a GT column effectively, this cylinized glass column. What you would do is plug in some silanised glass wall, funnel in your sample of interest and close off with some silanised glass wall. We also have a nice U shape clip to show how straightforward it is to pack a column. We also offer different sizes of columns. We have 2 millimeter, 3, 4 and 10 millimeter columns. 2 millimeter columns are for kind of fine particles. 3 millimeter columns are slightly larger particles. 4 millimeter columns are to accommodate fibrous materials and larger samples. The 10 millimeter column is specifically for samples. Let's say you don't wish to kind of break up. So this could be a block of wood or a tablet sample where you wanted to analyze the sample whole. In this case of a 10 millimeter column, you would need a slightly larger column oven to accommodate. So what you would first do during an experiment is pack the column with the sample of interest. You can then go ahead and go to the software. And what the software does, it allows you to choose some polar probes and some non polar probes. And the non polar probes kind of give rise to more dispersed interactions. And the polar probes for specific interactions. You can then choose how to inject them. So we can inject them at very small concentrations, infinite dilution or larger concentrations, and then you can start your experiment. So upon the interaction between these probe molecules and your sample, you would obtain different retention times, which you can go ahead and analyze the peaks. So the IGCSE comes with two different softwares. One is the control software and this is directly linked to the IGCSEA system. This is where you can carry out your method development and run your experiments. You also have an analysis software. This is where you would analyze your data straight after your experiment. Is done and it's relatively quite straightforward to analyze your data. You just select beginning and the end of the peak of interest and then click Calculate and you're able to analyze all these different parameters that you can see at the top here. So there's a few different properties that we can measure using Gaija cse. The most common is the surface energy. And because we're using acidic and basic probe molecules, you can also have an understanding of Ka and kb. So the acid base interaction. We can also determine the BT specific surface area, face transitions and also absorption isotherms. We can also measure things like work of cohesion and adhesion. Because we can inject multiple injections and concentrations across the surface of the sample. We are also able to obtain heterogeneity mapping across the surface. So this is an example of a VET experiment. So this is looking at a standard reference material and this is in this sample we're using aluminium, we're using 500 milligrams of sample and carried out at 30 degrees. We're also able to do some preconditioning in IGCSE. So we can prior to any start of any experiment. What we can do is allow for some column conditioning. This is all in situ inside the igcse. There's no need for any hourgassing facilities. In this case, we've used octane as our probe molecule and this is a resulting isofm. We've then applied the BET equation and as a result the BET plot. In this case, what we wanted to do is kind of compare our chromatographic method with the traditional volumetric method and see what kind of results we obtain. As you can see, we have very good agreement between both systems. Another thing I mentioned that we can do in the IGC SCA is apply relative humidity on the surface and see how that affects some properties. In this case, we're looking at the surface area of our previous sample. So we've carried out the BT experiment at 0% relative humidity and obtained about 3 meters squared per gram the specific BET surface area. We then introduced relative humidity at 50% and also at 90% and what you can see is a decrease of METI surface area. And this is because since we're introducing water onto the surface of the samples now when you introduce your octane and inject your octane, now the octane is actually competing for the water at these sites. As a result, you have a trend of decreasing surface area. However, all samples do behave differently. You may have and swelling caused by applying relative humidity and that will lead to an increase of BT surface area. So the most common thing to measure using the IGCSEA is surface energy. So surface energy is analogous to the surface tension of liquid and we can understand how the surface reacts compared to the bulk. For this we need two types of probes. So we need to understand the dispersive component. This is in the form of using some N alkanes and this gives rise to physical long range interactions. We also have to inject some Lewis acid base components and these are in the form of your acid base probes. And this gives rise to kind of chemical short range interactions. So prior to running the surface energy experiment, there's a few things that we need to know. First is our BT surface area. So as we've seen that we can carry out BTE surface area using the IGC SCA or alternatively, if you have the value known, we can just plug that into the system. We also need to know the known molecular size of probes. So with the idcsea, we have a database of a library of different probe molecules with their physical information. In this case we will have some known properties of your polar probes and your non polar probes. So what we need to do now is kind of look at the system and we're now able to calculate the amount of mould or the percentage that of our probe molecule. We need to cover a certain coverage of the surface of our sample. So once we have all this information, we can then go ahead and run the experiment. And depending on the interaction between the fomolecules and the sample, we will obtain different retention times and volumes and we can go ahead and analyze these peaks. Surface energy is an interesting property because it can be related to other different types of properties. With increasing surface energy, you have an increase of wettability. You also have an increase of cohesion. So this is how likely your materials are likely to interact with itself. Because we can inject multiple injections at different concentrations, we can also have a look at how homogeneous or how heterogeneous the surface of our sample is. We can also measure work of adhesion. So this is the interaction between two unlike materials. So if we have two different samples and we want to measure the adhesion between these two. So in this case study we're just looking at some synad mannitol and give you kind of a look at how some data looks like. In this case we have two different materials. We have unsalinized D manitol and silaned demonitol. This is looking at the dispersive surface energy and the x axis looking at. So this is the injections that we've introduced onto the surface of our sample and the dispersive surface energy is as a result of your non polar interactions. There's two things we can see here is the difference between our silanez and our untreated D mannitol is that firstly our sinus has a lower dispersive surface energy and our untreated mantle has higher. You can also see at this region here, the infinite dilution region, we actually have a greater dispersive surface energy for the untreated demand at all. What this is telling us is that at this concentration we are able to actually access a higher energy site, higher active sites on the surface of our sample. In this case we have a high dispersive surface energy and these sites are not available in our silaned minotaur. This is giving us an idea of the surface homogeneity or heterogeneity. The more linear our profile, the more homogeneous and the more curved our profile, the more heterogeneous. We can also take a point by point integration of these points on this profile and as a result we will have the dispersive surface energy distribution. What this is telling us is that the wider our peak, the more heterogeneous our surface. The more narrower our peak, the more homogeneous our surface. So now I'm going on to look at an application regarding the VT surface area of some fibres. This is the resulting paper with all.
The.
All the experimental details noted in the paper. So the materials we're looking at here is cellulose fibres. So we have three different types of fibres. First we have our industrial fiber. So this is a cellulose fiber called Biomid and this is produced from dry jet wet spinning process. So in this case it's a processed cellulose fiber and the other two we're looking at are natural fibres. In this case we're looking at the kina fiber and flax fibre. This is the resulting SEM images and this is the BioMed, the Kinaph and the flax fiber. And you can already see slight differences, especially in the cellulose fiber, which look quite uniform and thin fibres compared to the kina fibre and flax fiber which are showing some surface roughness on the material. So what we've done is calculated the BT surface area of the materials. So we've done a reproducibility experiment where we've done three consecutive runs and calculated the mean and standard deviation. So in this case, what we can see is that our flax fiber has a higher VT surface area compared to the other two. We can also see that standard deviation varies slightly too, with the flax fiber having a higher standard deviation and our processed fiber having the smallest standard deviation. So the specific surface area of the flax and the kina fibres can both be attributed to the surface roughness of these fibres and as a result have a slightly larger BT surface area, slightly larger standard deviation. We've also done some batch to batch variability studies as well. And what this is telling us is that looking at our processed fiber, we're very small standard deviation across batches, again suggesting that because these fibers are processed, they are much more uniform. However, with our other two materials we have a much larger variability from batch to batch. This is the consequence of the natural fibers having some structural irregularities and much more heterogeneous. So we've also done some surface energy experiments. These are the two distribution profiles. So we have the dispersive distribution here and the specific distribution here. And what we can see is the two natural blast fibres are more heterogeneous with regards to both the specific and the dispersive surface energy. So these peaks are much more wider. And of course, because the cellulose fiber was produced by wet spinning, we can actually see that this actually contributes to a much more homogeneous surface. The next example is relating to polypropylene material and polypropylene treated with a zine protein. So the purpose of the IGCSEA was to understand the differences between introducing this zine protein, which has high content of hydrophobic amino acids, and we want to understand the protein hydration as well. So we want to introduce humidity on the surface of the sample. So we've introduced humidity at 0, 40, 50, 60, 70 and 80% rhythm. So this is the dispersive surface energy against some different surface coverages. And what we can actually see here is that our polypropylene with the zine protein has a lower dispersive surface energy compared to polypropylene on its own. So what is telling us is that with the introduction of the zine protein, we're actually lowering the surface energy of the material. What we can also see is by looking at the infinite dilution region, is that the polypropylene on its own has higher surface energy sites which we are able to access using our probe molecules. So in this regard we can already assume that this material is much more heterogeneous. If we plot the distribution, we see that that is apparently so, so the wider the peak, the more heterogeneous and the more narrower the peak, the more homogeneous. We've also calculated the specific surface energy. In this case, we've used dichloromethane and ether acetate as polar probe molecules. And what we can see here, again in the same trend, that the polypropylene with the zine protein has a lower specific surface energy compared to the polypropylene on its own. And looking at infinite dilution regions, we can see that the polypropylene has a larger peak width and therefore still very heterogeneous. We've also calculated the KA and kb. This is the acid and basic properties of the material. What we can see is that the protein incorporation doesn't cause a significant change to surface acidity, but it would reduce the basic properties. This is looking at the electron donating functional groups on the surface. We've also measured the difference in polarity based on different levels of relative humidity. So what we can see here, if we look at the PPZ sample, that when we increase percent, when we increase relative humidity, we're increasing polarity up until about 7% RH, where we see a drop. This indicates that this sample could be stable up until about 70% RH. However, with the polypropylene on its own, we can see that when we increase relative humidity up until about 50%, then we start to see a kind of drop off and some variation afterwards. This is suggesting that the polypropylene sample is only quite stable up until 50% relative humidity. And introducing the zine protein actually contributes to making this material a lot more resistant to relative humidity. We've also calculated the surface energy of the materials at different relative humidities. So calculate the specific dispersive and the total surface energy. So if we compare the 0% RH, the two materials appear quite similar. And what we can see is with regards to the polypropylene sample, the specific surface energy doesn't really change much with increasing humidity. What we can see with polypropylene sample as well is that with an increase of humidity, you're getting an overall increase of total surface energy. With the polypropylene, with the zine protein, we're actually seeing quite a variation between our total surface energy. So from 0% we see quite a drop off from 60%, which then goes back and increases 70 and 80% RH. So it's interesting to see the effect of applying a zinc protein to the polypropylene material and how this affects its stability. And we can understand this using the igcse. So here are some publications regarding to the case studies that I've shown. I've also introduced another publication with regards to some cellulose particles which is quite interesting and it shows how with a change in particle size size and introducing hydroxyl groups has significant change on the dispersive earth's energy. We also have some case studies regarding to a few of the case studies that we've mentioned as well. Finally, I just wanted to acknowledge some of the companies that we've worked quite closely with and who benefited from the IUC SEA and who we have collaborated in research with.
More from Prof.

Webinar: Advances in Measuring Gas and Vapor Permeation Through Membranes and Barrier Polymers

Webinar: Determining Solubility Parameters of Bacterial Cellouse Through Energy of Adsorption

Online Webinar: Recent Technological Advances in Adsorption Based Direct Air Capture

Online Webinar: Surface Area of Pharmaceutical Ingredients at Real World Conditions by IGC



Hybrid Workshop: Measuring Material Vapour Pressure Properties Using Advanced Sorption Technique

PCL Hybrid Workshop: Recent Advances in the Characterisation of Pharmaceutical Powders


Using Advanced Techniques to Test the Performance of Recycled Bathroom Tissue | A video summary
