In this 10‑minute presentation, Dr. Jonathan Reichental argues that data is the essential catalyst for modern government and city innovation. He opens with the 2010 Haiti earthquake, showing how SMS‑based crowd‑sourced data was mapped to direct first‑responders, illustrating data’s life‑saving potential. He then touches on predictive policing as a controversial but data‑driven approach to crime prevention. Recognizing that cities face mounting challenges—aging infrastructure, congestion, climate change, equity—Reichental shares a concrete case study from his tenure as Palo Alto’s chief technology officer: turning a simple spreadsheet of road‑quality scores into an interactive, map‑based decision tool built with Google Maps API and student developers. He expands the lesson to a broader municipal strategy: “Open Data by Default,” making non‑sensitive datasets publicly available to spur community, academic, and vendor innovation. He highlights the Palo Alto 311 app, which crowdsources photos of city issues, generating rich real‑time data that enables proactive service delivery. Throughout, he stresses the importance of data storytelling and visualization to translate raw numbers into actionable insights for leaders and citizens alike. He concludes by promoting his smart‑city book, social media channels, and an invitation for ongoing collaboration to build better cities worldwide.
Chapters
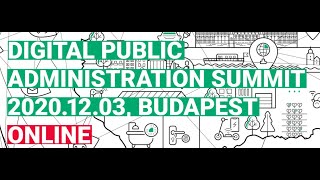
Hello, everyone. I'm Dr. Jonathan Reichental, and I'm really delighted to be here at the Digital Public Administration Summit in Budapest, Hungary, here in December 2020. I would love to be there in person, but unfortunately, during these pandemic times, it's impossible for me to be there. It's one of my favorite cities, one of my favorite countries, and I have family that come from Hungary. So I have a terrific affinity with your nation. I'm here to speak with you for the next few minutes on why I believe data is the fuel of government innovation. Now, if we go back to Haiti. In January 2010, there was a devastating earthquake that destroyed a lot of the infrastructure of the capital and many parts of the country. And one thing is interesting, while a lot of telecommunications failed, the text messaging, the SMS infrastructure was functioning. And one of the problems that occurs after an earthquake or natural disaster up to this point was the question of how do you get the first responders and resources to the right places? How do you schedule that and optimize the delivery of that? There's been a science around that for many decades. But in 2010, text messaging was used to identify where most help was needed. And the data from that text messaging was mapped against a website that allowed first responders and supplies to get to the right place at the right time. It was the first time that we saw a significant integration of data, telecommunications, and an event like this to bring to bear the right resources. And it became clear that this was the right way to move forward. If we could use data, we could save lives and we could recover much more quickly. So ever since then, data has grown to be a very important part of how we look at our societal needs and also an innovative part of it. Here, for example, is one example of using data to be able to predict crime in the future. This is called predictive policing, and it uses a whole variety of data resources to be able to make these probability predictions. It's not without its controversies, but it's an interesting new area of exploration. Using data now in, in a government context is giving government leaders completely new capabilities. Our cities are a big deal. This is our home. Our future belongs to cities. Over half the world already lives in cities, and it's going to grow to about 68% by 2050 and then grow beyond that. Our lives will be lived here in terms of work and healthcare and education and entertainment. But when you look at many cities around the world, they're struggling. They have a lot of challenges. So we need to be able to bring forward all varieties of technology and innovation in order to help push forward with solving a lot of these challenges. Issues like infrastructure decay and congestion and carbon emissions and climate change and air quality problems, even problems of inclusion and issues with equality and equity. We certainly have a long list of challenges ahead of us to solve. Now, I want to talk to you about a particular example, a particular case study of work I did quite some time ago, almost 10 years ago now, that informed me about the critical role that data was going to play in government. Here's your typical data set. It looks familiar, probably to most of you. It's columns and rows of data. And sometimes when policy leaders have to make decisions, they're dealing with enormous amounts of data just like this, and it's hard to make decisions. The question then becomes, how can we take something like this and make it more consumable and make it easy for government leaders and all sorts of stakeholders to make better decisions relative to our communities? So I had an idea of how we would do this. And, and in traditional Silicon Valley style, I used the back of a napkin to draw what I thought would be a better way to render this more complicated information. And I designed, on a napkin, sort of an interface that would have pictures that represented the data, and it would have an easy search function and a way to better understand what this was talking about. Now, what is this? Well, this is the quality of roads in the city that I was the chief technology officer for, for many years here in city of Palo Alto in Silicon Valley, California. And here at the, on one side of it, you'll see there's, there's a score, and the score says what the quality is like. So we're making decisions relative to what repairs to make and what roads to resurface based on bad quality. It's an important decision for any community because you want to have good infrastructure, right? So I thought, well, how can we do this creatively? So you can see in this picture, a much younger version of myself went up to a university in Palo Alto, you may know it, it's Stanford University. And I engaged with some students to say, how can we take this data and use my napkin, this thing, and be able to help decision makers in Palo Alto and make better choices? And so they took this, and over the course of about 24 hours, they ended up creating something that looked like this, an interface that just used the raw data that we had, but made it much more consumable and accessible. And they didn't go and take, you know, hundreds and hundreds of thousands of pictures, no These pictures were simply from Google Maps because Google Maps has already done the hard work and, and they make available the content basically for free through an API. So they had everything they needed, they had the data and they had the pictures at the data from Google, of course, and they combined it with a little few layers of code and suddenly we had a better solution. So data was going to be game changing here. The problem is how do you scale this? Not everybody has a Stanford University up the street. So you can't just march up there and get this problem solved for you. And that's what I want to just share with you, ways that you can begin to scale it in your community. The first thing I would recommend is every city has an abundance of data. This is one thing that is not in scarcity. Make that data available to as many stakeholders as possible. We initiated a process in Palo Alto called Open data by default, which meant that unless the data was regulated or protected in some way, we made it available to, to anyone who would want it. And the people who would want it would be community members, academics, the city hall itself, of course, and also vendors who could potentially build solutions off of that data. And that's what we began to see. We began to see vendors create graphs and better visualizations of city data. This one in particular here was around budget information showing spend actuals versus budget over a period of time. We had competitions where we asked people to solve problems for us and they created all sorts of interesting urban innovation solutions like this one. This one here is for being able to understand what's happening in the community relative to construction. Something that many communities are very interested in. Now what else did we do with data? Well, many communities today have apps that are used for delivering government services. It's much more convenient to have everything run on a phone. Right? You enjoy that? Well, we had one called Palo Alto 311 and with Palo Alto 311 you could take pictures of graffiti or potholes or abandoned bicycles or trash and send that photo to city hall where somebody would go and try to repair it for you. Well, what's interesting about this is that it's collecting an awful lot of really rich data and we can take that back end data and we put it in to a schematic where we could show near real time what was happening in our community. Suddenly they could see the whole city and have great sense of all the issues happening at any point in time. Not only does that inform them of what the problems are, but, but it also helps departments be proactive and solve problems in the long term by understanding what the underlying trends are. Now finally, data is important for cities to communicate and for governments to communicate what the issues are. So we gotta become really good at data storytelling and use visualization because once people have information, they can make better decisions, they can be more better partners with with city hall and things can get done. It is this accelerant, it is this engine of change in our communities if we do it right now. If you like this topic and you want to learn more, I'm very privileged to have written the book, the International Book on how to Create better Cities. And particularly in this book I write a lot about unleashing data to change the game and how we run our cities. Whether it's there in Budapest, Hungary or in Helsinki, Finland or Dublin, Ireland or New York City or Moscow, Russia, wherever it is, I give advice and I'd recommend if you, if you like this topic and you want to learn more, check out smart city book.com it's available in Hungary. It's available to anyone watching this video live or on recording and I'd love for you to take a look at it and have it help you in in your journey. This is always the case now where we have a presentation like this, it's very quick, but this is just the beginning of the conversation. I want you to engage with me on a long term conversation and how we create better cities and better communities. So connect with me. Here's my Twitter handle. If you like Twitter, connect here. I'll always respond to your questions and you can see more of my videos and the things I'm doing in this space and you can get them on Twitter. You can also find me on LinkedIn. I encourage you to reach out and connect with me and I look forward to seeing you and hearing from you and I wish you the very best for the rest of this important conference there in Budapest, Hungary. I hope to get out there soon and see all of you and enjoy your great food and your great country. Thank you very much for the privilege. I will see you again soon. Thank you very much.